
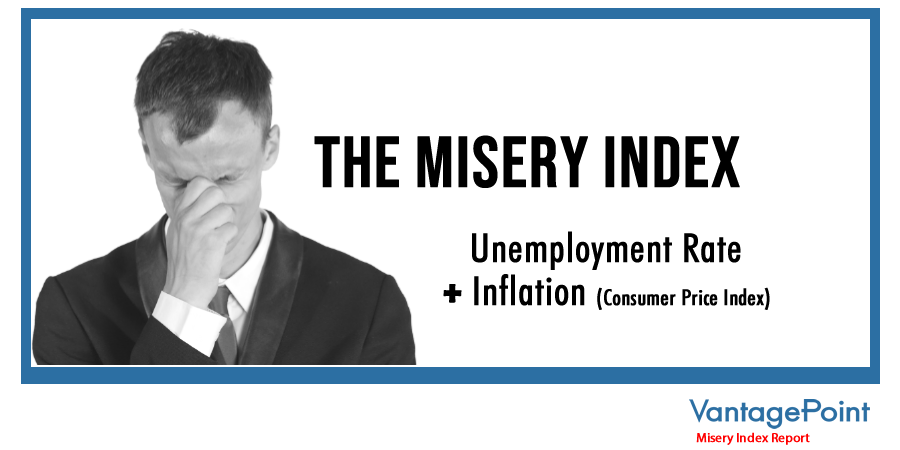
Inflation is all over the headlines. No doubt you have felt its pinch whenever you buy groceries or gasoline. One of the key metrics that economists, politicians, and traders are required to pay attention to is the Misery Index. This barometer is designed to measure the degree of economic distress felt by the average citizen. The Misery Index is calculated by adding the inflation rate and the unemployment rate together. The higher the number is, the worse off its citizens are doing financially.
It’s quite common to hear journalists and talking heads in the media discuss the Misery Index particularly in election years, as it usually portends large political changes on the landscape.
If the Misery Index is rising, chances are very real the political party in power is very much threatened.
The beauty of the Misery Index is in its simplicity. You add two inputs together and it provides the “happiness quotient” of a country. Everyone who sees it can immediately understand it. Anyone can understand it calculates the number of people out of work and the rate at which prices change. In a nutshell, it provides a bird’s eye view of the consumer experience in the marketplace.
However, economists and intellectuals have often made small changes to the Misery Index formula by adding two more inputs in the hopes that these additional factors would add more granular understanding.
Misery Index = [Unemployment + Inflation + Bank‐Lending Rate] − Real GDP Growth
Even with these added changes the Misery Index is simple to understand. If the Index is rising it means economic unhappiness is generally increasing and vice versa.
In election years, you will often hear the Misery Index promoted as a means of Presidential or Congressional approval or disapproval.
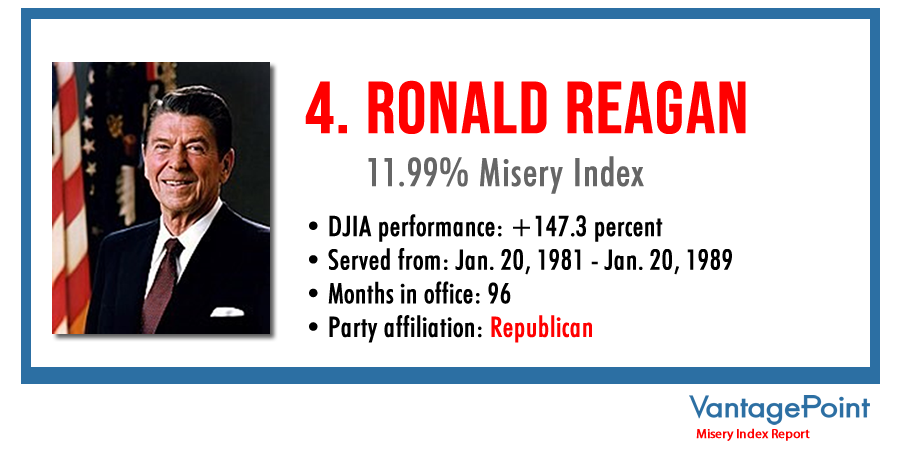
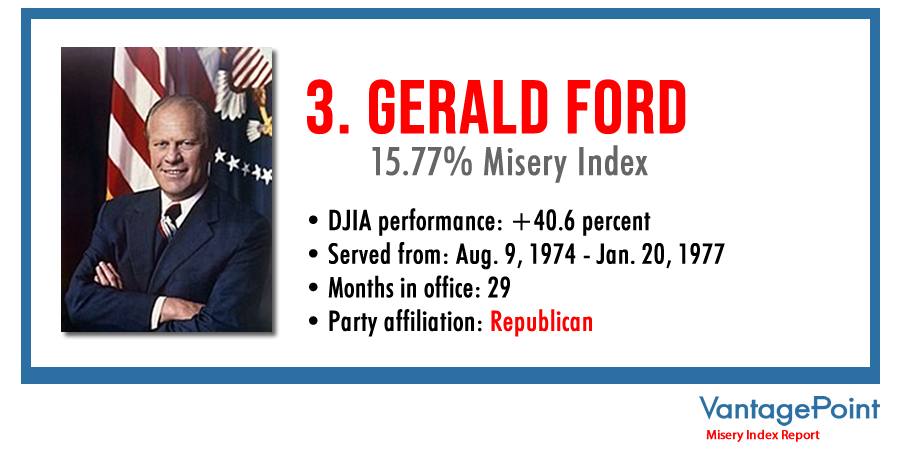
In the 1976 presidential election, candidate Jimmy Carter used the Misery Index of 12.6% against President Gerald Ford and won the Presidency. Four years later candidate Ronald Reagan used the Misery Index of 19.7%, against President Carter to defeat the Carter and win the Presidency for the Republican party.
From a macroeconomic and geopolitical perspective, the Misery Index quickly shines a light where the greatest suffering in the world is. When the Misery Index is high in a country you will often find its citizens look to vote “with their feet” by migrating somewhere else where there is greater stability and opportunity. Simply put, the Misery Index is a thermometer of discomfort.
For example, here are the Misery Index calculations for troubled countries around the world in 2020:
Venezuela: 3,827%
Zimbabwe 547%
Sudan 193.9%
Lebanon 177.1%
Suriname 145.3%
Libya 105.7%
Argentina 95%
Iran 92.1%
Angola 60.6%
Madagascar 60.4%
Brazil 53.4%
South Africa 49.3%
Haiti 48.9%
2022 is a year where midterm political elections occur in the United States. I have no doubt in the coming weeks and months you will hear the Misery Index discussed by pundits as the media works harder and harder to grab attention and eyeballs to their fear-based messaging.
Here is a chart of the Misery Index in the United States going back to 1948 created by InflationData.com.
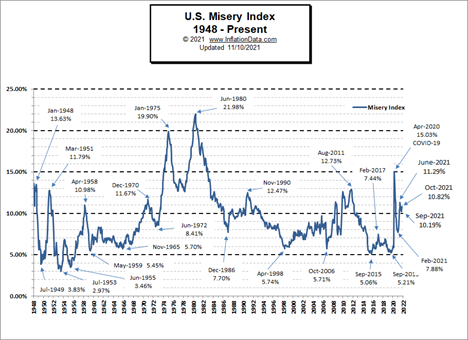
Currently, in the United States the Misery Index is at 10.8 percent. During the lockdowns and beginning of the pandemic the Misery Index temporarily hit a high of 15.13%.
What makes this metric of great concern to traders and investors is we are seeing unemployment and inflation increase simultaneously which is what happened in the stagflationary 1970’s.
Unemployment is still significantly above the prepandemic level, and about 35 million workers are unemployed because they either expect more government stimulus or simply cannot afford daycare, transport, and other costs. Wall Street is playing a game of chicken with the Fed as to whether the tapering of bond purchases to the tune of $15 billion less every month will occur.
Inflation is hurting businesses, eroding their margins. You may have heard that Dollar General ($DLTR) which was recently featured in our Vantagepoint Stock of the week is changing the base pricing model of their stores. Dollar Tree will sell more and more items that cost more than a dollar! Given time and due to the rampant nature of inflation they will effectively become the Five Dollar Store which brings back distant memories of the five and dime stores, where you could buy products for a nickel and dime, which no longer exist either.
However, what the current Misery Index is showing is that this so-called economic recovery trumpeted by a massive spending bill has strong erosion of purchasing power accompanied by the general loss of welfare while consumer savings are depleted.
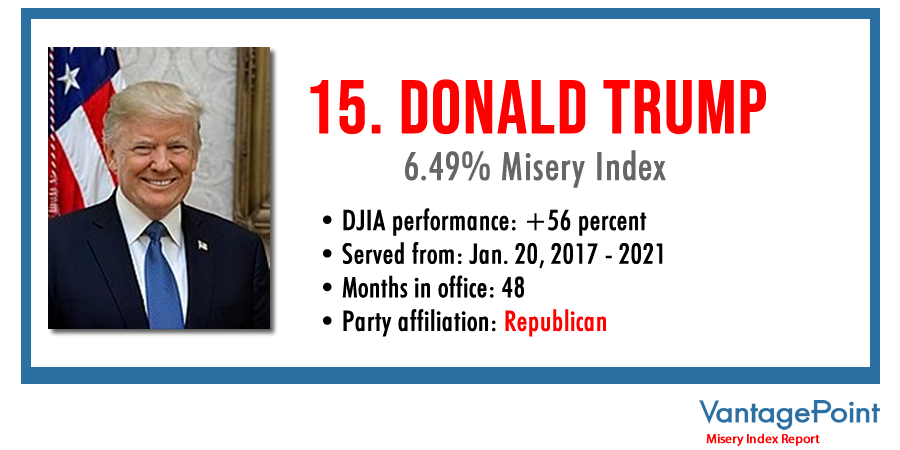
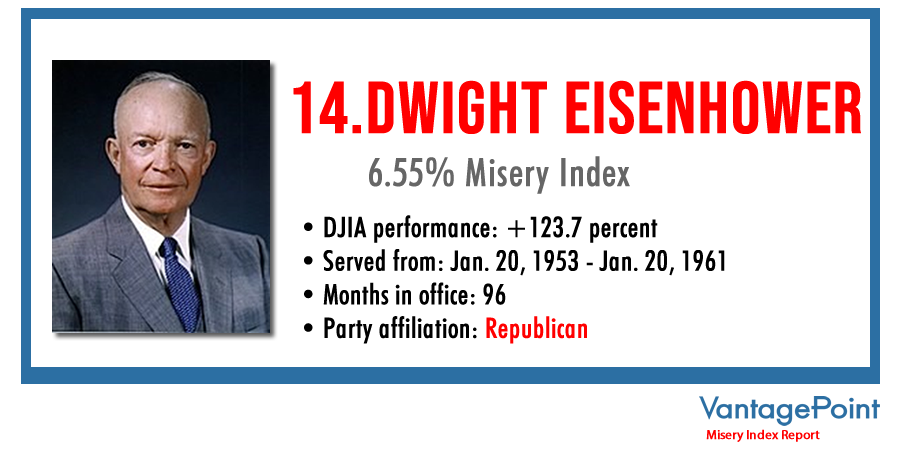
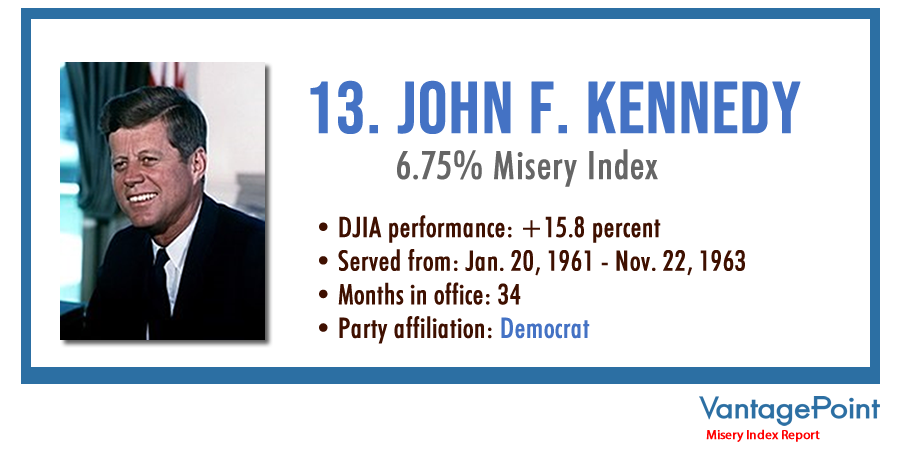
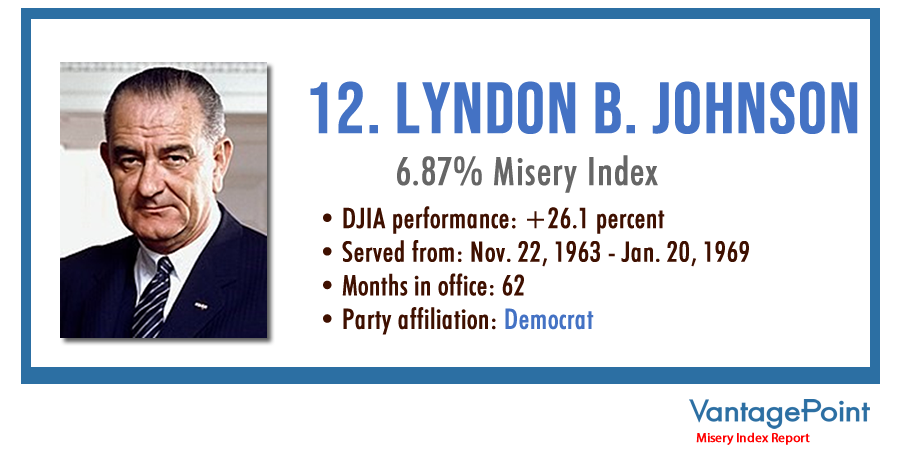
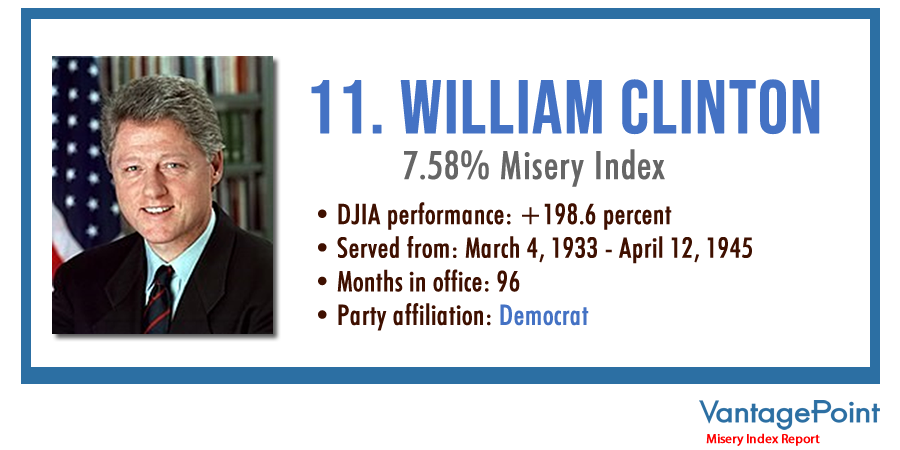
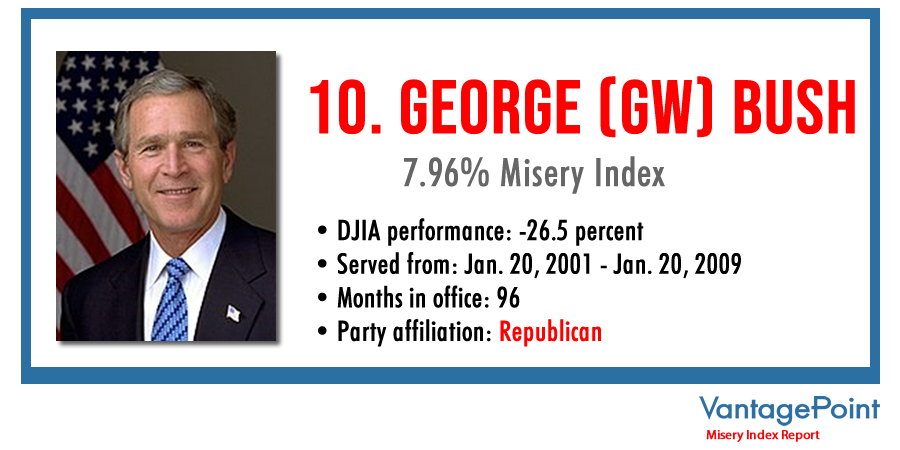
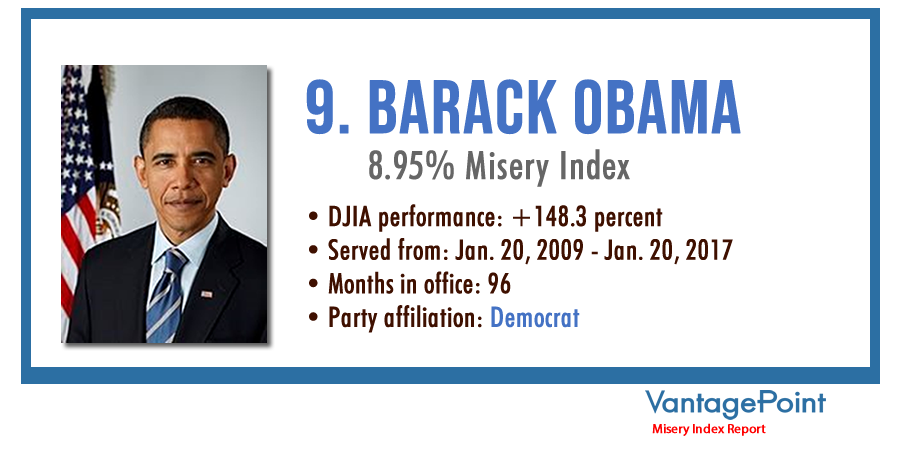
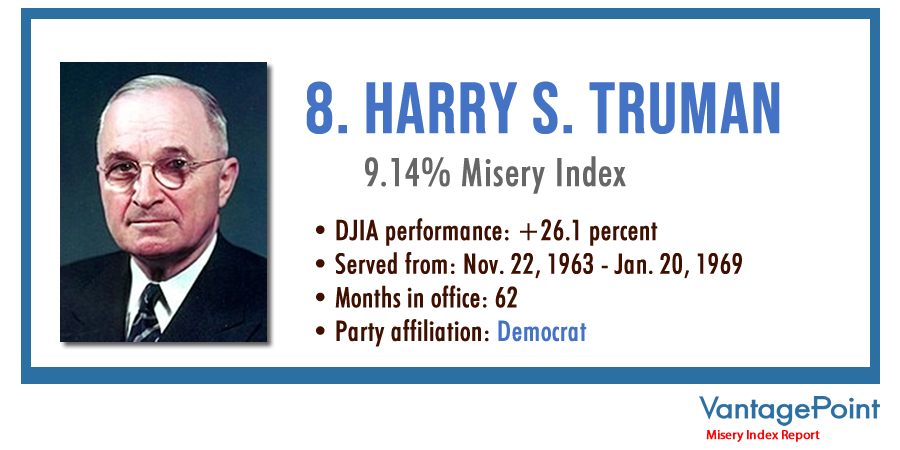
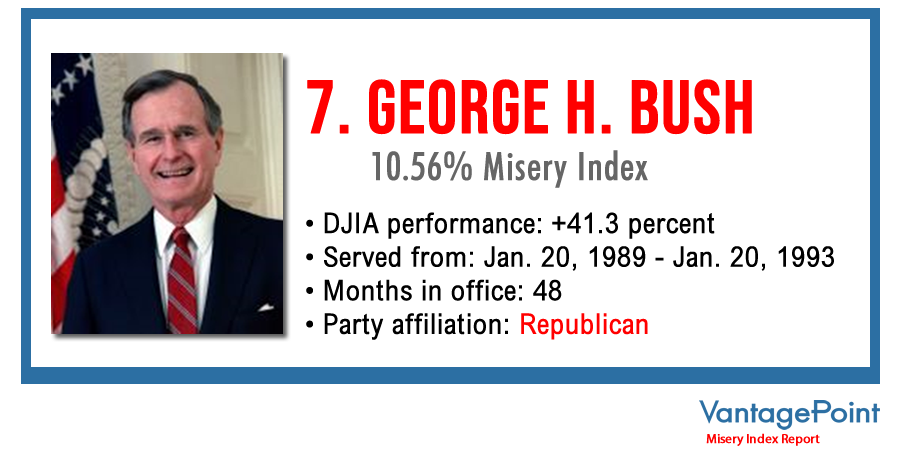
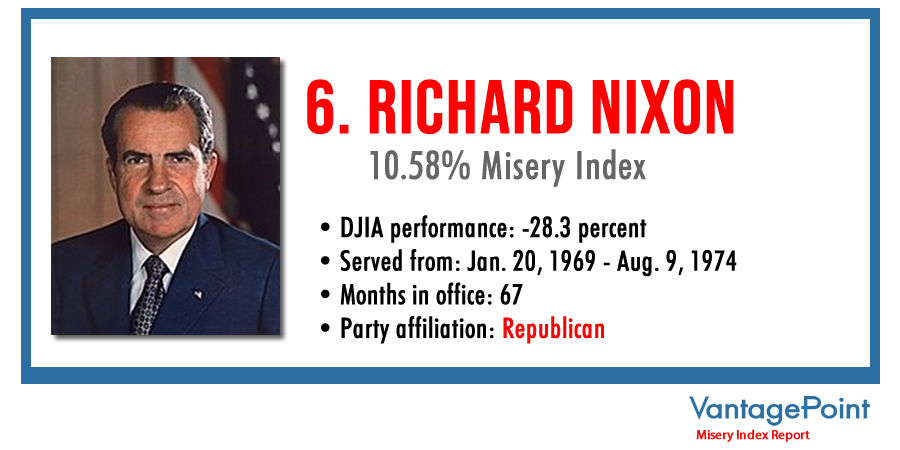
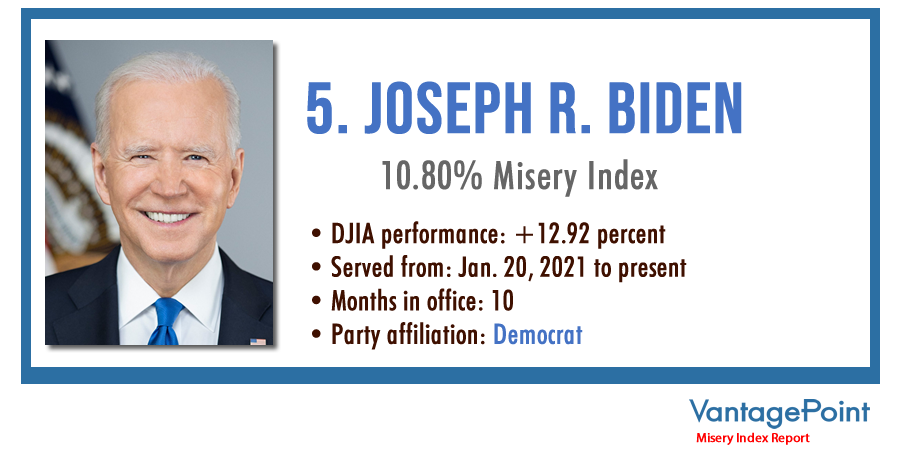
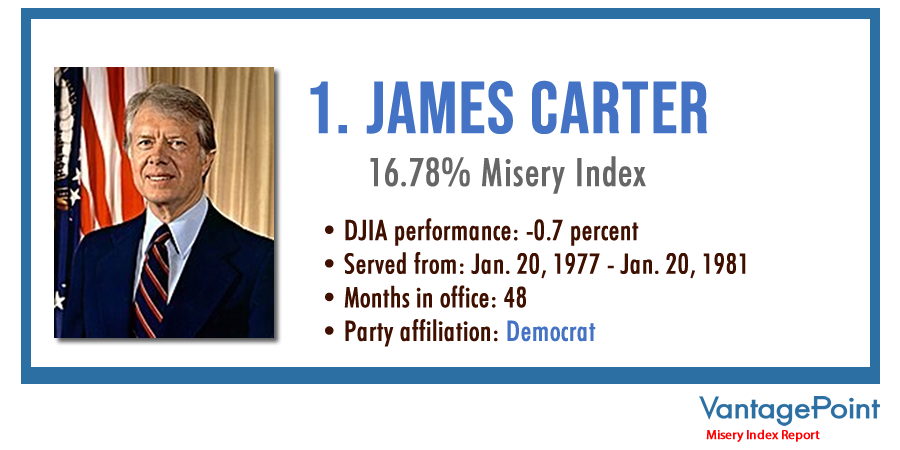
I thought it would be interesting to analyze the Misery Index from and investor and trader’s viewpoint. To make sense of the current stagflationary economy, let’s look at the question, what does the Misery Index mean for traders? I’ve computed the average Misery Index value for each President since FDR and added the performance of the Dow Jones Industrials Average during their term in office. The numbers were quite shocking to me, as the results are completely counterintuitive.
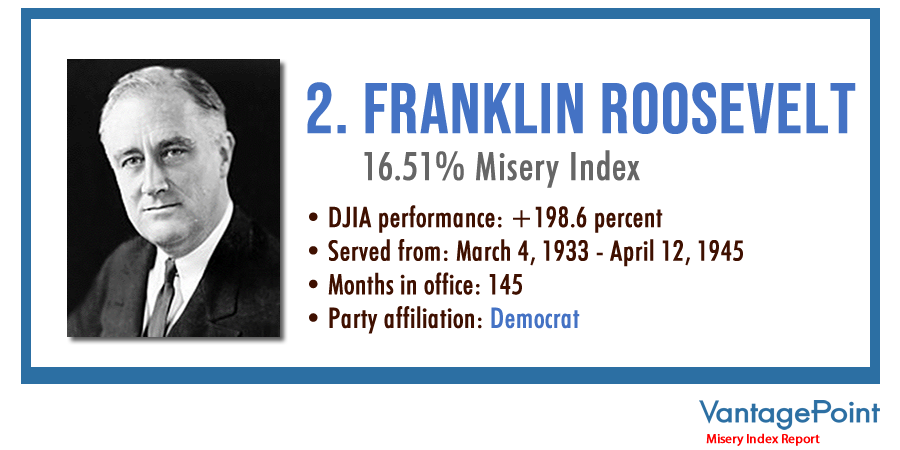
Since Franklin Delano Roosevelt took office at the height of the Great Depression, we have had 15 Presidential administrations in the United States. Here is the ranking of Presidents from lowest Average Misery Index to Highest Average Misery Index over the last 88 years, accompanied by the performance of the Dow Jones Industrials during their term in office.
Fascinating, isn’t it?
These results are completely counterintuitive.
You would think that a high Misery Index would cause the stock market to crumble. Yet the inflation showed up as higher asset prices as well!
This doesn’t, by any means, imply you should always buy stocks. These snapshots represent an entire presidential term often which was accompanied by very substantial stock volatility. But what has fascinated me is the reality that it is hard to make a strong negative long-term case for substantially lower stock prices based upon only a high Misery Index value.
Below is all the data that I used to make these calculations presented on a simple spreadsheet which shows the Misery Index for every year going back to 1933. You can quickly see that FDR had the highest all time Misery Index value at 25.79% and Harry Truman had the lowest Misery Index reading at 3.5%. What is noteworthy and of concern to me is that the Biden Presidency after only 10 months is in the #5 position for the Misery Index out of 15 Presidents.
As a trader the biggest challenge you face is related to how effective your decision-making process is. It is very easy to make decisions which are logical but still completely incorrect and unprofitable!
This is why artificial intelligence as a tool is indispensable for traders.
The one thing that A.I. does better than any human is its entire purpose is to keep you on the right side, of the right market at the right time. A.I. combined with neural networks is all about using a vast amount of data and history to determine the best move forward.
One of the themes that we have been writing about extensively over the past few years is that it is impossible to save money by traditional methods. As our blog points out if 10-year T-Notes are yielding 1.6% and Inflation is at 6.2% the difference is a negative real rate of return of 4.6%. This is the yield you earn by investing in the full faith and credit of the U.S. Federal Government. This past week I was watching CNBC and Ray Dalio was on. He said:
“Cash is not a safe investment, is not a safe place because it will be taxed by inflation.”
Could this simple insight be what is driving the stock markets higher? Average savers are forced to take larger risks because inflation taxes them if they do nothing. So, the only game in town is to chase yield in stocks?
However, I don’t worry too much about it because I allow A.I. to aid in my decision-making process.
What it all boils down to is what are you doing with the knowledge you acquire?
What has your performance been like in the markets?
How consistent have you been in finding a systematic method of managing risk?
Do you have the tools and ability to find the strongest trends at right time in this economic environment?
How do you go about making sense of the massive disruption that the printing press is creating in the pricing of financial assets?
What is your plan for maintaining your purchasing power as this trend accelerates?
The answers that artificial intelligence brings to the table might surprise you.
Discover why artificial intelligence is the solution professional traders go-to for less risk, more rewards, and guaranteed peace of mind.
Think about these things as you protect your hard-earned money. We live in very interesting times.
Remember, artificial intelligence has decimated humans at Poker, Jeopardy, Go! and Chess. Why should trading be any different?
Knowledge. Useful knowledge. And its application is what A.I. delivers.
You should find out. Join us for a FREE Live Training.
We’ll show you at least three stocks that have been identified by the A.I. that are poised for big movement… and remember, movement of any kind is an opportunity for profits!
Discover why artificial intelligence is the solution professional traders go-to for less risk, more rewards, and guaranteed peace of mind.
Visit with us and check out the A.I. at our Next Live Training.
It’s not magic. It’s machine learning.
Make it count.

IMPORTANT NOTICE!
THERE IS SUBSTANTIAL RISK OF LOSS ASSOCIATED WITH TRADING. ONLY RISK CAPITAL SHOULD BE USED TO TRADE. TRADING STOCKS, FUTURES, OPTIONS, FOREX, AND ETFs IS NOT SUITABLE FOR EVERYONE.
DISCLAIMER: STOCKS, FUTURES, OPTIONS, ETFs AND CURRENCY TRADING ALL HAVE LARGE POTENTIAL REWARDS, BUT THEY ALSO HAVE LARGE POTENTIAL RISK. YOU MUST BE AWARE OF THE RISKS AND BE WILLING TO ACCEPT THEM IN ORDER TO INVEST IN THESE MARKETS. DON’T TRADE WITH MONEY YOU CAN’T AFFORD TO LOSE. THIS ARTICLE AND WEBSITE IS NEITHER A SOLICITATION NOR AN OFFER TO BUY/SELL FUTURES, OPTIONS, STOCKS, OR CURRENCIES. NO REPRESENTATION IS BEING MADE THAT ANY ACCOUNT WILL OR IS LIKELY TO ACHIEVE PROFITS OR LOSSES SIMILAR TO THOSE DISCUSSED ON THIS ARTICLE OR WEBSITE. THE PAST PERFORMANCE OF ANY TRADING SYSTEM OR METHODOLOGY IS NOT NECESSARILY INDICATIVE OF FUTURE RESULTS. CFTC RULE 4.41 – HYPOTHETICAL OR SIMULATED PERFORMANCE RESULTS HAVE CERTAIN LIMITATIONS. UNLIKE AN ACTUAL PERFORMANCE RECORD, SIMULATED RESULTS DO NOT REPRESENT ACTUAL TRADING. ALSO, SINCE THE TRADES HAVE NOT BEEN EXECUTED, THE RESULTS MAY HAVE UNDER-OR-OVER COMPENSATED FOR THE IMPACT, IF ANY, OF CERTAIN MARKET FACTORS, SUCH AS LACK OF LIQUIDITY. SIMULATED TRADING PROGRAMS IN GENERAL ARE ALSO SUBJECT TO THE FACT THAT THEY ARE DESIGNED WITH THE BENEFIT OF HINDSIGHT. NO REPRESENTATION IS BEING MADE THAT ANY ACCOUNT WILL OR IS LIKELY TO ACHIEVE PROFIT OR LOSSES SIMILAR TO THOSE SHOWN.

