
![]()
Ford Motor Company is an American multinational automobile manufacturer headquartered in Dearborn, Michigan, United States. It was founded by Henry Ford and incorporated on June 16, 1903. The company sells automobiles and commercial vehicles under the Ford brand, and luxury cars under its Lincoln luxury brand. Ford is the second-largest automaker in the United States and the fifth largest in the world. They have a market cap of $80.7 billion and trade on average 83 million shares per day.
Ford is quickly transitioning from petroleum-fueled cars to electric vehicles (EVs). Through 2025, the company has announced that it will invest $30 billion to compete with Tesla, and other EV start-ups. While it is still early in the EV marketplace, Ford has built plants in Kentucky and it has an equity stake in Rivlan, an EV startup that is expected to go public in 2022 at a $55 billion valuation. The stock is up more than 100% year-to-date, but people still have trouble believing that it is an electric car company.
Over the next decade, petroleum-fueled cars may appear to be phased down very quickly, along with their manufacturing plants and dealer networks. Ford has worked very diligently and strategically to position itself in the electric vehicle marketplace as a leader. Ford has announced that it will phase out petroleum cars by 2040.
What has Wall Street excited is that Ford is planning to produce 1 million EV’s with FORD batteries by 2025. Ford has spent $30 billion for 40% of its global vehicle volume to become all electric by 2030.
Since the beginning of the pandemic, automakers like Ford have struggled to acquire materials to be able to build inventory. Specifically, automakers have been largely disabled by the computer chip shortage. There has been a lot of speculation that Ford ($F) may have gotten a large supply of computer chips because it has seen its September sales increase dramatically. Automakers sold 27% less units in 2021 than in 2020. However, Wall Street Analysts believe that auto sales will rebound sharply to pre-pandemic levels once the computer ship shortage is eliminated. Earnings for the last quarter were expected at .27 cents per share and Ford came in at .57 cents per share beating expectations easily. During a very difficult 3rd quarter, filled with supply chain breakdowns, Ford surprised industry analysts with very resilient growth in earnings.
In this weekly stock study, we will look at and analyze the following indicators and metrics as are our guidelines which dictate our behavior in deciding whether to buy, sell, or stand aside on a particular stock.
- Wall Street Analysts’ Estimates
- 52-week high and low boundaries
- Best Case – Worst Case Analysis
- Vantagepoint A.I. Forecast (Predictive Blue Line)
- Neural Network Forecast
- Daily Range Forecast
- Intermarket Analysis
- Our trading suggestion
We don’t base our decisions on things like earnings or fundamental cash flow valuations. However, we do look at them to better understand the financial landscape that a company is operating under.
Analysts Ratings
Based on 8 Wall Street analysts offering 12-month price targets for Ford Motor in the last 3 months. The average price target is $19.00 with a high forecast of $22.00 and a low forecast of $12.00. The average price target represents a -5.85% change from the last price of $20.18. Over the past two months Ford has rallied from $13 to almost $21 per share.
52-week High Chart
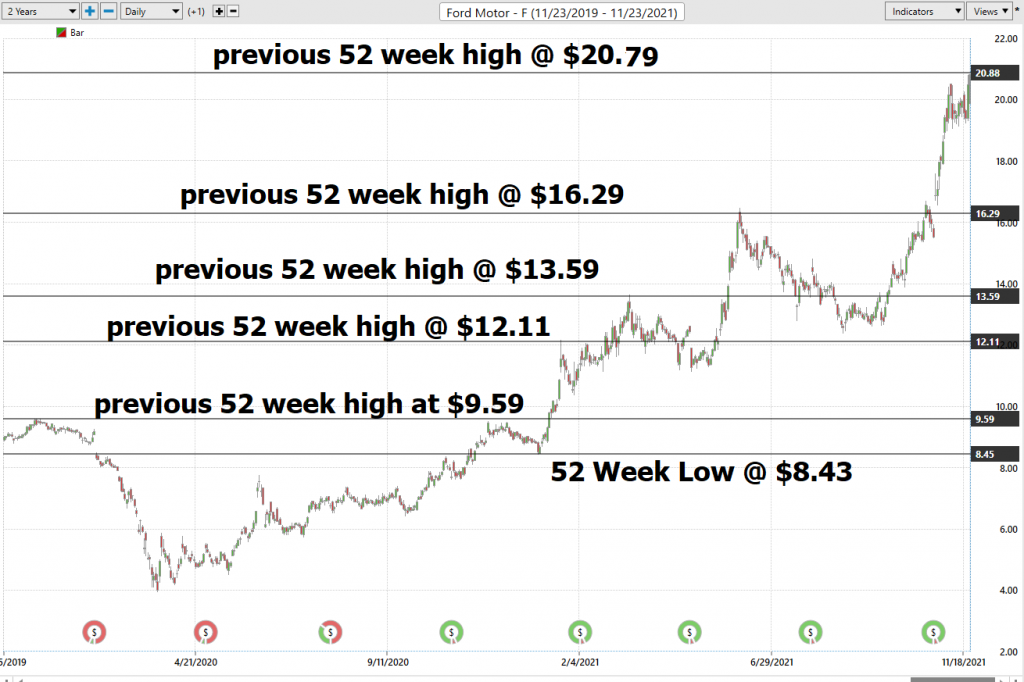
Over the past 52 weeks, Ford has traded as high as $20.79 and as low as $8.43.
That provides us with an annual trading range of $12.36. This tells us that the average weekly trading range for Ford stock is .23 cents. We also like to divide the current price by the annual trading range to get a better idea of a broad-based volatility measure. Currently, volatility is 60.8% which means that it would be normal should current volatility to continue for prices one year from now to be 60.7% higher or lower from their current level.
The chart above is a two-year chart of Ford ($F). Observe how important the 52-week high boundary has been in anticipating price movement. We always advise traders to pay very close attention to the 52-week high and low boundaries whenever you look to invest or trade a stock. You can see that once the 52-week boundary is breached the stock tends to run and continue making new highs.
You can see in the following chart of $DLTR that the analyst markers of value accompanied by the 52-week range give us a very effective backdrop of “perceived value.” These boundaries are what we think drives the news narrative and informs us as to the most solid trading opportunities in the stock.
The adage in trading that is very workable is that old resistance becomes new support. This perspective worked extremely well in navigating $F over the last year.
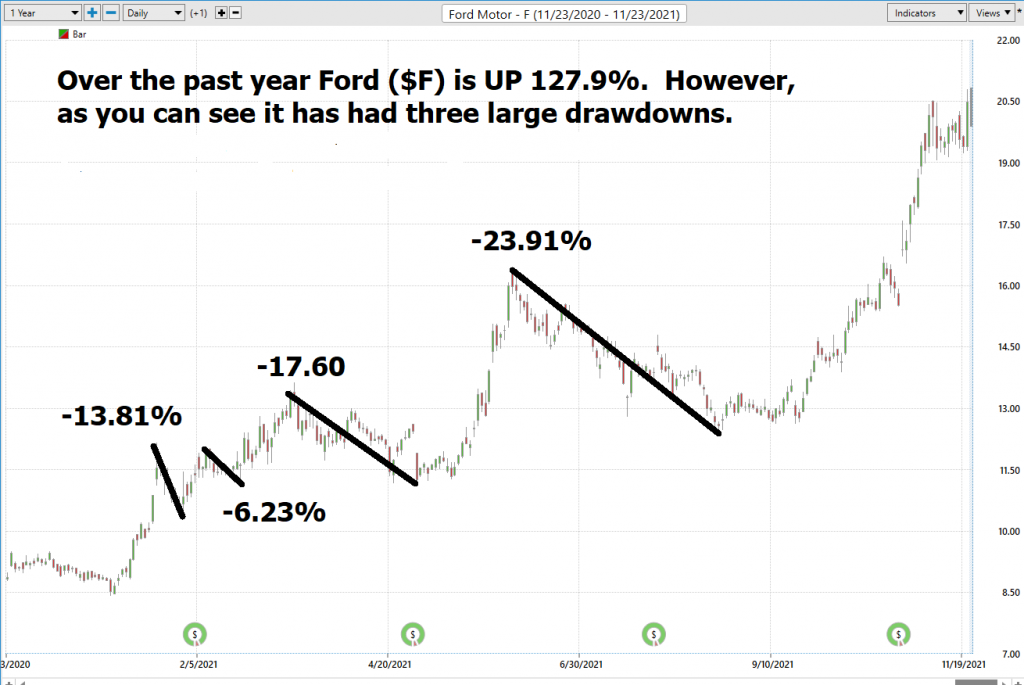
Best Case – Worst Case Analysis
Next, we want to evaluate $F in comparison to the performance of the major stock market indexes which we have greater familiarity with and then look at the drawdowns of the stock over the past year to get a worst-case scenario idea for any conclusions that we might reach when we trade this asset.
Over the past year $F is up 127.9%
The Dow Jones Industrials are up 21.1% over the past year.
S&P 500 is UP 31.01% over the last year.
Russell 1000 Small Cap is up 29.96% in the past year.
The NASDAQ is up 64.92%
You can see with FORD ($F) we have an asset that has outperformed the broader stock market indexes by a minimum factor of 2 and by as much as a factor of 5.
The Vantagepoint A.I. Analysis
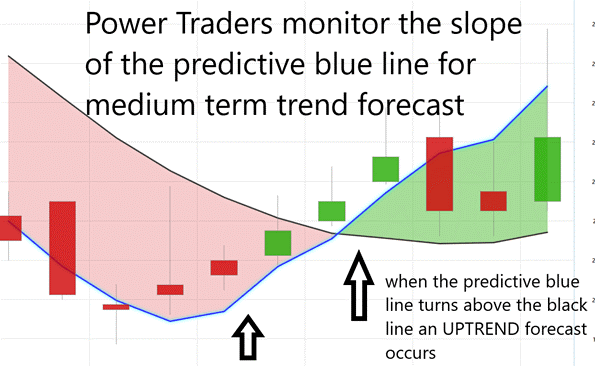
Using VantagePoint Software and the artificial intelligence, traders are alerted to trend forecasts by monitoring the slope of the predictive blue line. The black line is a simple 10 day moving average of price which simply tells you what has occurred in the market. The predictive blue line also acts as value zone where in uptrends traders try to purchase the asset at or below the blue line. The blue line is computed through Vantagepoint’s patented technology which looks at the artificial intelligence, neural networks as well as the intermarket to arrive at the best move forward.
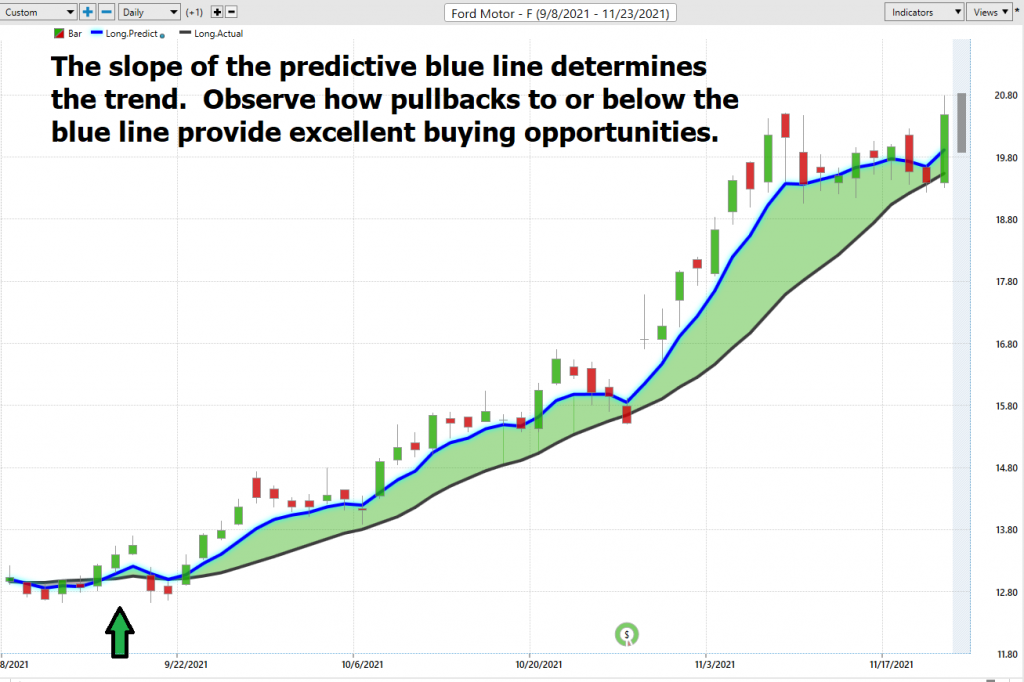
In studying the chart above pay close attention to the relationship between the black line and predictive blue line.
The predictive blue line, on the other hand utilizes that Vantagepoint patented Neural Network and Intermarket Analysis to arrive at its value. It looks at the strongest price drivers of an asset through artificial intelligence and statistical correlations to determine its value.
Whenever we see the predictive blue line move above the black line, we are presented with an UP-entry opportunity. This is what occurred on September 15, 2021, at $13.22 per share. Power traders use the predictive blue line in helping to determine both the value zone as well as the trend direction.
Observe how the SLOPE of the predictive blue line started moving higher a few days before its moving above the black line. Over the last 49 trading sessions, Ford ($F) is up $6.83 per share or 51%.
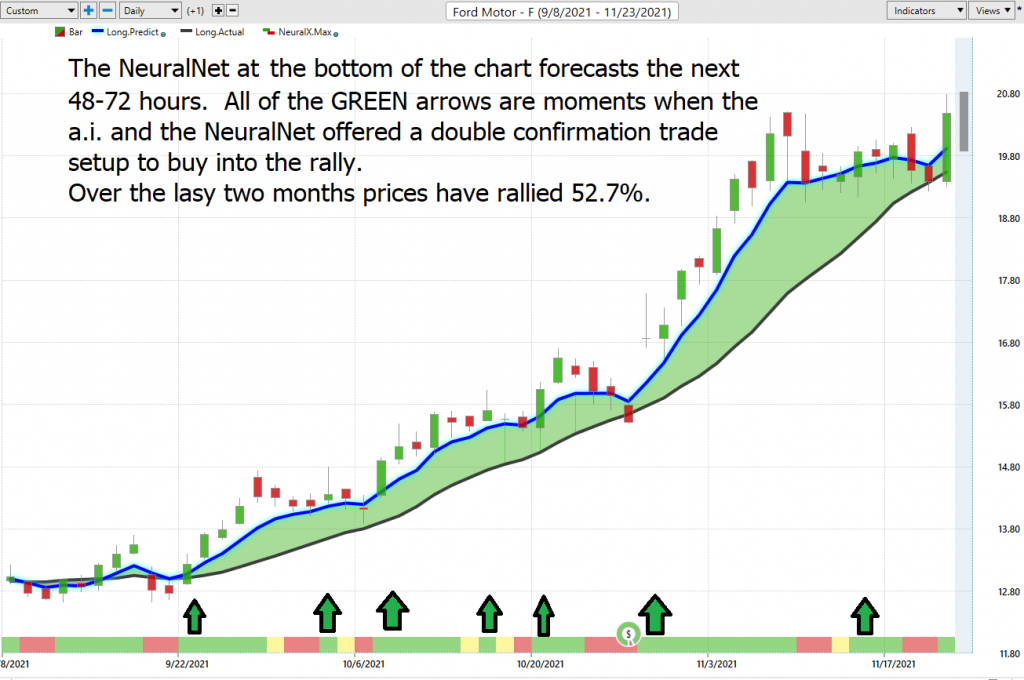
Fine Tuning Entries with The Neural Net IndicatorAt the bottom of the chart is the Neural Network Indicator which predicts future strength and/or weakness in the market. When the Neural Net Indicator is Green it
communicates strength. When the Neural Net is Red it is forecasting short term weakness in the market.
We advocate that Power Traders cross reference the chart with the predictive blue line and neural network indicator to create optimal entry and exit points. A Neural Net is a computational learning system that uses a network of functions to understand and translate massive amounts of data into a desired output, consistently monitoring itself and improving its performance.
Power Traders are always looking to apply both the neural network and A.I. to the markets to find statistically sound trading opportunities. We refer to this as a “double confirmation” setup and look for the predictive blue line to slope higher and to be confirmed by the Neural Net at the bottom of the chart.
On the chart below, the UP arrows show all the times when the double confirmation setup between the a.i. and the neural network occurred. Over the last 7 weeks there have been six instances where Power Traders were forewarned of continuing higher prices in Ford Stock.
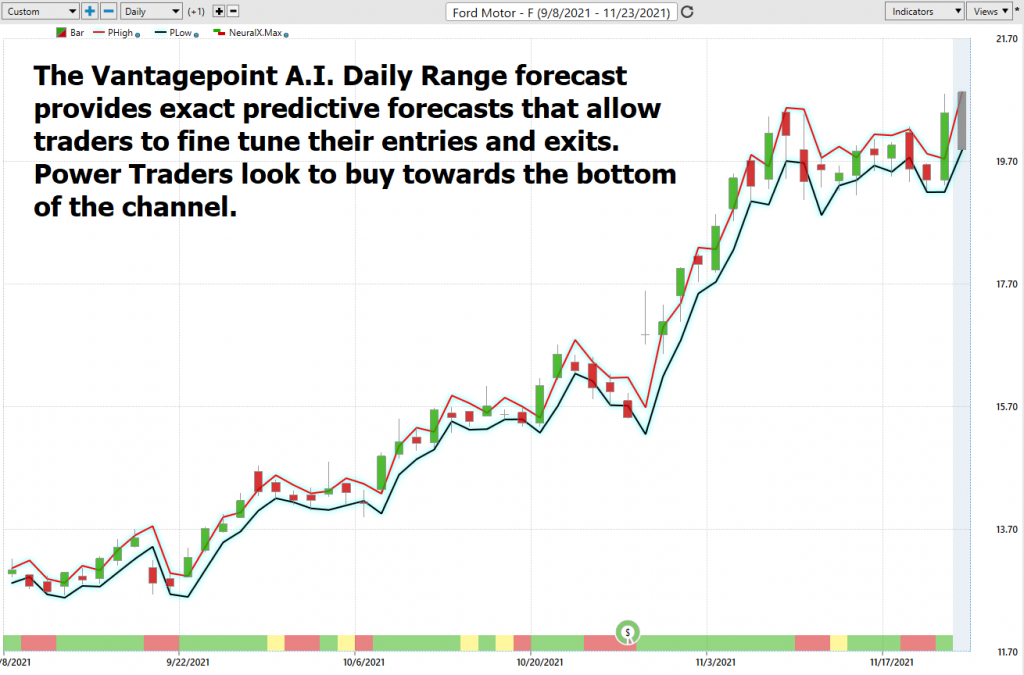
VantagePoint Software Daily Price Range Prediction
One of the powerful features in the Vantagepoint A.I. Software which Power Traders use daily is the Daily Price Range prediction forecast.
This forecast is what permits Power Traders to truly fine-tune their entries and exits into the market.
Here is the price chart of Ford ($F) during the most recent runup featuring the Daily Price Range forecast and the Neural Net Indicator.
In summary, the trend turned up. Prices have surged since that forecast and the trend remains firmly UP. Traders have had numerous opportunities to purchase $F towards the lower end of the daily price forecast to fine-tune their entries.
For short-term traders the guidance that the Daily Price range forecast provides is invaluable.
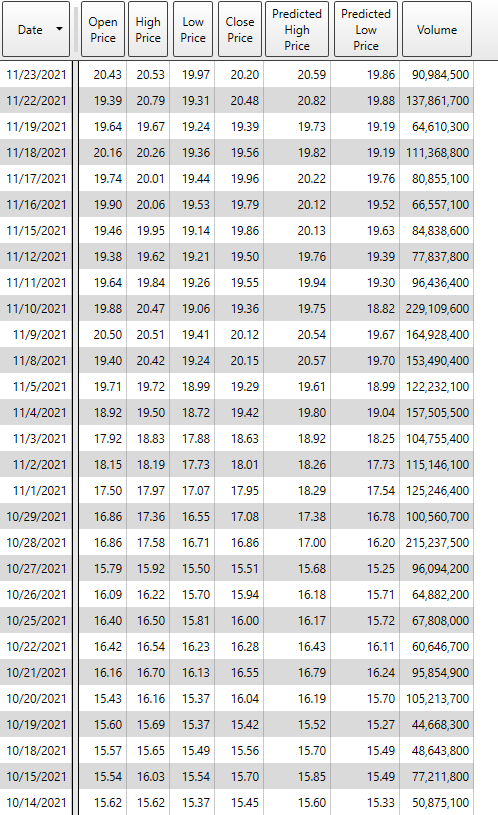
Power Traders use a price level below the predictive low price to place their protective sell stops in the market in case a sudden reversal was to occur.
Observe how the predictive price low also provided numerous short term entry opportunities for traders to buy Ford as it was trending higher.
This information can also be presented in a tabular format, including VOLUME which is very helpful for analytical traders who want to add their own flavor to a trading opportunity.
Intermarket Analysis
What makes the Vantagepoint Software truly unique is its ability to perform Intermarket analysis and to locate those assets which are most interconnected that are responsible for driving the price of Ford ($F) higher or lower.
Studying the charts can always provide objective realities in terms of locating support and resistance levels which become very clear on a chart. But we live in a global marketplace. Everything is interconnected. The billion-dollar question for traders is always what are the key drivers of price for the underlying asset that I am trading?
These intangibles are invisible to the naked eye yet show very high statistical correlations. If you ask ten Wall Street Analysts why Ford is rising you will get 10 different responses.
Small changes in Interest rates, Crude Oil Prices, and the Volatility of the dollar amongst thousands of other variables affect the decisions companies must make to survive in these very challenging times. Trying to determine what these factors are is one of the huge problems facing investors and traders.
The following graphic allows you to see the key drivers of Ford price. These include stocks, futures, and ETF’s. Studying this graphic on a regular basis often uncovers other relevant trading opportunities.
By doing so you can often see which ETFs are most likely acquiring NVDA as well as uncovering other industries which affect Ford’s ($F) price movement.
Earlier in this study we mentioned how Wall Street is speculating that Ford had acquired semiconductors chips for its automobiles far ahead of its competitors.

When we look at the Intermarket Analysis for Ford stock, we get a bird’s eye view of what assets are most interconnected to driving price. The key players in these sectors will often show up and present other relevant trading opportunities worth exploring.
Conclusion
Ford is up 127% year over year and is surprising Wall Street with respectable earnings as it transitions to become a leading player in the EV market.
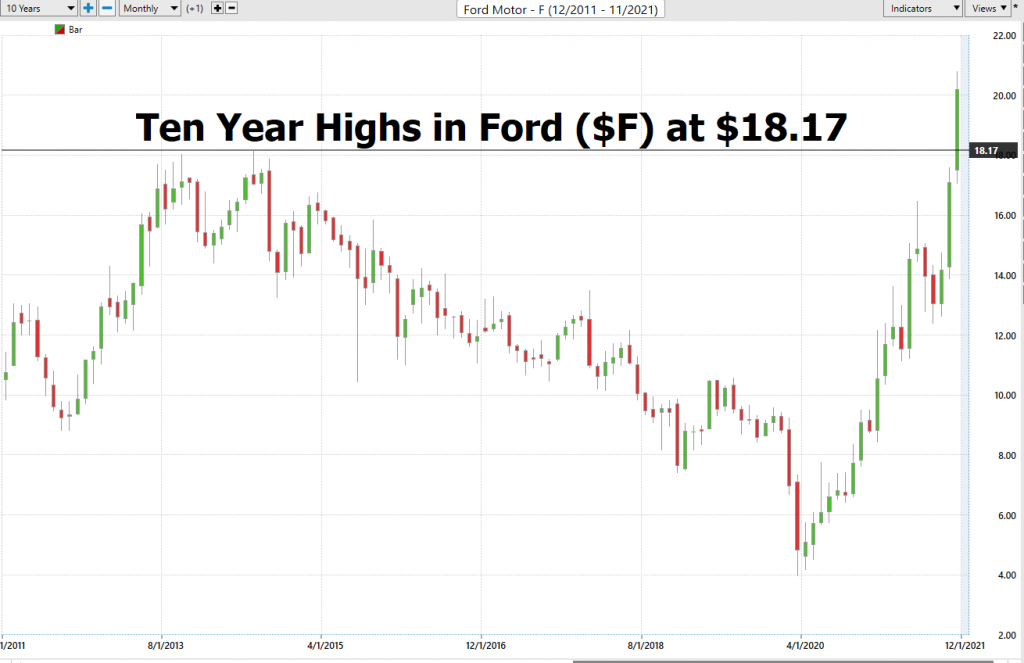
In the most recent weeks Ford stock has not only gone to new 52-week highs but it has surpassed its 10-year highs. In other words, it has not traded at these price levels since 2011! We expect the recent 10 year high to provide significant support. The chart below is the 10-year monthly chart of Ford Stock. Usually, whenever we see a stock breakthrough to new decade highs, we can expect to see the old resistance level at $$18.17 provide significant support moving forward.
Ford’s most recent moves to pursue electrification of its commercial fleet also bodes well for its leadership position.
The key risk for the entire auto industry as it recovers post pandemic is supply and affordability. Car prices increasing by 6% to 10% per year are no inconsequential.
For the third quarter of 2021, Ford beat expected EPS and revenue. The adjusted EPS of 51 cents per share was higher than the expected 27 cents per share expected, and the automotive revenue of $33.21 billion was higher than the $32.54 billion expected. This creates great momentum for the automotive titan. There is tremendous support in Ford stock between $17.50 and current levels. We think the stock will be rangebound before the next earnings call which is scheduled to occur on or around January 27.
The fundamental concern on Ford’s financials is that their massive spending in green vehicles and self-driving cars is likely to strain near-term financials. Their rising debt levels has many longer-term investors concerned. We think there will be better entry points. But make no mistake about FORD they are looking to be a leader in the EV marketplace.
We will re-evaluate our opinion based upon new data that affects the following which we have elaborated on in this study:
- Wall Street Analysts’ Estimates
- 52-week high and low boundaries
- Vantagepoint A.I. Forecast (Predictive Blue Line)
- Neural Network Forecast
- Daily Range Forecast
- Intermarket Analysis
Let’s Be Careful Out There!
Remember, It’s Not Magic.
It’s Machine Learning.

IMPORTANT NOTICE!
THERE IS SUBSTANTIAL RISK OF LOSS ASSOCIATED WITH TRADING. ONLY RISK CAPITAL SHOULD BE USED TO TRADE. TRADING STOCKS, FUTURES, OPTIONS, FOREX, AND ETFs IS NOT SUITABLE FOR EVERYONE.
DISCLAIMER: STOCKS, FUTURES, OPTIONS, ETFs AND CURRENCY TRADING ALL HAVE LARGE POTENTIAL REWARDS, BUT THEY ALSO HAVE LARGE POTENTIAL RISK. YOU MUST BE AWARE OF THE RISKS AND BE WILLING TO ACCEPT THEM IN ORDER TO INVEST IN THESE MARKETS. DON’T TRADE WITH MONEY YOU CAN’T AFFORD TO LOSE. THIS ARTICLE AND WEBSITE IS NEITHER A SOLICITATION NOR AN OFFER TO BUY/SELL FUTURES, OPTIONS, STOCKS, OR CURRENCIES. NO REPRESENTATION IS BEING MADE THAT ANY ACCOUNT WILL OR IS LIKELY TO ACHIEVE PROFITS OR LOSSES SIMILAR TO THOSE DISCUSSED ON THIS ARTICLE OR WEBSITE. THE PAST PERFORMANCE OF ANY TRADING SYSTEM OR METHODOLOGY IS NOT NECESSARILY INDICATIVE OF FUTURE RESULTS. CFTC RULE 4.41 – HYPOTHETICAL OR SIMULATED PERFORMANCE RESULTS HAVE CERTAIN LIMITATIONS. UNLIKE AN ACTUAL PERFORMANCE RECORD, SIMULATED RESULTS DO NOT REPRESENT ACTUAL TRADING. ALSO, SINCE THE TRADES HAVE NOT BEEN EXECUTED, THE RESULTS MAY HAVE UNDER-OR-OVER COMPENSATED FOR THE IMPACT, IF ANY, OF CERTAIN MARKET FACTORS, SUCH AS LACK OF LIQUIDITY. SIMULATED TRADING PROGRAMS IN GENERAL ARE ALSO SUBJECT TO THE FACT THAT THEY ARE DESIGNED WITH THE BENEFIT OF HINDSIGHT. NO REPRESENTATION IS BEING MADE THAT ANY ACCOUNT WILL OR IS LIKELY TO ACHIEVE PROFIT OR LOSSES SIMILAR TO THOSE SHOWN.

