
![]()
Walk into any grocery store spice aisle and you will immediately notice the vast offering of products from McCormick ($MKC). The company is a leader in the flavor industry and distributes spices, seasoning mixes, condiments, hot sauces to the consumer, food manufacturers and the restaurant industry.
McCormick also owns and controls plenty of other recognizable products under the Adolph’s Billy Bee, Cattlemen’s French’s, Lawry’s Old Bay, Thai Kitchen, Stubb’s and Zatarain’s brand names. Its products are sold in 160 countries in tens of thousands of locations.
The company is known as a very attractive long-term investment vehicle for many because it is considered to be a dividend leader. For the last 97 years McCormick has paid out annual dividends to its investors and this practice has allowed it to outpace the S&P 500 by over 57%. For the last 35 years the company has increased its dividend every year.
Make no mistake about it, McCormick was hit hard by the pandemic and economic lockdowns. With restaurants closed this section of their business was decimated. But now that an economic re-opening appears to be occurring the company seems well on its way to recovery.
While the stock is not a highflyer on Wall Street it attracts investors who appreciate slow but steady results, and the increasing annual dividend. $MKC shares are currently yielding 1.6%. Last year their dividend was increased by 10%.
On the last earnings call, the management team at MKC believe that Net Sales growth of 12 to 13% in 2022 is feasible and they are expecting earnings to grow to the $3 per share area.
Since restaurants are opening back up slowly across the country, many on Wall Street are impressed with how well $MKC has held up considering that a major part of their business was decimated by the pandemic and economic lockdown.

With inflation running hot, it is expected that the company will be raising prices which will also help their earnings bottom line.
The McCormick brand has been around since 1889. They have 13,000 employees and are headquartered in Hunt Valley, Maryland.
In this weekly stock study, we will look at and analyze the following indicators and metrics as our guidelines:
- Wall Street Analysts’ Estimates
- 52-week high and low boundaries
- Vantagepoint A.I. Forecast (Predictive Blue Line)
- Neural Network Forecast
- Daily Range Forecast
- Intermarket Analysis
- Our trading suggestion
We only look at things like earnings or fundamental cash flow valuations to better understand the financial landscape that a company is operating under. Our trading approach and only loyalty is to the trend as dictated by the artificial intelligence, neural networks, and intermarket analysis.
Analysts Ratings
Based on top Wall Street analysts offering 12-month price targets for McCormick & Company in the last 3 months. The average price target is $92.33 with a high forecast of $98.00 and a low forecast of $89.00. The average price target represents a 5.47% change from the last price of $87.54.
The next scheduled earnings release for $MKC is on January 27, 2022.
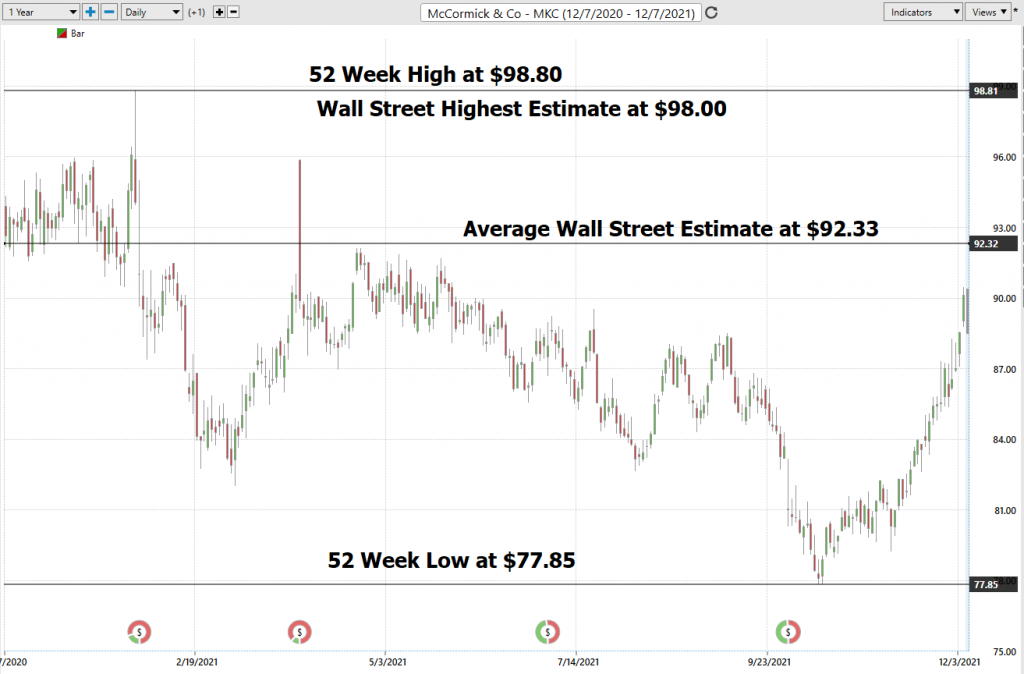
52-week High-Low Chart
Over the last 52 weeks $MKC has traded as high as $98.80 and as low as $77.85. This provides us with an annual trading range of $20.95. When we divide this metric by 52 weeks, we can determine that the average weekly trading range for $MKC is $.402. What we often like to do as well is divide the annual trading range ($20.95) by the current price ($87.51) to provide us with a very basic and generic calculation of how the annualized volatility for $MKC, which is currently 23.9%.
We refer to these as the commonsense metrics which we use as baseline measurements of understanding normal value. We like to publish these boundaries on the chart simply to see how price responded at these different levels.
When doing so we can see a few very important things.
- $MKC is down 3% year over year and has been rangebound with a slightly downward bias.
- $MKC spent 80% of the year trading below the average Wall Street Estimate of $92.33
- $MKC recently made new 52-week lows at 77.85 and bounced sharply towards the Average Wall Street Estimate of $92.33
We always pay attention to where we are in relation to the 52-week trading range. It is very common to see the 52-week high provide very strong resistance to the market until it is breached. Often when the 52-week high is breached we will see the stock price explode higher very quickly over a very short period.
Our rule of thumb is whenever we look at an asset like $MKC is trading 10% or more below how top Wall Street analysts value it, we should pay very careful attention, and place it on our radar. This is how Power Traders use artificial intelligence as their North Star. The recent making of new 52-week lows at $77.85 had $MKX trading 15% below what top Wall Street Analysts had it valued at. In this circumstance the stock goes on our trading radar and we wait for guidance from the a.i.
Best Case – Worst Case Scenarios
We are looking at MKC rallies and declines over the last two years to get a clear picture of how it has behaved during the pandemic and economic lockdown environments.
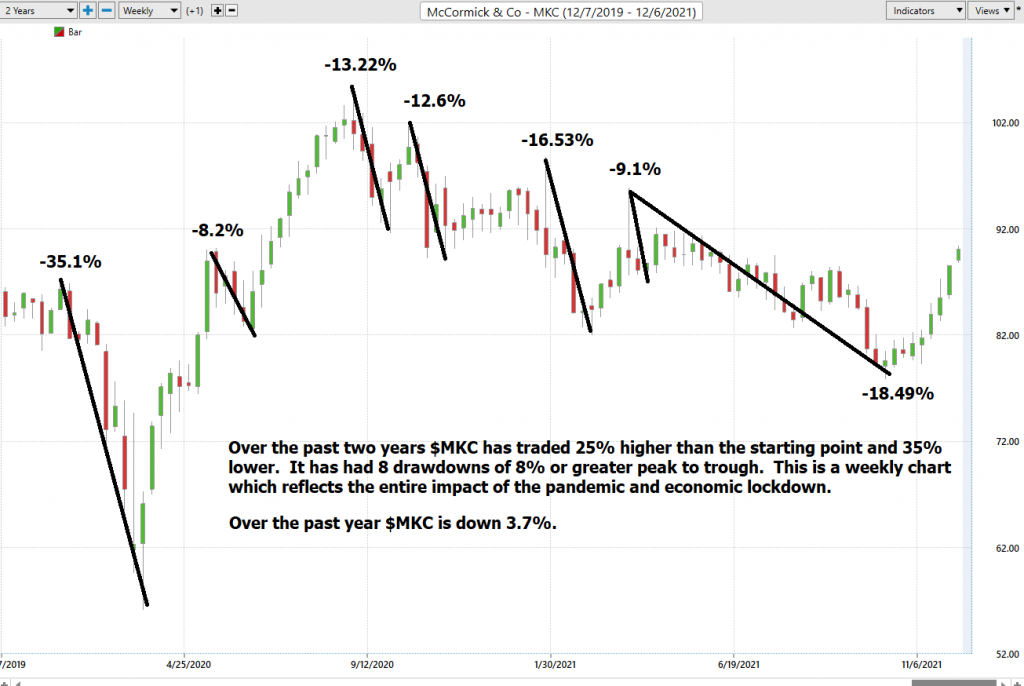
When we study the long term 52-week chart we can look at the best case and worst-case scenarios just to get an eyeball perspective of the risk and volatility of this asset. This is worth doing anytime you invest or trade to monetarily understand what the potential risks and rewards have been over the past year.
This simple practical analysis reveals what the realistic volatility is, and places those values on the chart and allows you to see time duration for the corresponding gains or losses.
It is very unusual to see an asset move up 125%% in a year with this little downside risk.
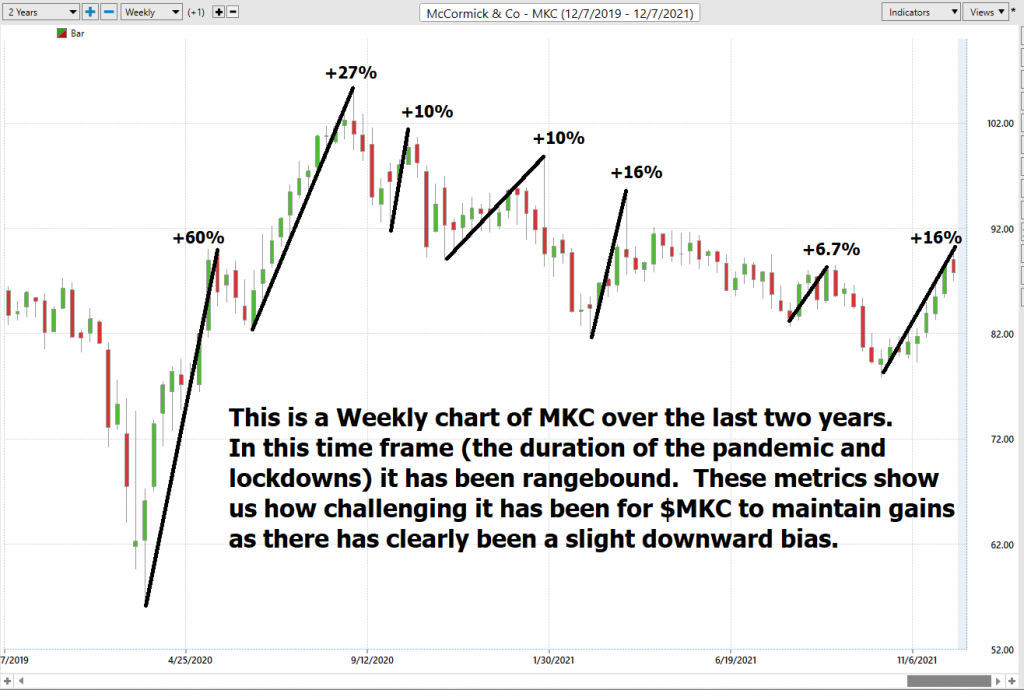
Next, we compare $MKC to the broader stock market indexes to get an idea of its relative performance.
$MKC -3.7% year over year.
S&P 500 Index +26.69%
Dow Jones Industrials +18.5%
NASDAQ +24.47%
Russell 1000 Index +24.9%
So, in $MKC we have an asset over the longer term has outperformed the S&P 500. However, over the last year it has massively underperformed all the broader stock indexes. In fact, it is down 3.7%
What we can learn from this simple analysis is that investors in $MKC have had to take a tremendous amount of price risk over the past two years to capture their 1.6% dividend. Since we are short-term traders, this verifies for us our very short-term time horizon on our trading decisions and allows us to focus on a short-term trend channel to position ourselves accordingly for smaller short-term gains.
The Vantagepoint A.I. Analysis
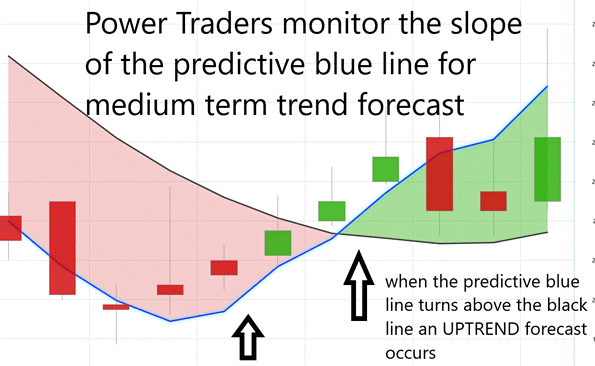
In studying the chart below pay close attention to the slope of the blue line.
The predictive blue line utilizes that Vantagepoint patented Neural Network and Intermarket Analysis to arrive at its value. It looks at the strongest price drivers of an asset through artificial intelligence and statistical correlations to determine its value.
We will look at the last few months of price action in $MKC to understand and harness the power of artificial intelligence. The SLOPE of the predictive blue line determines the price trend. You can see clearly how in September the blue line signaled that the trend was down and the price slid from $86 to $78 over the next several weeks. Then on October 19, 2021 the a.i. signalled a trend change at $80 per share and price over the past 7 weeks has rallied 11.8%.
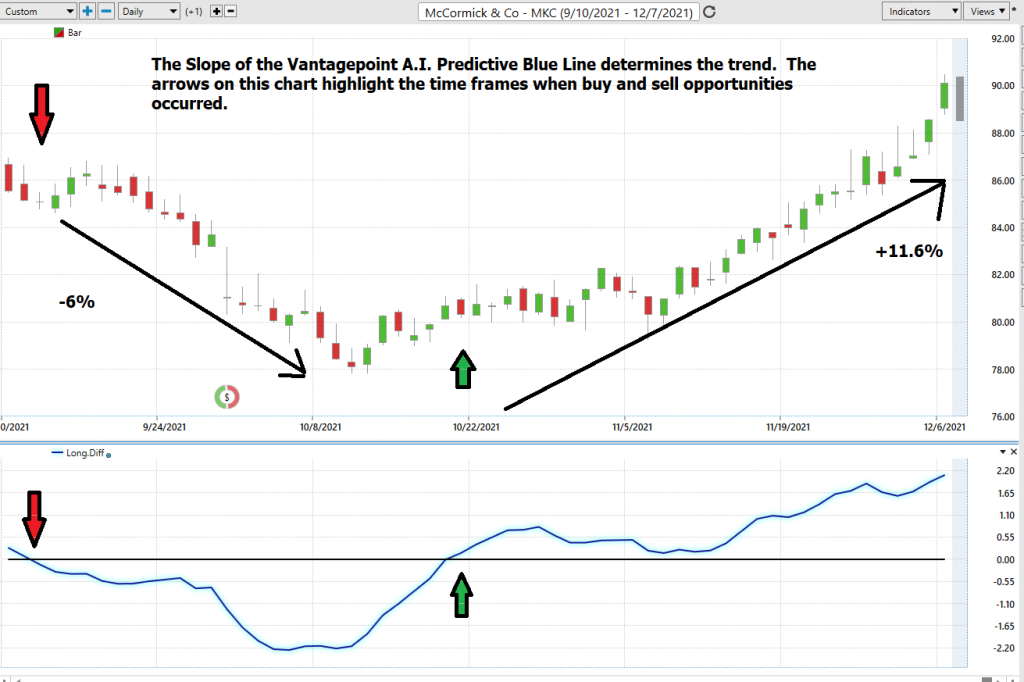
Power traders can use the predictive blue line in helping to determine both the value zone as well as the trend direction. Two consecutive closes above the predictive blue line define where an uptrend forecast occurs.
When the SLOPE of the predictive blue line turns higher it become clear that a change in price direction is upon us.
Observe how the SLOPE of the predictive blue line started moving higher a few days before it moved above the black line. A very strong trend was evidenced by seeing that price was consistently closing above the predictive blue line.
Fine Tuning Entries with The Neural Net Indicator
At the bottom of the chart is the Neural Network Indicator which predicts future strength and/or weakness in the market. When the Neural Net Indicator is green it communicates strength. When the Neural Net is red it is forecasting short term weakness in the market.
A Neural Net is a computational learning system that uses a network of functions to understand and translate massive amounts of data into a desired output, consistently monitoring itself and improving its performance.We advocate that Power Traders cross reference the chart with the predictive blue line and neural network indicator to find their optimal entry and exit points. We refer to this cross referencing as the DOUBLE CONFIRMATION setup. This occurs when both the Neural Index and the a.i. are aligned with regards to their trend forecast.
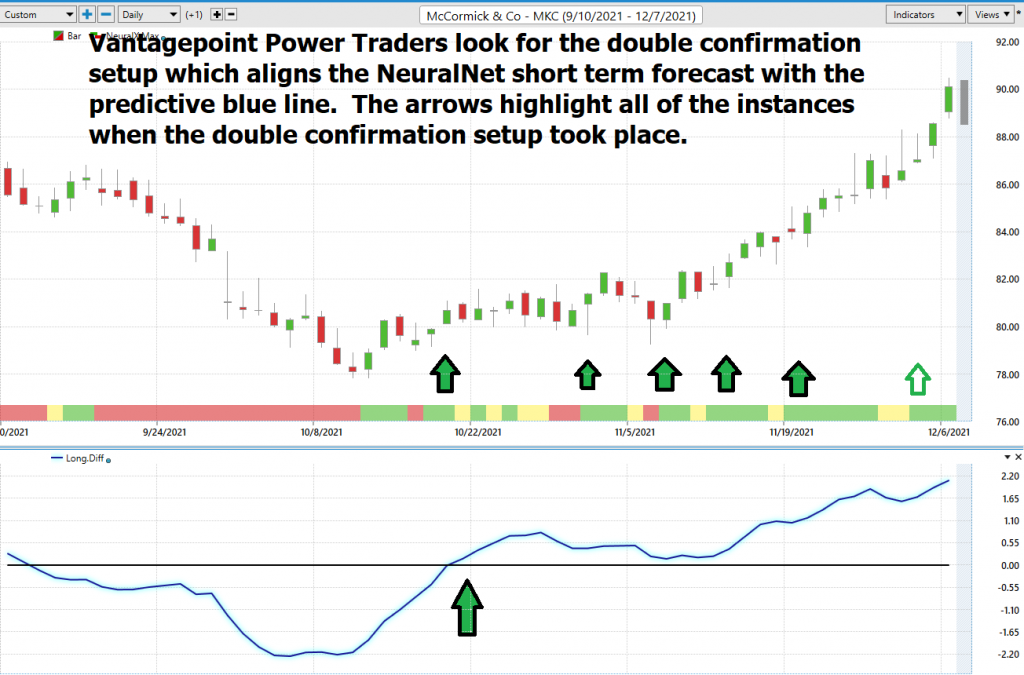
Power Traders are always looking to apply both the neural network and a.i. to the markets to find statistically sound trading opportunities. We advise Power Traders to cross reference the predictive blue line with the Neural Net for the best entry opportunities.
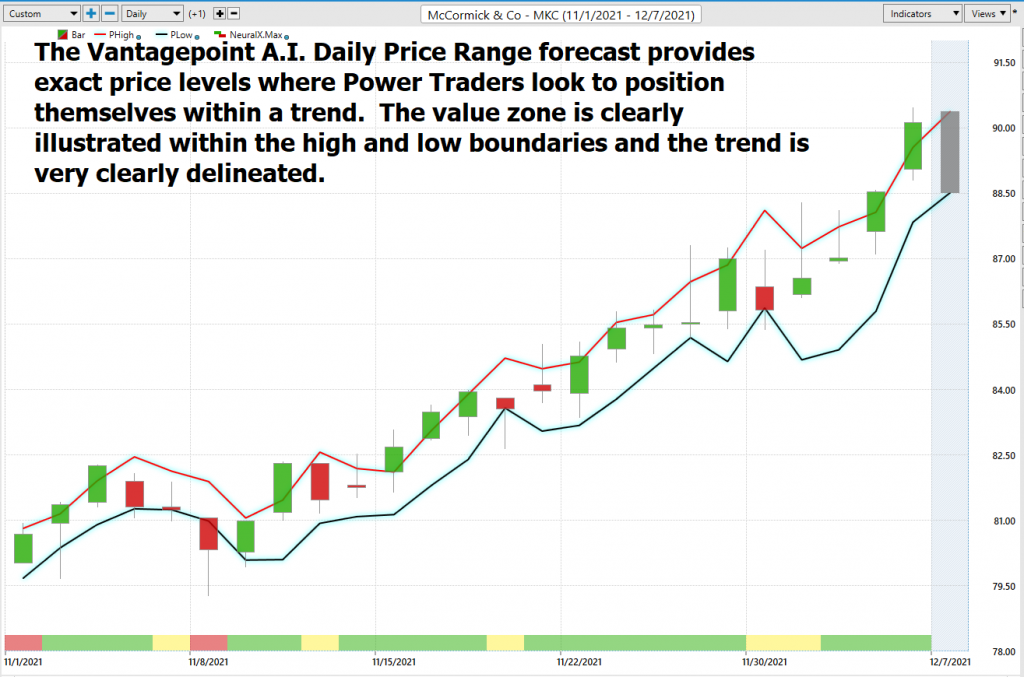
VantagePoint Software Daily Price Range Forecast
One of the powerful features in the Vantagepoint A.I. Software which Power Traders use daily is the Daily Price Range prediction forecast.
Since we have decided the $MKC is a short-term swing trading asset we use the Vantagepoint A.I. Daily Range Price Forecast to define the ideal boundaries of where we could look for opportunities to buy or sell $MKC for short term gains.
This forecast is what permits Power Traders to truly fine tune their entries and exits into the market. Every trader whenever they decide to trade must make the decision regarding where they should get in and where they should get out. The Vantagepoint A.I. Daily Range Forecast helps you answer these questions with exacting precision.
Here is the price chart of $MKC during the most recent runup featuring the Daily Price Range forecast and the Neural Net Indicator.
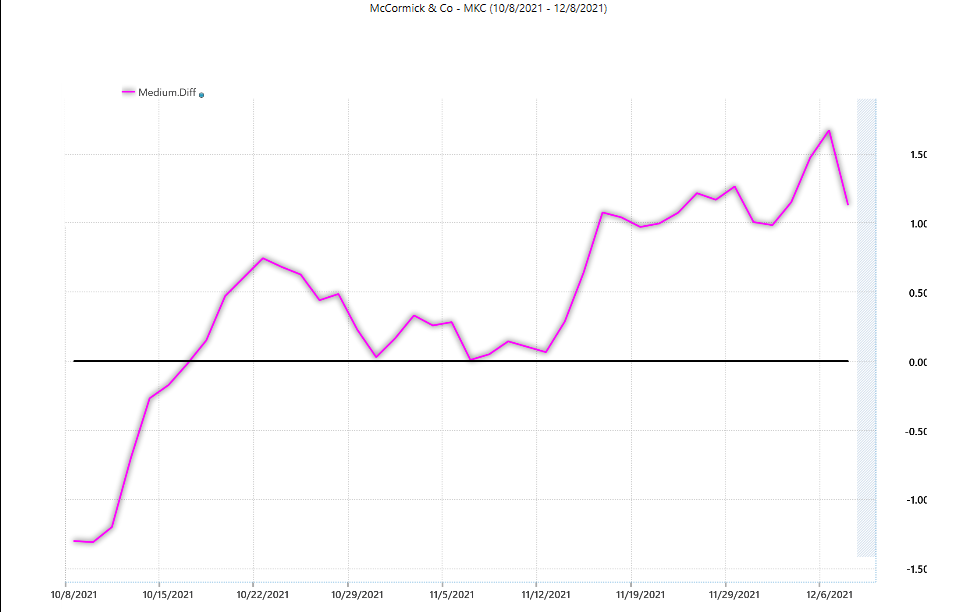
Intermarket Analysis
Why is $MKC down 3.7% year over year? More importantly why did it rally 11% while the broader market indexes were starting to crumble?
Ask that question to 100 Wall Street Analysts and you will get 100 different answers.
The challenge for all investors and traders is differentiating between opinion and fact.
What makes the VantagePoint Software truly unique is its ability to perform Intermarket analysis and to locate those assets which are most interconnected that are responsible for driving the price of $MKC higher or lower.
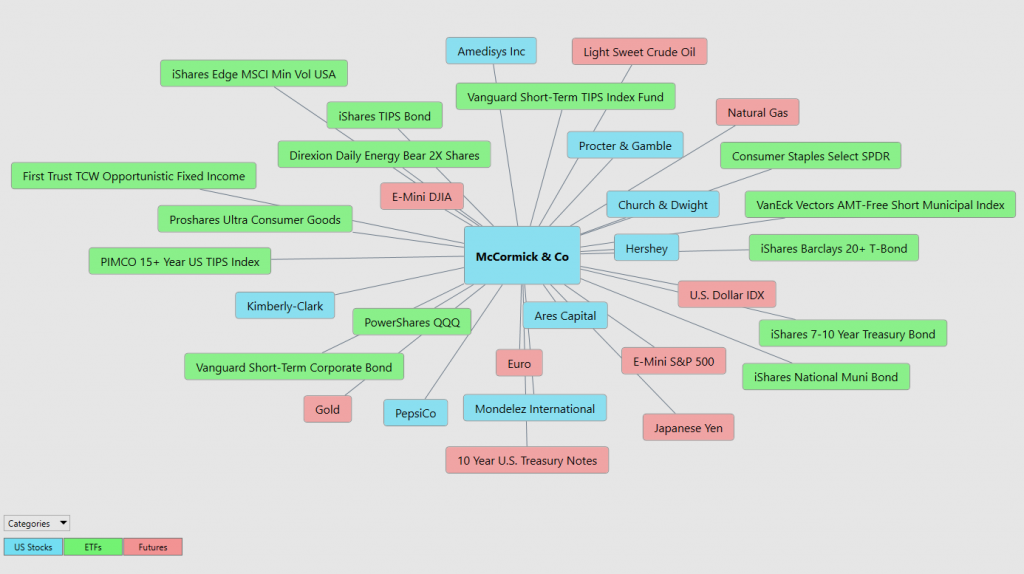
If you like the trend in $MKC and the potential that you see the asset holds, the great opportunity lies in using intermarket analysis to isolate other highly correlated assets that are the key drivers in price for $MKC. This is particularly handy when the broader market stock indexes are selling off and you are looking for stocks or assets that are moving counter to the major stock trends.
Studying the charts can always provide objective realities in terms of locating support and resistance levels which become very clear on a chart. But we live in a global marketplace. Everything is interconnected. The billion-dollar question for traders is always what are the key drivers of price for the underlying asset that I am trading?
These intangibles are invisible to the naked eye yet show very high statistical correlations.
Small changes in Interest rates, Crude Oil Prices, and the Volatility of the dollar amongst thousands of other variables affect the decisions companies must make to survive in these very challenging times. Trying to determine what these factors are is one of the huge problems facing investors and traders.
Our Suggestion
While $MKC is a dividend aristocrat asset, as we have shown in this report, we are not long-term investors. Our loyalty is simply to the trend as dictated by the artificial intelligence, neural networks and intermarkets.
If the blue line is positive, we will look for opportunities to swing trade $MKC and capture as much of the buy and sell channel as possible.
We think $MKC will continue to be rangebound and will re-evaluate our trading opinion should the stock move over its 52-week high. While this is possible, over the shorter term our expectation as confirmed by the a.i. is that price will revert slightly lower and consolidate around the average Wall Street Analysts estimates around $89. We will look to the a.i. for guidance.
Our recommendation is – follow the A.I. trend analysis and practice good money management on all trades.
We will re-evaluate based upon:
- New Wall Street Analysts’ Estimates
- New 52-week high and low boundaries
- Vantagepoint A.I. Forecast (Predictive Blue Line)
- Neural Network Forecast
- Daily Range Forecast
Let’s Be Careful Out There!
Remember, It’s Not Magic.
It’s Machine Learning.

IMPORTANT NOTICE!
THERE IS SUBSTANTIAL RISK OF LOSS ASSOCIATED WITH TRADING. ONLY RISK CAPITAL SHOULD BE USED TO TRADE. TRADING STOCKS, FUTURES, OPTIONS, FOREX, AND ETFs IS NOT SUITABLE FOR EVERYONE.
DISCLAIMER: STOCKS, FUTURES, OPTIONS, ETFs AND CURRENCY TRADING ALL HAVE LARGE POTENTIAL REWARDS, BUT THEY ALSO HAVE LARGE POTENTIAL RISK. YOU MUST BE AWARE OF THE RISKS AND BE WILLING TO ACCEPT THEM IN ORDER TO INVEST IN THESE MARKETS. DON’T TRADE WITH MONEY YOU CAN’T AFFORD TO LOSE. THIS ARTICLE AND WEBSITE IS NEITHER A SOLICITATION NOR AN OFFER TO BUY/SELL FUTURES, OPTIONS, STOCKS, OR CURRENCIES. NO REPRESENTATION IS BEING MADE THAT ANY ACCOUNT WILL OR IS LIKELY TO ACHIEVE PROFITS OR LOSSES SIMILAR TO THOSE DISCUSSED ON THIS ARTICLE OR WEBSITE. THE PAST PERFORMANCE OF ANY TRADING SYSTEM OR METHODOLOGY IS NOT NECESSARILY INDICATIVE OF FUTURE RESULTS. CFTC RULE 4.41 – HYPOTHETICAL OR SIMULATED PERFORMANCE RESULTS HAVE CERTAIN LIMITATIONS. UNLIKE AN ACTUAL PERFORMANCE RECORD, SIMULATED RESULTS DO NOT REPRESENT ACTUAL TRADING. ALSO, SINCE THE TRADES HAVE NOT BEEN EXECUTED, THE RESULTS MAY HAVE UNDER-OR-OVER COMPENSATED FOR THE IMPACT, IF ANY, OF CERTAIN MARKET FACTORS, SUCH AS LACK OF LIQUIDITY. SIMULATED TRADING PROGRAMS IN GENERAL ARE ALSO SUBJECT TO THE FACT THAT THEY ARE DESIGNED WITH THE BENEFIT OF HINDSIGHT. NO REPRESENTATION IS BEING MADE THAT ANY ACCOUNT WILL OR IS LIKELY TO ACHIEVE PROFIT OR LOSSES SIMILAR TO THOSE SHOWN.

