

Prologis ($PLD) is a Real Estate Invest Trust (REIT) that builds and owns warehouses placed strategically at important transportation locations throughout the world so that logistics can be expedited for their customers.
Prologis owns and controls over 4,715 buildings and almost 1 billion square feet in space.

Travel along any major interstate highway and you have seen their facilities which consist of huge buildings with hundreds of truck bays. They serve the biggest companies in the world like Amazon and Home Depot.
Prologis is involved with the distribution, storage, packaging, assembly, and light manufacturing of consumer products. Over the past year with COVID-19 and the lockdown as a catalyst, $PLD benefited greatly from increased online shopping volume which increased the demand for storage at their facilities., online fulfillment, and business-to-business transactions.
Concisely stated, Prologis strength is that it owns and controls prime real estate outside of major urban areas, and this by itself presents huge barriers to entry for competitors. There is massive demand for more space, but the land isn’t available, so PLD has a huge competitive advantage as the leader in this space.
Over the last two years, major shortages in just about every commodity, along with deficits of finished goods. This threat has been the tailwind driving $PLD prices higher. Most analysts believe that these supply bottlenecks will take years to normalize. This narrative is one of the primary reasons why $PLD has performed so well in 2021.
The company operates in 19 different countries across four different continents.
Prologis has built a unique portfolio of inventory storage, assembly, and logistics close to the largest metropolitan areas in the world. Even after the COVID-19 pandemic has been brought under control, this will not change. With more and more e-commerce and online shopping occurring, Wall Street analysts are looking very favorably about the longer-term prospects for $PLD.
The company is in a unique position to raise rents and revenue with increased inflationary pressures knowing that its blue-chip customers will pay the price so that deliveries can occur in a timely manner.
The company also pays a $0.58 per share quarterly dividend which makes the stock very attractive to longer term investors, for a yield of 2.4%. PLD has a market cap of $118.96 billion and trades average volume of 2.3 million shares per day.
In this weekly stock study, we will look at and analyze the following indicators and metrics which are our guidelines which dictate our behavior in deciding whether to buy, sell, or stand aside on a particular stock.
- Wall Street Analysts’ Estimates
- 52-week high and low boundaries
- Vantagepoint A.I. Forecast (Predictive Blue Line)
- The Best Case – Worst Case Scenarios
- Neural Network Forecast
- Daily Range Forecast
- Intermarket Analysis
- Our trading suggestion
We don’t base our trading decisions on things like earnings or fundamental cash flow valuations. However, we do look at them to better understand the financial landscape that a company is operating under.
Wall Street Analysts’ Estimates
Based on 9 Best Performing Wall Street analysts offering 12-month price targets for Prologis in the last 3 months. The average price target is $159.22 with a high forecast of $180.00 and a low forecast of $139.00. The average price target represents a 0.31% change from the last price of $158.73.
52-Week High and Low Boundaries
Looking at the Long-Term chart of PLD provides us with the 52-week high and low boundaries.
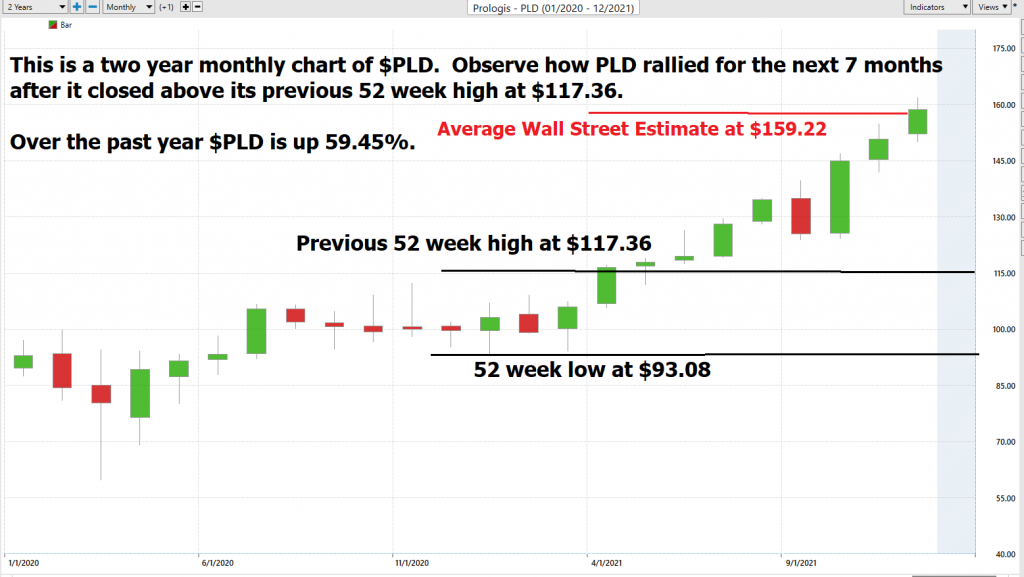
Over the past year we have seen PLD trade as low as $93.08 and as high as $161.80. This tells us that the average weekly trading range for PLD is $1.32.
We also like to divide the current price by the annual trading range to get a broad-based estimate of trading volatility. When we divide 68.8 the annual range by the current price of $161, we come up with 42.7%.
All that this value tells us is that, if nothing changes, it would be perfectly normal for PLD to be trading 42.7% higher or lower next year at this same time.
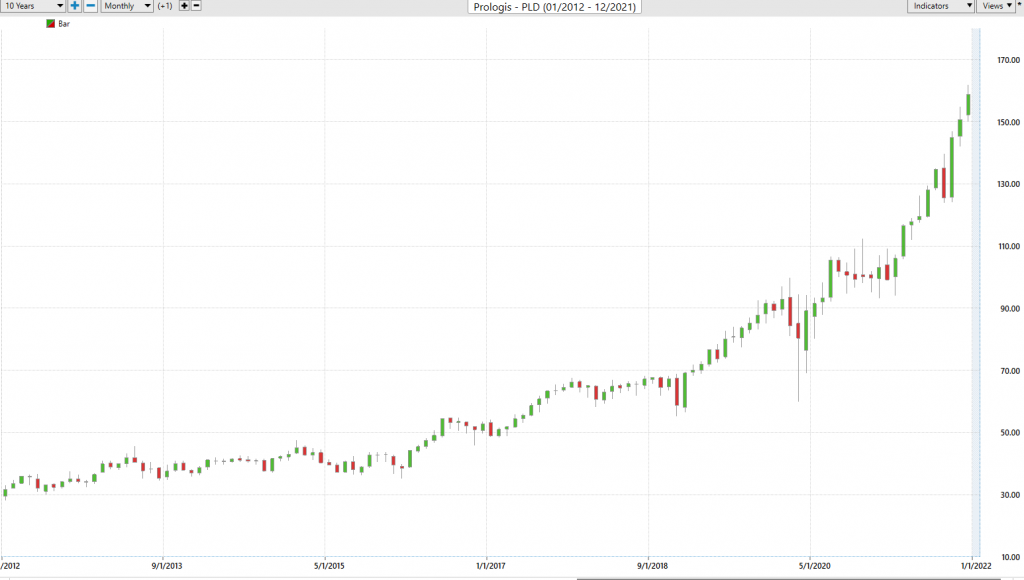
Here is a ten year monthly chart of $PLD so that you can see the powerful price journey it has taken over the longer-term time frames.
We then like to get more granular to analyze and look at how the stock has performed around the major analysts forecasts as well as the 52-week high and low boundaries.
This is a two-year monthly chart of PLD that illustrates exactly why it is important to pay attention to the 52-week high and low boundaries. When PLD took out the 52-week high at $117.36 in May 2021 it never looked back and staged a massive 37% rally.
We like to study the 52-week chart before doing anything else just so that we can get a feel for how the company has performed over the past year and compare that to other opportunities and the broader market indexes.
Best Case – Worst Case Scenario $PLD
Whenever we look at a trade or long-term investment opportunity to really understand what we are dealing with we need to compare the performance of the asset we are considering with the returns of the major market indexes.
Prologis is up 5% year over year.
The S&P 500 Index is up 25.02%
The Dow Jones Industrials are UP 17.34%
The NASDAQ is UP 57.92%
The Russell 1000 Small Cap Index is UP 22.91%
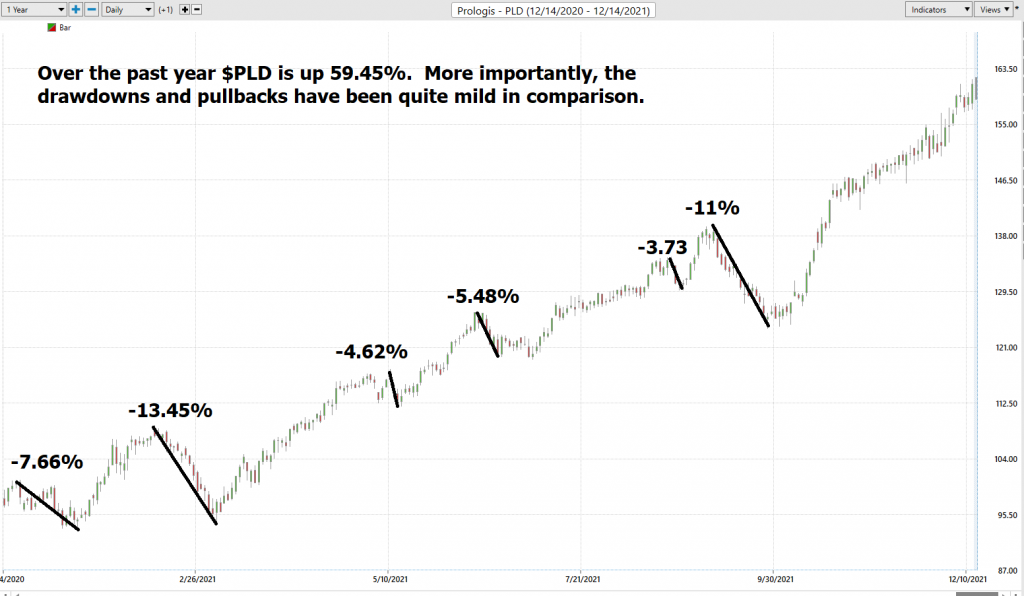
So, we can see that in Prologis ($PLD) we have an asset that has outperformed all the broader stock market indexes handily. More importantly the drawdowns have been quite mild as well. The largest drawdowns were 13.4% peak to trough.
Vantagepoint A.I. Forecast (Predictive Blue Line)
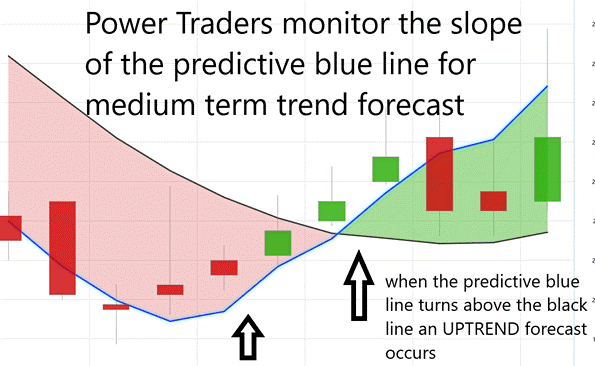
Let’s do some basic trend forecasting analysis based upon looking at the VantagePoint predictive blue line over the last year. On the following chart you will see the power of the VantagePoint Predictive blue line which determines the medium term trend price forecast.
The guidelines we abide by are as follows:
- The slope of the predictive blue line determines the trend and general direction of PLD
- When the blue line turns above the black line an UP opportunity occurs
- When the blue line turns below the black line a DOWN opportunity occurs
- Ideally, the VALUE ZONE is determined to try and buy the asset at or below the predictive blue line
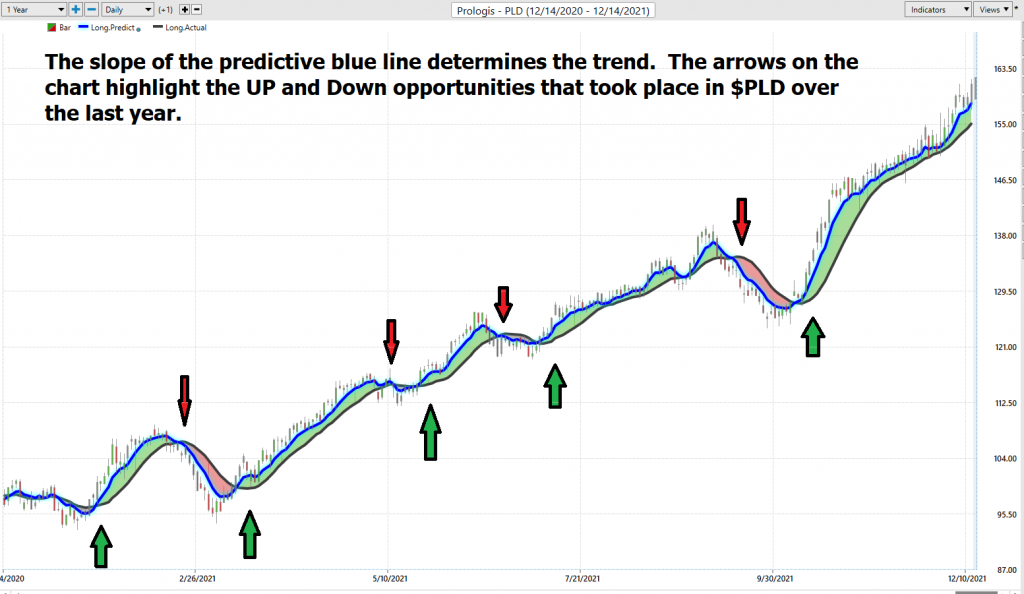
This is the power and effectiveness of the Vantagepoint A.I. forecast in assisting traders to stay on the right side of the trend at the right time.
Neural Network Indicator (Machine Learning)
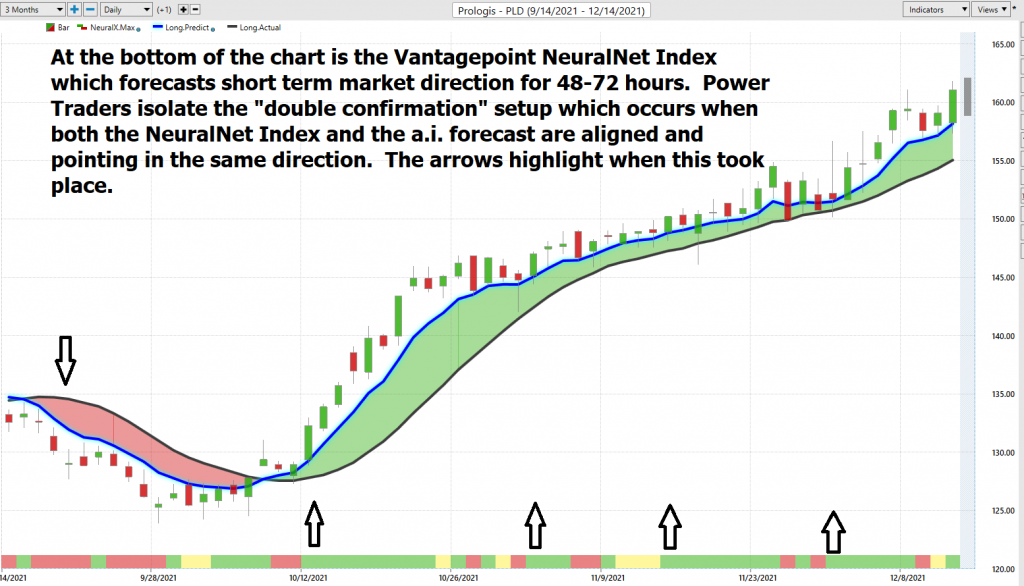
At the bottom of the chart is the Neural Network Indicator which predicts future short-term strength and/or weakness in the market. When the Neural Net Indicator is green it communicates strength. When the Neural Net is red it is forecasting short term weakness in the market.
A Neural Net is a computational learning system that uses a network of functions to understand and translate massive amounts of data into a desired output, consistently monitoring itself and improving its performance.
Whenever Power Traders are looking for statistically valid trading setups, they look for a DOUBLE confirmation signal. This signal occurs whenever the blue predictive line and the Neural Net at the bottom of the chart suggest the same future expected outcome.
We advocate that Power Traders cross reference the chart with the predictive blue line and neural network indicator to create optimal entry and exit points.
Traders look for confirmation on the Neural Net to position themselves for LONG or SHORT opportunities in the market. In other words, when the A.I. forecast is green, and The Neural Net is green, that presents a buying opportunity.
The inverse is also true, when the A.I. forecast is red and the Neural Net is red, that is a selling opportunity. The arrows on the chart below highlight the trading zones where Power Traders would’ve been using double confirmation to find a buying opportunity in cross referencing the A.I. forecast with the Neural Net.
Power Traders are always looking to apply both the Neural Network and A.I. to the markets to find statistically sound trading opportunities.
VantagePoint Software Daily Price Range Prediction
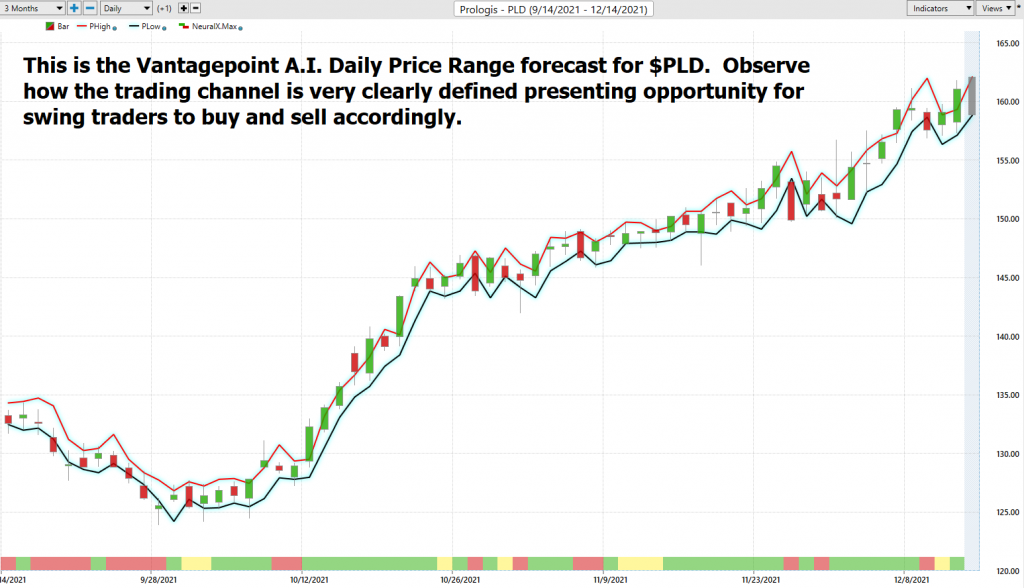
One of the powerful features in the VantagePoint Software which Power Traders use daily is the Price Range prediction forecast.
This forecast is what permits Power Traders to truly fine tune their entries and exits into the market.
Every day traders are faced with the anxiety and frustration of wondering where they should be looking for opportunities to buy and sell the market. VantagePoint’s A.I. makes this decision super easy with the Daily Price Range Forecast.
Here is the price chart of PLD during the most recent 4 month run up featuring the Daily Price Range forecast with the Neural Net Indicator.
Intermarket Analysis
Power lies in the way we respond to the truth we understand.
PLD has a great narrative. It has solid earnings, great positioning around its leadership in the REIT logistics space.
One of the supremely important questions in trading is what is driving the price? Headlines often create interesting narratives. But these “stories” only capture the imagination. Traders want and need to understand the cause and effect of price movement.
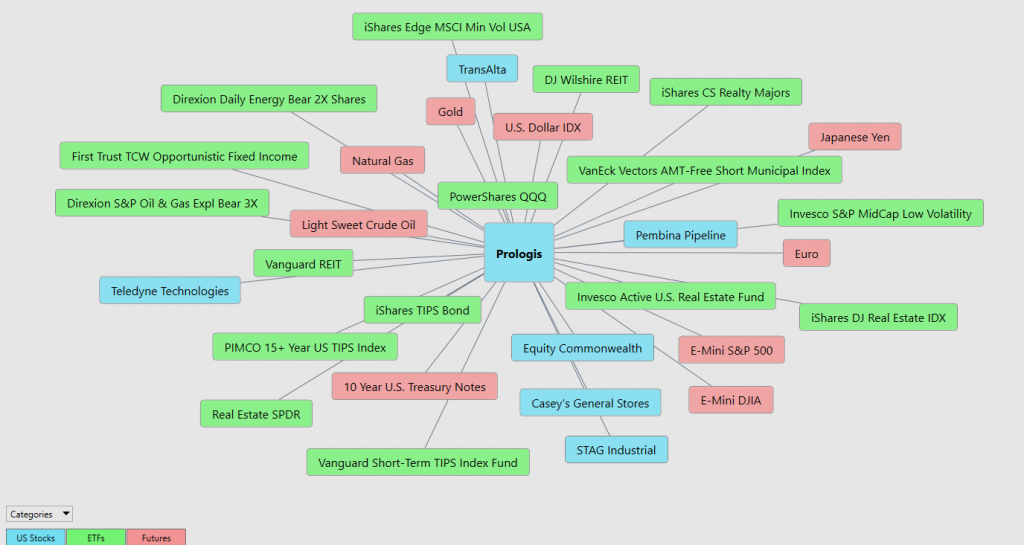
The only way to get an answer to this important question is through intermarket analysis which looks at statistical price correlations of assets.
We live in a global marketplace.
Everything is interconnected.
Interest rates, Crude Oil Prices, and the volatility of the Dollar amongst thousands of other variables affect the decisions companies must make to flourish and prosper in these very challenging times. Trying to determine what these factors are is one of the huge problems facing investors and traders.
You always have a choice. You can tune in to the talking heads in the media who spin talking points which promote fear. Or you can rely on facts to base your decision making on.
Within this Intermarket Analysis graphic, you will see the 31 markets that are the key drivers to PLD’s price.
Our Suggestion
As I mentioned at the beginning of this Stock Study, Wall Street Analysts has an average price target of $159.22 with the stock trading at $161. The highest Analyst forecast is $180 which may be reachable before the next earnings call.
At present, the stock is fairly valued, but as I have elaborated in this stock study, we think the narrative and positioning of PLD is worthy of your consideration. The company has a blue-chip clientele who are all very concerned with supply chain breakdowns and bottlenecks. These two factors we think bode very well for PLD moving forward.
Earnings for Prologis are expected to grow by 11.65% in the coming year, from $4.12 to $4.60 per share. Prologis has not formally confirmed its next earnings publication date, but the company’s estimated earnings date is Tuesday, January 25th, 2022, based off prior year’s report dates.
Since PLD continues to make new 52-week highs we think we will see greater than normal volatility here as it continues its trajectory higher.
Our recommendation is to follow the A.I. trend analysis as outlined in this stock study and practice good money management on all trades.
We will re-evaluate based upon:
- New Wall Street Analysts’ Estimates
- New 52-week high and low boundaries
- Vantagepoint A.I. Forecast (Predictive Blue Line)
- Neural Network Forecast
- Daily Range Forecast
Let’s Be Careful Out There!
Remember, It’s Not Magic.
It’s Machine Learning.

IMPORTANT NOTICE!
THERE IS SUBSTANTIAL RISK OF LOSS ASSOCIATED WITH TRADING. ONLY RISK CAPITAL SHOULD BE USED TO TRADE. TRADING STOCKS, FUTURES, OPTIONS, FOREX, AND ETFs IS NOT SUITABLE FOR EVERYONE.
DISCLAIMER: STOCKS, FUTURES, OPTIONS, ETFs AND CURRENCY TRADING ALL HAVE LARGE POTENTIAL REWARDS, BUT THEY ALSO HAVE LARGE POTENTIAL RISK. YOU MUST BE AWARE OF THE RISKS AND BE WILLING TO ACCEPT THEM IN ORDER TO INVEST IN THESE MARKETS. DON’T TRADE WITH MONEY YOU CAN’T AFFORD TO LOSE. THIS ARTICLE AND WEBSITE IS NEITHER A SOLICITATION NOR AN OFFER TO BUY/SELL FUTURES, OPTIONS, STOCKS, OR CURRENCIES. NO REPRESENTATION IS BEING MADE THAT ANY ACCOUNT WILL OR IS LIKELY TO ACHIEVE PROFITS OR LOSSES SIMILAR TO THOSE DISCUSSED ON THIS ARTICLE OR WEBSITE. THE PAST PERFORMANCE OF ANY TRADING SYSTEM OR METHODOLOGY IS NOT NECESSARILY INDICATIVE OF FUTURE RESULTS. CFTC RULE 4.41 – HYPOTHETICAL OR SIMULATED PERFORMANCE RESULTS HAVE CERTAIN LIMITATIONS. UNLIKE AN ACTUAL PERFORMANCE RECORD, SIMULATED RESULTS DO NOT REPRESENT ACTUAL TRADING. ALSO, SINCE THE TRADES HAVE NOT BEEN EXECUTED, THE RESULTS MAY HAVE UNDER-OR-OVER COMPENSATED FOR THE IMPACT, IF ANY, OF CERTAIN MARKET FACTORS, SUCH AS LACK OF LIQUIDITY. SIMULATED TRADING PROGRAMS IN GENERAL ARE ALSO SUBJECT TO THE FACT THAT THEY ARE DESIGNED WITH THE BENEFIT OF HINDSIGHT. NO REPRESENTATION IS BEING MADE THAT ANY ACCOUNT WILL OR IS LIKELY TO ACHIEVE PROFIT OR LOSSES SIMILAR TO THOSE SHOWN.

