

Twitter has been a leader in the social media space for more than a decade. However, over the last several years, Twitter has been justly criticized as being against free speech and has taken a heavy hand in censoring opponents of mainstream narratives.
On Monday morning of this week, a Securities Exchange Commission filing uncovered that Elon Musk had acquired more than seventy-three million shares of $TWTR. Which amounts to a 9.2% stake in the company. This makes Mr. Musk the largest shareholder in the company. A s a point of reference, former CEO Jack Dorsey owns 2.25% of the company.
During March, Musk signaled to his 80.2 million followers on Twitter his interest in Twitter in a tweet where he polled his audience:
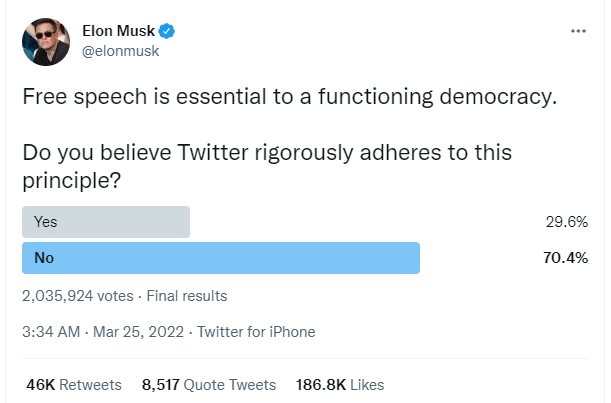
Of the 2 million followers who responded, 70.4% voted “No.”
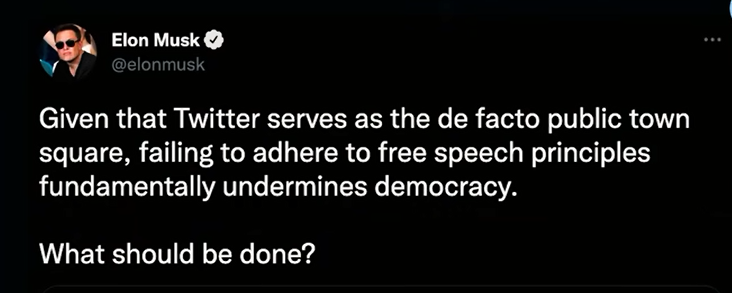
Musk later asked if a new social media platform was needed.
After results from that poll were tabulated, Musk tweeted the following:
Musk has undoubtedly noticed that all too often the TWITTER crowd is not on the same side as he is. What awaits to be seen is how much control he will be able to exert over the company and whether a takeover battle will ensue over future policies and protocols. Unfortunately, censorship has become normalized in the past several years and Twitter has been one of the big tech companies making that possible.
The SEC filing shows that Musk began acquiring Twitter shares on March 14, 2022, ten days before he issued his survey to his followers. This could trigger some issues with the Securities Exchange Commission which requires that anyone with a 5% stake in a company disclose their purchase within 10 days. Musk will receive a fine of $100,000.
Twitter as a company has struggled with monetizing its traffic since its inception. While the company is making some progress, longer term the company has not performed like its other social media competitors.
To give you an idea of $TWTR’s longer term performance here is the chart from the time it went public on November 7, 2013. If you had bought and held the IPO and held for the past 8 ½ years, the total return would have been 18.79% total. Compare this to a social media ETF like $SOCL which has posted a return of over 120% over the same period.
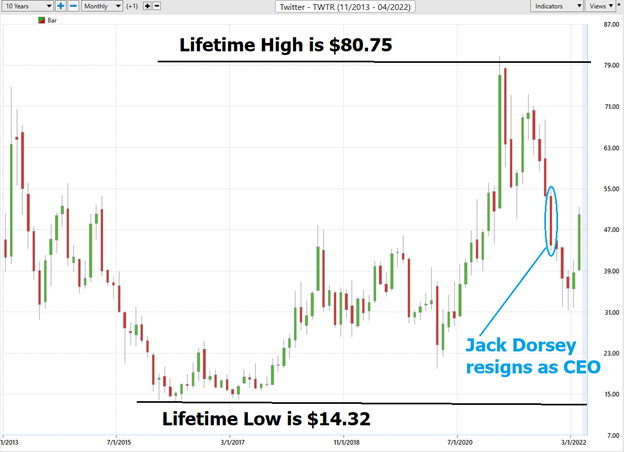
Over the last 8 ½ years $TWTR has traded as high as $80.75, and as low as $14.72. At present time it is trading at the 50th percentile of its price lifespan. Former CEO and founder, Jack Dorsey announced his retirement from Twitter on November 29, 2021. At the time Twitter was trading at $43.94.
In a nutshell, TWTR has been unprofitable since its IPO. It has struggled to add new Monthly Active Users and to be profitable. While Twitter does generate revenue from advertising, most brands find greater success on other social media platforms.
Twitter’s identity has always been instant conversations with people who share interests similar to yours. Some people refer to Twitter as a public town square or the digital water cooler where people can freely discuss what is “happening.” The issue in trying to analyze twitter is that it is not Facebook. It is LIVE. It is global. It is instant. But regardless of its unique and distinctive attributes, over the longer term it has been unprofitable as a company.
TWTR has rallied sharply over the past several days, on the announcement that Elon Musk was a majority owner. The short-term outcome is that Twitter has appointed Musk to its board of directors.
In this TWTR stock study, we will look at and analyze the following indicators and metrics as are our guidelines which dictate our behavior in deciding whether to buy, sell, or stand aside on a particular stock.
- 52-week high and low boundaries
- Wall Street Analysts Targets
- Best Case-Worst Case Analysis
- Vantagepoint A.I. Forecast (Predictive Blue Line)
- Neural Network Forecast
- Daily Range Forecast
- Intermarket Analysis
- Our trading suggestion
We don’t base our trading decisions on things like earnings or fundamental cash flow valuations. However, we do look at them to better understand the financial landscape that a company is operating under.
52-week High-Low Chart
Readers of this blog will attest to the fact that we are huge believers in monitoring where a stock is trading in relation to its 52-week range. Our perspective is that winners continuously make new 52-week highs, and we want to be on board for those types of moves. We pay a great deal of attention to how a stock reacts and performs in relation to its 52-week high and low boundaries.
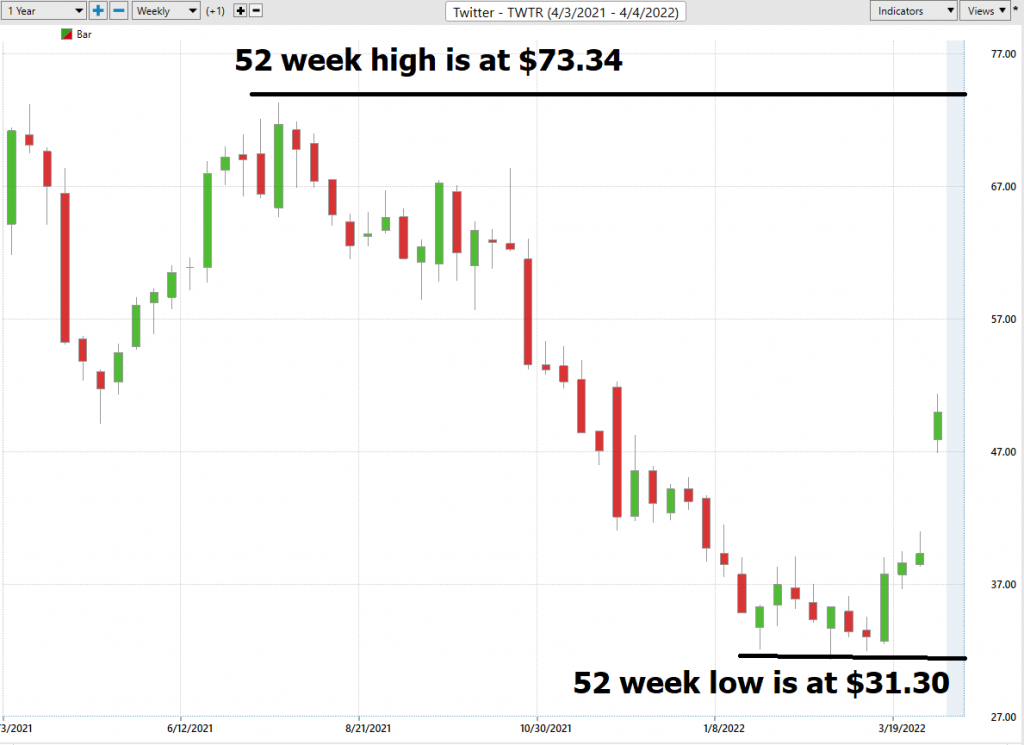
Over the last 52 weeks $TWTR has traded as high as 73.34 and as low as 31.30.
Based upon the high and low prices we can quickly see that the annual trading range of $TWTR has been $42.04. This tells us that the average weekly trading range is $.80.
What we also like to do as well is to divide the annual trading range ($42.04) by the current price ($51.) this gives us a very basic estimate of annualized volatility. Current annualized volatility is 84%. This level of volatility is considered to be very high. This metric tells us that in one year, we can expect $TWTR to be trading in a range 84% higher or lower from current levels based upon this level of volatility.
This provides us with a very broad-based annualized volatility forecast where we can initially estimate the high end of the following year would be $93.04 and the low end of the range would be $8.96.
We refer to these as the commonsense metrics which we use as baseline measurements of understanding normal value. When using artificial intelligence, we look to amplify our returns based upon these baseline measurements.
Wall Street Analyst Ratings
Based on 28 Wall Street analysts offering 12-month price targets for Twitter in the last 3 months. The average price target is $45.58 with a high forecast of $60.00 and a low forecast of $30.00. The average price target represents a -10.59% change from the last price of $50.98.
This metric tells us that Wall Streets’ top analysts think that Twitter is overvalued by 10.59%.
Best Case – Worst Case Scenarios
Next, we want to look at the trend over the past year and evaluate the strength of the rallies in relation to the declines.
Over the past year:
$TWTR over the last 52 weeks is DOWN -30%
The DOW Jones is Up 2.77%.
S&P 500 Index +9.7%
NASDAQ +19%
Russell 1000 Stock Index is up + 1.2%
What can we learn from these metrics?
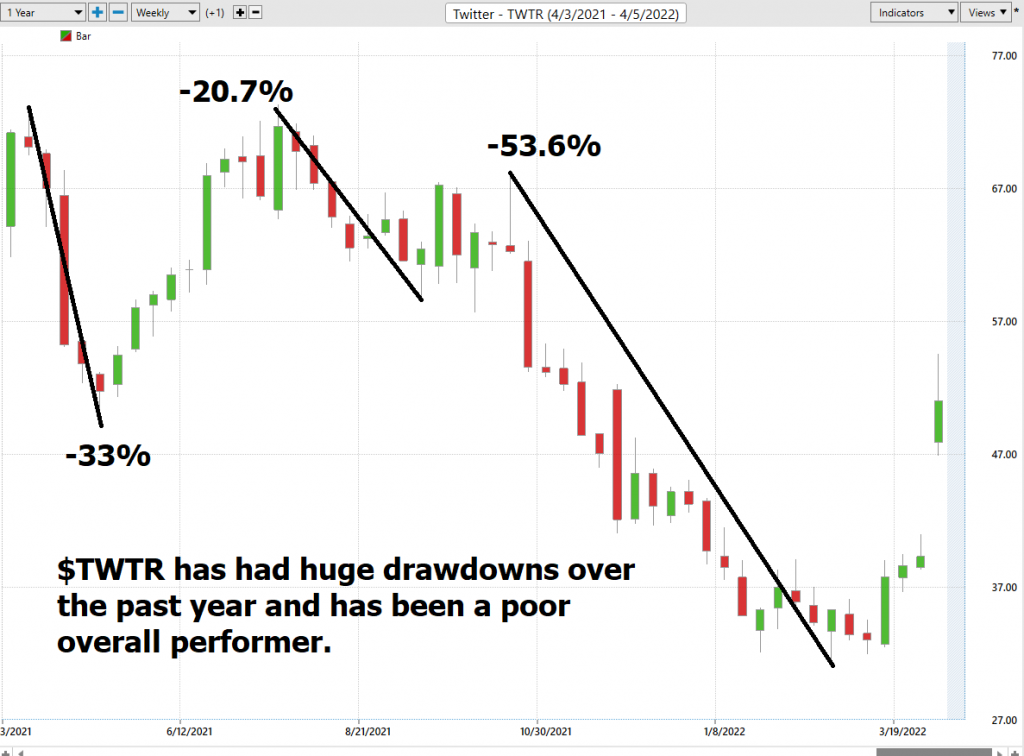
$TWTR has massively underperformed the broader stock market indexes. Regardless how you compare TWTR to the broader market over the past year it has not been a worthwhile investment.
The Vantagepoint A.I. Analysis
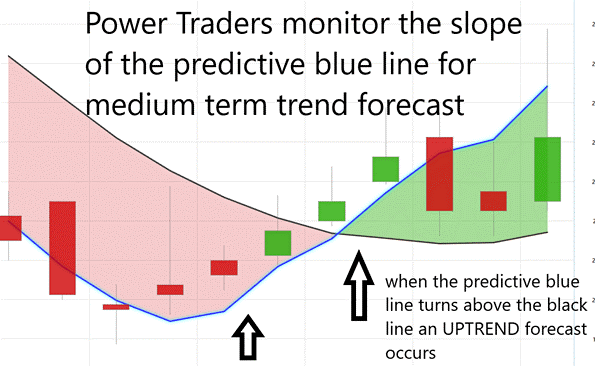
Using VantagePoint Software and the artificial intelligence, traders are alerted to trend forecasts by monitoring the slope of the predictive blue line. The black line is a simple 10 day moving average of price which simply tells you what has occurred in the market. The predictive blue line also acts as value zone where in uptrends traders try to purchase the asset at or below the blue line.
In studying the chart below pay close attention to the slope of the blue line. Anytime the blue line crosses the zero intercept is a trend signal. If the line crosses from down to up, an UP-trading opportunity exists. If the line crosses from Up to down the down trading opportunity exists.
Power traders use the predictive blue line in helping to determine both the value zone as well as the trend direction.
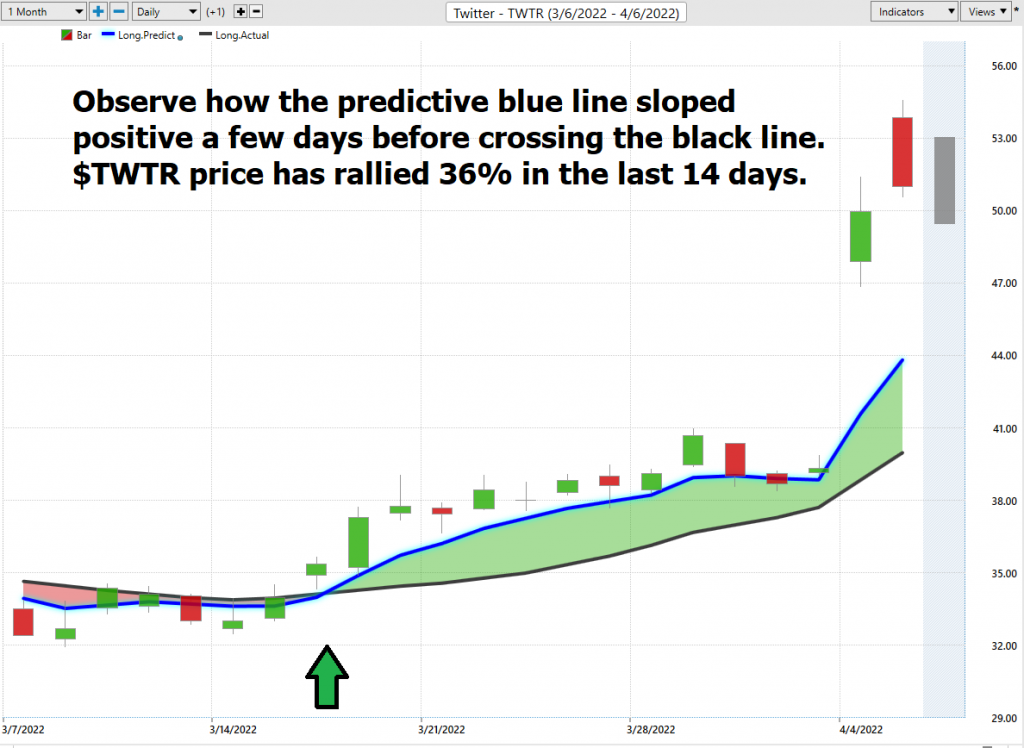
Observe how the SLOPE of the predictive blue line started moving higher a few days before its moving above the black line. An extraordinarily strong trend was evidenced by seeing that price was consistently closing above the predictive blue line. Price has rallied 36% in the last 14 days since the UP forecast occurred.
Fine Tuning Entries with The Neural Net Indicator
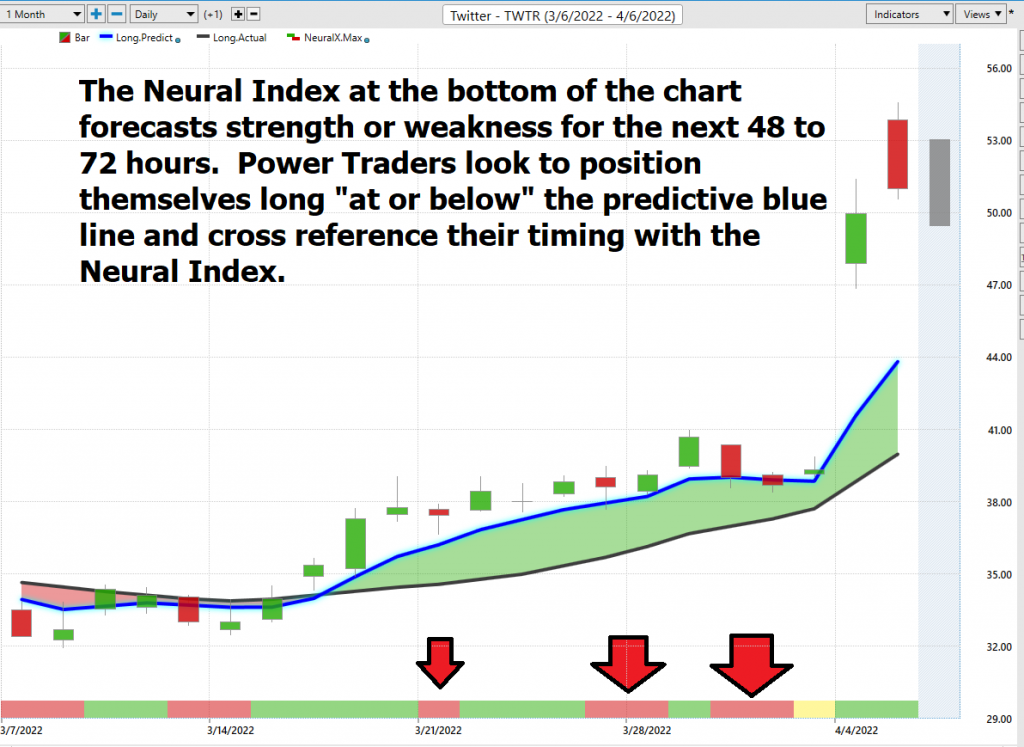
At the bottom of the chart is the Neural Network Indicator which predicts future strength and/or weakness in the market with a 48-to-72-hour time horizon.
A Neural Net is a computational learning system that uses a network of functions to understand and translate massive amounts of data into a desired output, consistently monitoring itself and improving its performance.
When the Neural Net Indicator is green it communicates strength. When the Neural Net is Red it is forecasting short term weakness in the market.
We advocate that Power Traders cross reference the chart with the predictive blue line and neural network indicator to create optimal entry and exit points. This provides what we refer to as the DOUBLE CONFIRMATION setup.
Power Traders are always looking to apply both the neural network and a.i. to the markets to find statistically sound trading opportunities.
We advise Power Traders to cross reference the predictive blue line with the Neural Net for the best entry opportunities. Observe how by simply waiting for the green Neural Net to align with the predictive blue line the trading opportunity unfolded beautifully.
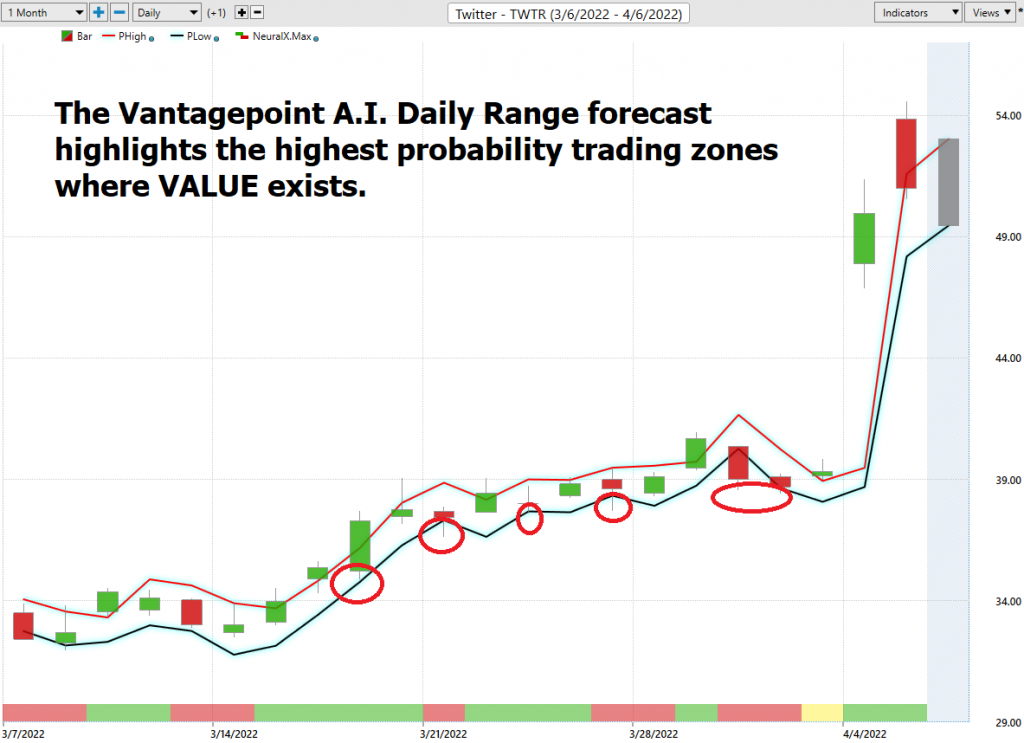
VantagePoint Software Daily Price Range Prediction
The purpose of all these indicators so far is to help traders stay on the right side of the right trend at the right time.
One of the powerful features in the Vantagepoint A.I. Software which Power Traders use daily is the Daily Price Range prediction forecast.
This forecast is what permits Power Traders to truly fine tune their entries and exits into the market often looking for smaller time frames and more granular trading opportunities.
Here is the price chart of $TWTR during the most recent runup featuring the Daily Price Range forecast and the Neural Net Indicator.
All of the tools so far in this analysis attempt to define value and to clearly identify the trend and points within the trend where traders should look to capitalize on.
The expectations for each trading day are clearly defined. The red circles on the chart are places where I have highlighted the zones where Power Traders would have been buying the forecasted low zone of the daily trading channel.
Intermarket Analysis
What makes the Vantagepoint Software totally unique is its ability to perform Intermarket analysis and to locate those assets which are most interconnected that are responsible for driving the price of $TWTR higher or lower.
Studying the charts can always provide objective realities in terms of locating support and resistance levels which become noticeably clear on a chart. But we live in a global marketplace. Everything is interconnected. The billion-dollar question for traders is always what are the key drivers of price for the underlying asset that I am trading?
These intangibles are invisible to the naked eye yet show extremely high statistical correlations.
Slight changes in Interest rates, Crude Oil Prices, and the Volatility of the dollar amongst thousands of other variables affect the decisions companies must make to survive in these particularly challenging times. Trying to determine what these factors are is one of the huge problems facing investors and traders.
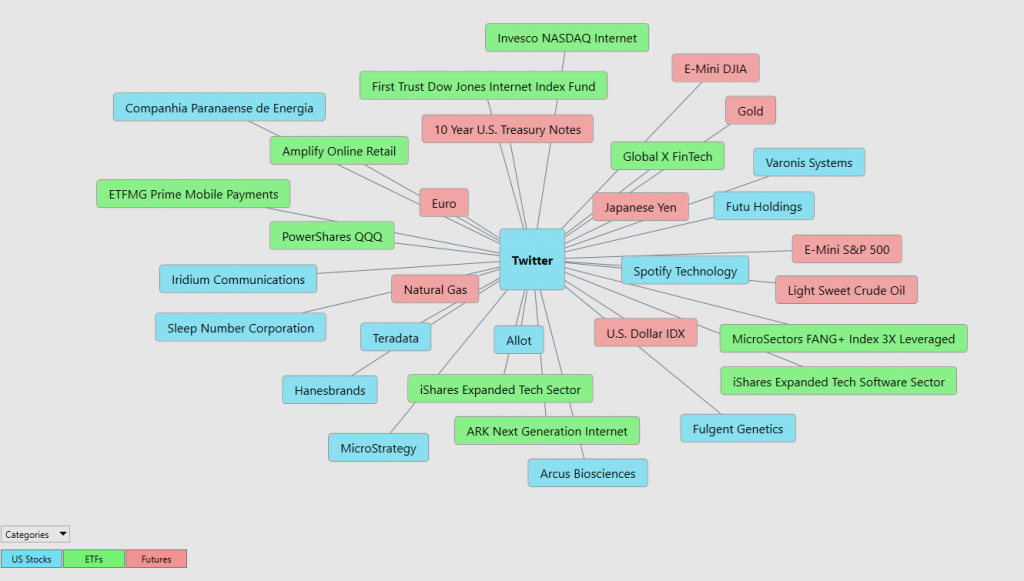
There is excellent value to be had in studying and understanding the key drivers of $TWTR price action. This graphic presents a plethora of opportunities that can quickly be explored within the software.
This is an amazing research tool that consistently uncovers future gems.
Our Suggestion
While it is absolutely true that Elon Musk can move markets with his tweets and public announcements, we continue to place our faith in the artificial intelligence to guide our trading decisions.
The Trend is Up on TWTR.
The market is overvalued.
Momentum is also Up.
The Huge gap on the chart on Monday’s price action will eventually be filled.
This is not a time to chase a stock that is in the headlines.
The current economic environment is stagflationary and in that climate we think $TWTR will have huge headwinds to confront.
We will continue to monitor the Daily Range forecast and cross-reference it with the other indicators in this report to find a high probability trading opportunities.
Twitter is a powerful social media site. However, it is not consistently profitable.
As a trader, we will opt to look for short-term swing trading opportunities.
We think long-term investors can do better looking elsewhere.
Let’s Be Careful Out There!
Remember, It’s Not Magic.
It’s Machine Learning.

IMPORTANT NOTICE!
THERE IS SUBSTANTIAL RISK OF LOSS ASSOCIATED WITH TRADING. ONLY RISK CAPITAL SHOULD BE USED TO TRADE. TRADING STOCKS, FUTURES, OPTIONS, FOREX, AND ETFs IS NOT SUITABLE FOR EVERYONE.
DISCLAIMER: STOCKS, FUTURES, OPTIONS, ETFs AND CURRENCY TRADING ALL HAVE LARGE POTENTIAL REWARDS, BUT THEY ALSO HAVE LARGE POTENTIAL RISK. YOU MUST BE AWARE OF THE RISKS AND BE WILLING TO ACCEPT THEM IN ORDER TO INVEST IN THESE MARKETS. DON’T TRADE WITH MONEY YOU CAN’T AFFORD TO LOSE. THIS ARTICLE AND WEBSITE IS NEITHER A SOLICITATION NOR AN OFFER TO BUY/SELL FUTURES, OPTIONS, STOCKS, OR CURRENCIES. NO REPRESENTATION IS BEING MADE THAT ANY ACCOUNT WILL OR IS LIKELY TO ACHIEVE PROFITS OR LOSSES SIMILAR TO THOSE DISCUSSED ON THIS ARTICLE OR WEBSITE. THE PAST PERFORMANCE OF ANY TRADING SYSTEM OR METHODOLOGY IS NOT NECESSARILY INDICATIVE OF FUTURE RESULTS. CFTC RULE 4.41 – HYPOTHETICAL OR SIMULATED PERFORMANCE RESULTS HAVE CERTAIN LIMITATIONS. UNLIKE AN ACTUAL PERFORMANCE RECORD, SIMULATED RESULTS DO NOT REPRESENT ACTUAL TRADING. ALSO, SINCE THE TRADES HAVE NOT BEEN EXECUTED, THE RESULTS MAY HAVE UNDER-OR-OVER COMPENSATED FOR THE IMPACT, IF ANY, OF CERTAIN MARKET FACTORS, SUCH AS LACK OF LIQUIDITY. SIMULATED TRADING PROGRAMS IN GENERAL ARE ALSO SUBJECT TO THE FACT THAT THEY ARE DESIGNED WITH THE BENEFIT OF HINDSIGHT. NO REPRESENTATION IS BEING MADE THAT ANY ACCOUNT WILL OR IS LIKELY TO ACHIEVE PROFIT OR LOSSES SIMILAR TO THOSE SHOWN.

