
My friends often refer to me as a Chartaholic. I’m addicted to charts. I’m always looking at charts. I browse them in my leisure time and study them closely during working hours. I’m absolutely fascinated by the stories that a simple chart tells and love looking at charts of all sectors of the financial markets. Stocks, Bonds, Crypto, Supply Chains, etc. When you enjoy the study of charts you begin to recognize how easy it is to hide details depending upon how a chart is presented.
Years ago, I accompanied a good friend to the Emergency Room. We spent over eight hours waiting for the doctors to be examined. The experience had a profound impact upon me. As we were waiting, I noticed that we were not a priority based upon the vital signs my friend was exhibiting when we checked in. In other words, there were other people in the ER who were in much worse shape. Naturally they had priority, as their condition was considered to be more life-threatening.
Are you familiar with the basic vital signs of health?
They are:
- Body Temperature
- Pulse Rate
- Respiration Rate
- Blood Pressure
Long story made short, after the experience I began pondering what were the vital signs of economic health. I still think about this today as intellectuals and scholars argue for things, actions and behaviors which seem to be completely counterproductive. I’m convinced of at least two factors that are responsible for something we would reference as being “healthy” economically. They are the savings rate as well as the cost of food.
It matters not whether you are examining the life of an individual or that of a macro economic society, these two factors paint a story worthy of every citizens attention.
Why?
If an entity is incapable of saving it will not survive.
When the cost of what it needs to survive becomes prohibitively expensive, its survival will be severely threatened.
Recently I stumbled across a chart, created by the United Nations that has led me down numerous rabbit holes trying to make sense of what I was looking at.
The United Nations has a subdivision called the Food and Agriculture Organization. They maintain the FAO Food Price Index (FFPI).
The FAO Food Price Index (FFPI) is a measure of the monthly change in international prices of a basket of food commodities. It consists of the average of five commodity group price indices weighted by the average export shares of each of the groups over 2014-2016.
The way the chart is maintained is quite unusual as they simply overlay one year’s price over a previous set of years.
Here is what the most recent chart looks like. Before I share with you my concerns, tell me what you see in the chart at first glance.
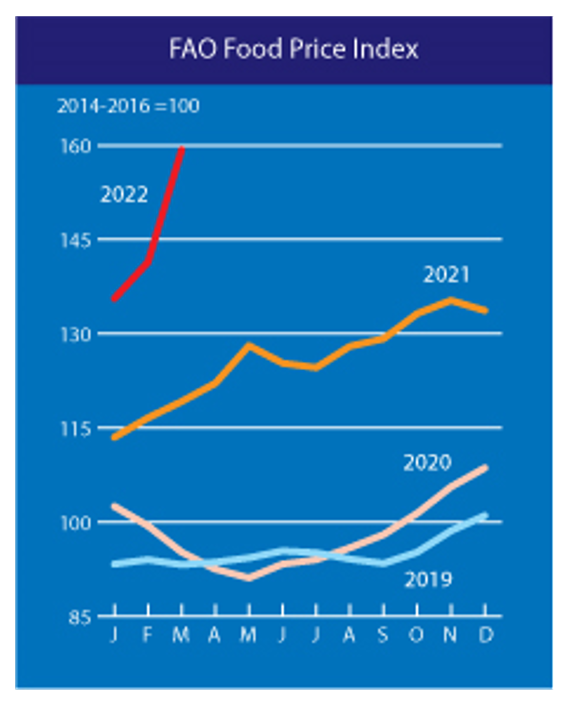
At first glance you can quickly see that prices today are 60% higher than they were at the end of 2019. Since this is a chart representing what the cost of food is for lesser developed countries that should be very concerning. We have had 28 months since the end of 2019 and in that time frame we have seen food prices on the FAO Index increase by 60%. That works out to roughly a 1.7% increase in the cost of food every month for the last 28 months.
That should concern everyone! Why?
How many investments do you know of that kept up with that type of inflationary growth? Has your income or salary grown by 1.7% every month over the past two years?
However, the reason this chart is the scariest chart I have ever seen is because in the last month, since the war in Ukraine broke out, the FAO Food Price Index* (FFPI) averaged 159.3 points in March 2022, up (12.6 percent) from February, making a giant leap to a new highest level since its inception in 1990.
You might need to read that last sentence a few times for its severity to set in.
The COST of FOOD last month for lesser developed Nations rose by 12.6%! When you compound 12.6% monthly, the cost of food doubles in less than 6 months and more than triples in a years’ time frame.
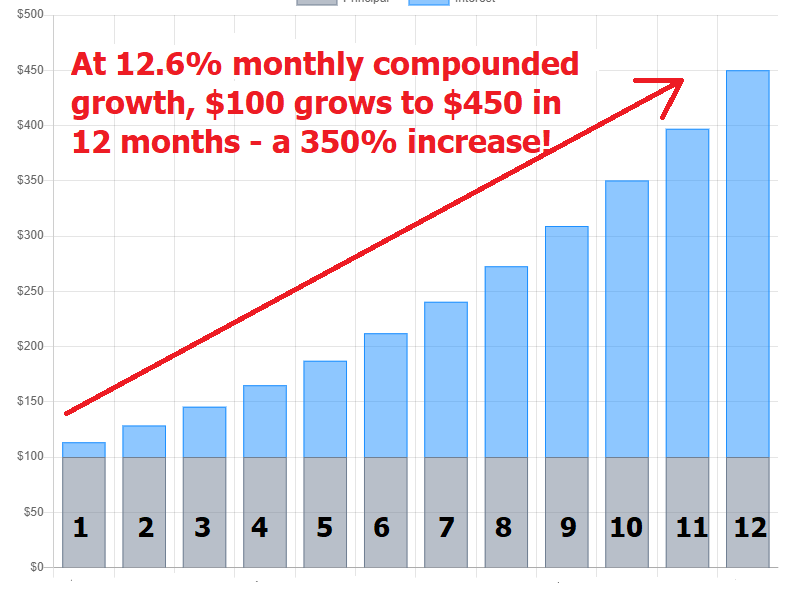
What would your financial health look like if the cost of your food groceries went up 350% in the next year? Yet this is exactly the fate that 46 lesser developed countries in the United Nations are experiencing as I write these words. Keep in mind that in two of those countries, Lebanon and Sri Lanka, the Central Banks of those provinces effectively declared bankruptcy recently.
In the United States, since we are the reserve currency of the world, we like to think that could never happen here.
I’m not trying to be a bearer of doom and gloom. Quite the opposite.
Six months ago, the former founder and CEO of Twitter, Jack Dorsey posted the following two tweets in his Twitter account proclaiming that hyperinflation was coming.
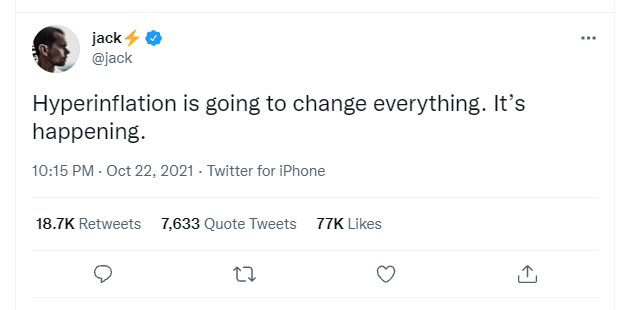
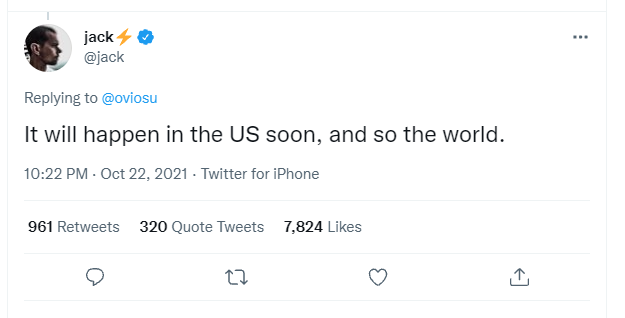
He was immediately dismissed by the mainstream. Yet, Square is a $100 billion company and has a product suite which is engaged in all aspects of merchant processing and financing. It also has CashApp, Square Payroll, Square Reader, Square Register, Afterpay (Buy Now- Pay Later) as well as Square financing. Through these different contact points in the world of finance it has billions of data points that make up its dataset comprised of over 30 million active CashApp users.
Traditional economic theory states that hyperinflation is defined as price increases of 50% per month. While I have not seen any published reports of that magnitude, my concern is that we are certainly heading in that direction very quickly. More importantly, the lesser developed nations of the world, and their citizens cannot afford these 12.6%-month price increases in the wholesale cost of food.
Usually at times like this the only tool of the media and elected officials is the blamestorm game. They blame private enterprise. They blame Putin. They blame the opposing political party. The unfortunate truth is that the history of money is almost always the same. Those who control the financial spigot corrupt the value of money by debasing the currency.
The danger that higher food prices presents to economic health should be common sense. If you cannot find a stable investment that keeps up with the increases in the price of food, then food becomes your primary investment. That unfortunately is the story of history.
Since Russia is a large producer of fertilizer and natural gas the concern that most analysts have is that this increase in food prices is far from over. This is all confirmed in the two major economic reports release this week.
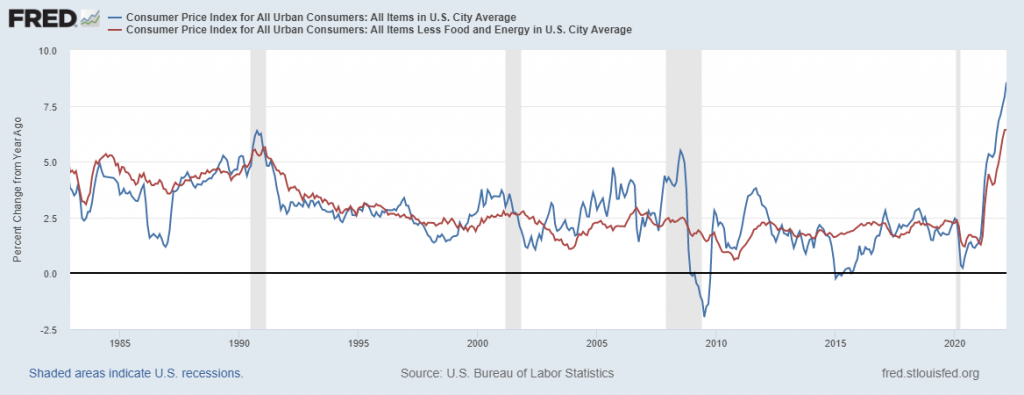
The Consumer Price Index rose 8.5% year over year. This represents the largest increase in 41 years.
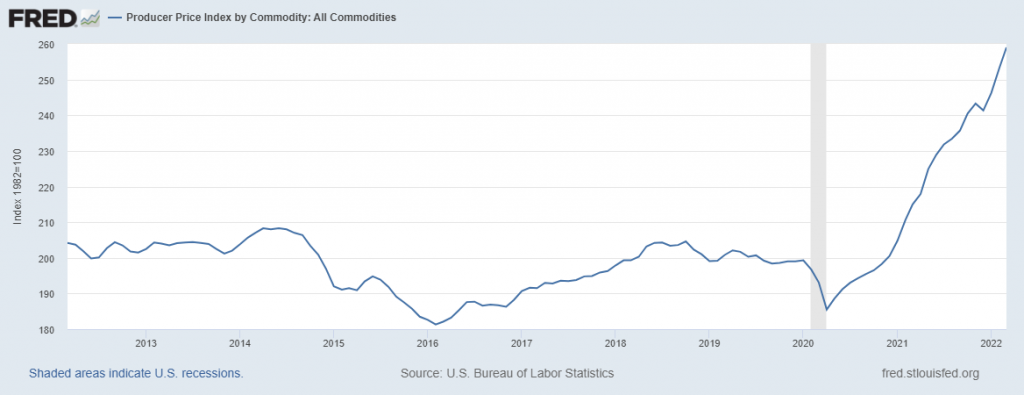
The Producer Price Index jumped 11.2% from a year ago, which represents the largest increase on record.
When the velocity of price increases starts reaching these type of record levels it behooves traders and investors to be extremely cautious of how they navigate the financial markets.
The following tweet from Charlie Bilello on the most recent CPI explains everything you need to know.
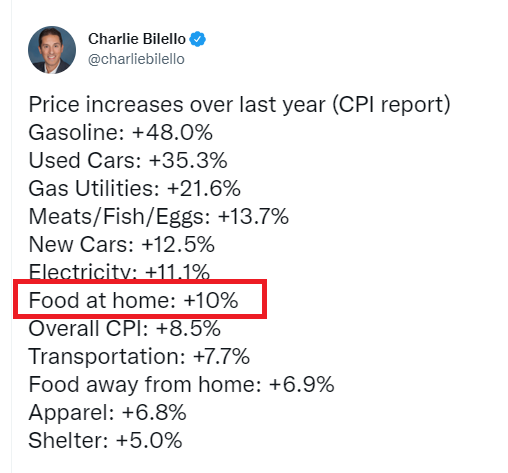
Now compare any of the above price increases to the performance of your portfolio or the broader stock market indexes.
Over the past year:
The Dow Jones Industrials is UP 2.8%
The S&P 500 Index is up 7.34%
The NASDAQ is DOWN 2.7%
When you subtract inflation from those stock index returns, we quickly see negative real rates of return.
The bottom line is how is your portfolio doing in this economic environment?
Are you keeping up with inflation and the increased cost of food?
Let me ask you a few questions:
Do you think these price increases slow down moving forward based upon an additional $2 trillion in federal deficit spending?
The Federal Debt currently stands at $28 trillion and is projected to hit $40 trillion in 2 years.
I contend that most people don’t comprehend what the word TRILLION means. We have become desensitized by the monetary printing press.
If you count to one million seconds it will take you 11 days.
If you were to count for 1 billion seconds it would take you 11 years.
If you were to count for 1 trillion seconds it would take you 32,000 years.
We are currently witnessing the greatest currency debasement in the history of the world.
To paraphrase the great songwriter Bob Dylan, “It’s a hard rain’s a-gonna fall.”
That is why there has never been a better time to trade with artificial intelligence, machine learning and neural networks.
The investment that you make in mastering the VantagePoint software is one of the fastest and most successful means of protecting the purchasing power of your hard-earned assets.
The Answer A.I. offers will surprise you.
Today Artificial Intelligence, Machine Learning and Neural Networks are an absolute necessity in protecting your portfolio.
A.I. combined with neural networks are exactly the types of analytical horsepower you need to stay on the right side of the right trend at the right time.
If survival of the fittest makes you uneasy, stay out of this zero-sum game.
If you want to win, it’s all about who has the best tools.
Artificial intelligence is so powerful because it learns what doesn’t work, remembers it, and then focuses on other paths to find a solution. This is the Feedback Loop that is responsible for building the fortunes of every successful trader I know.
That should get you excited because it is a game changer!
While reporters, talking heads and analysts want to discuss esoteric economic ideas, my only loyalty as a trader is to the trend! This is how VantagePoint artificial intelligence simplifies and empowers traders daily!
You should find out. Join us for a FREE Live Training.
We’ll show you at least three stocks that have been identified by the A.I. that are poised for big movement… and remember, movement of any kind is an opportunity!
Discover why artificial intelligence is the solution professional traders go-to for less risk, more rewards, and guaranteed peace of mind.
It’s not magic. It’s machine learning.
Make it count.

IMPORTANT NOTICE!
THERE IS SUBSTANTIAL RISK OF LOSS ASSOCIATED WITH TRADING. ONLY RISK CAPITAL SHOULD BE USED TO TRADE. TRADING STOCKS, FUTURES, OPTIONS, FOREX, AND ETFs IS NOT SUITABLE FOR EVERYONE.
DISCLAIMER: STOCKS, FUTURES, OPTIONS, ETFs AND CURRENCY TRADING ALL HAVE LARGE POTENTIAL REWARDS, BUT THEY ALSO HAVE LARGE POTENTIAL RISK. YOU MUST BE AWARE OF THE RISKS AND BE WILLING TO ACCEPT THEM IN ORDER TO INVEST IN THESE MARKETS. DON’T TRADE WITH MONEY YOU CAN’T AFFORD TO LOSE. THIS ARTICLE AND WEBSITE IS NEITHER A SOLICITATION NOR AN OFFER TO BUY/SELL FUTURES, OPTIONS, STOCKS, OR CURRENCIES. NO REPRESENTATION IS BEING MADE THAT ANY ACCOUNT WILL OR IS LIKELY TO ACHIEVE PROFITS OR LOSSES SIMILAR TO THOSE DISCUSSED ON THIS ARTICLE OR WEBSITE. THE PAST PERFORMANCE OF ANY TRADING SYSTEM OR METHODOLOGY IS NOT NECESSARILY INDICATIVE OF FUTURE RESULTS. CFTC RULE 4.41 – HYPOTHETICAL OR SIMULATED PERFORMANCE RESULTS HAVE CERTAIN LIMITATIONS. UNLIKE AN ACTUAL PERFORMANCE RECORD, SIMULATED RESULTS DO NOT REPRESENT ACTUAL TRADING. ALSO, SINCE THE TRADES HAVE NOT BEEN EXECUTED, THE RESULTS MAY HAVE UNDER-OR-OVER COMPENSATED FOR THE IMPACT, IF ANY, OF CERTAIN MARKET FACTORS, SUCH AS LACK OF LIQUIDITY. SIMULATED TRADING PROGRAMS IN GENERAL ARE ALSO SUBJECT TO THE FACT THAT THEY ARE DESIGNED WITH THE BENEFIT OF HINDSIGHT. NO REPRESENTATION IS BEING MADE THAT ANY ACCOUNT WILL OR IS LIKELY TO ACHIEVE PROFIT OR LOSSES SIMILAR TO THOSE SHOWN.

