
![]()
The Mosaic Company is a Fortune 500 company based in Tampa, Florida which mines phosphate, potash, and collects urea for fertilizer, through various international distribution networks. It is the largest U.S. producer of potash and phosphate fertilizer. The company caters customers across roughly 40 countries. It accounts for roughly 13% of global annual phosphate production and around 11% of global annual potash production.
Mosaic is responsible for 74% of North American annual phosphate crop nutrients production. This percentage explains why the company has done so well in the past year as inflation and higher food prices make farmers decide what to grow cost effectively.
Yesterday the CPI number showed 8.5% inflation in the United States. Because of this inflationary spike in the past year, the world is suffering a major price shock at the moment. As food prices continue to move higher, fertilizer stocks have been placed in premiere focus.
When supply chains break down you expect to see price shocks as demand outpaces supply. However, since fertilizer is the basic building block necessary to grow food, when disruptions exist in Russia and the Ukraine in fertilizer, these supply shocks are more than noteworthy as they will create food bottlenecks and shortages potentially for years to come.
Just last month, MOSAIC reported that its January and February potash sales more than doubled year over year. Mosaic ($MOS) mines phosphate from around 200,000 acres of land in Central Florida. It also mines potash mines mainly in Saskatchewan, Canada. Its products are processed into crop nutrients, and then shipped to customers to major agricultural centers globally.
The war in eastern Europe is creating a fertilizer shortage, which will have global disruptions for farmers’ livelihoods, output, and the overall cost of food.
Last month, $MOS reported impressive fourth-quarter results, with revenues of $3.84 billion, up 56.3% year-over-year. Meanwhile, adjusted earnings came in at $1.95 per share, up from $0.57 per share the previous year.
Earnings for 2021 were $4.27 per share compared with $1.75 per share a year earlier. Net sales rose 42.3% year over year to around $12,357.4 million. These are very strong and supportive balance sheet fundamentals and demonstrate that $MOS has a product that everyone wants more of in an inflationary food shortage.
$MOS has a market cap of $27.8 Billion and trades on average 10.2 million shares a day.
In this weekly stock study, we will look at and analyze the following indicators and metrics as are our guidelines which dictate our behavior in deciding whether to buy, sell, or stand aside on a particular stock.
- Wall Street Analysts’ Estimates
- 52-week High and Low Boundaries
- The Best Case and Worst-Case Scenarios Over the Last Year
- Vantagepoint A.I. Forecast (Predictive Blue Line)
- Neural Network Forecast
- Daily Range Forecast
- Intermarket Analysis
- Our Trading Suggestion
Analysts’ Ratings
Based on 14 Wall Street analysts offering 12-month price targets for Mosaic Co in the last 3 months. The average price target is $62.31 with a high forecast of $83.00 and a low forecast of $49.00. The average price target represents a -17.45% change from the last price of $75.48.
Wall Street Analysts have a very divergent opinion on $MOS. We like there are a handful of BULLS in the midst who have a high estimate of $83.
We expect Wall Street analysts to revise these estimates higher as food prices rise and the awareness emerges that fertilizer is essential for growing food.
52-week High-Low Chart
Over the last 52 weeks the stock has traded as high as $75.90 and as low as $28.26. The annual trading range has been $47.64 which creates an average weekly trading range of just under .91. We look to amplify this value greatly when trading with A.I.
To determine the current annualized volatility in $MOS we divide the annual trading ran of $47.64 by the current price of 75.48. This permits us to see that the annualized volatility is quite high at 63%. Should this annualized volatility continue into the future we can expect next year’s trading range to be as high as $123.12 and as low as $27.84.

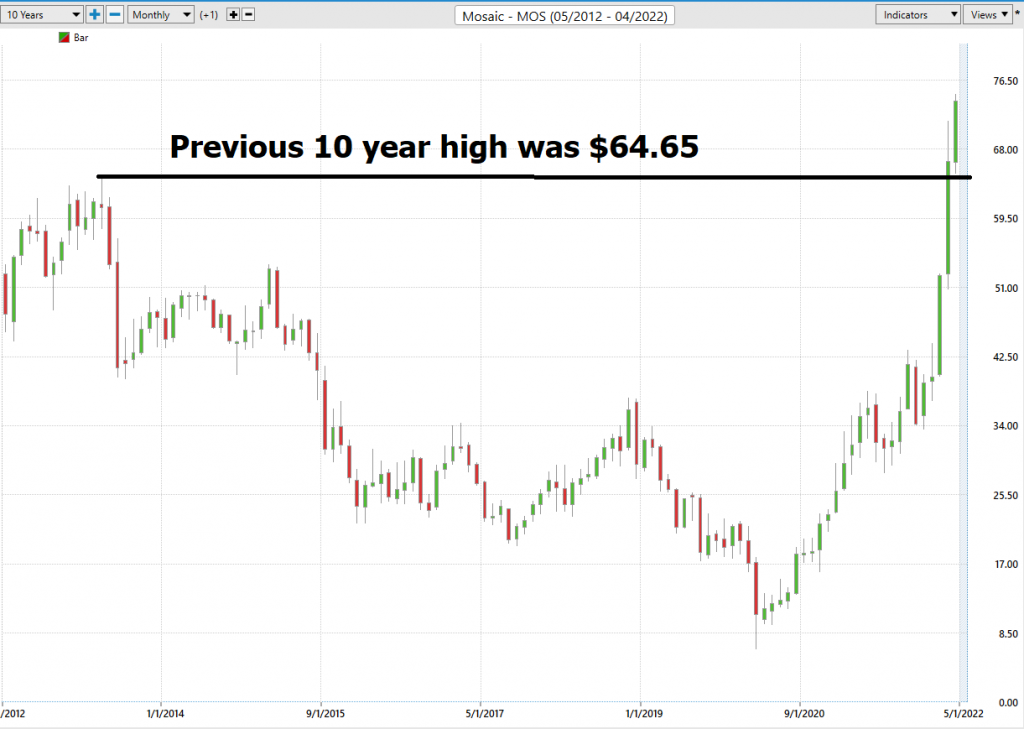
One of the ongoing and very important themes that we ascribe to is looking at assets that are making new 52-week highs. By simply eyeballing the 52-week chart above you can see that when a stock successfully breaches and closes above its 52-week boundary it enters a new era of volatility and usually advances to a new level very quickly. This is exactly what has occurred with $MOS.
It is even more powerful when you observe this phenomenon through the longer ten-year monthly chart. You can quickly see how powerful this trend in $MOS has been. The stock continues to make new MONTHLY highs on a ten-year chart.
As we have written about in previous stock studies one of the most powerful indicators is common sense. When you see a chart making new annual highs as well as new 10-year highs, you may not understand it, but you should be aware of it because something unique and powerful is occurring. For this reason alone, $MOS should have been on your trading radar.
Best Case – Worst Case Scenarios
When we study the long term 52-week chart we can look at the best case and worst-case scenarios just to get an eyeball perspective of the risk and volatility of this asset. This is worth doing anytime you invest or trade to monetarily understand what the potential risks and rewards have been over the past year.
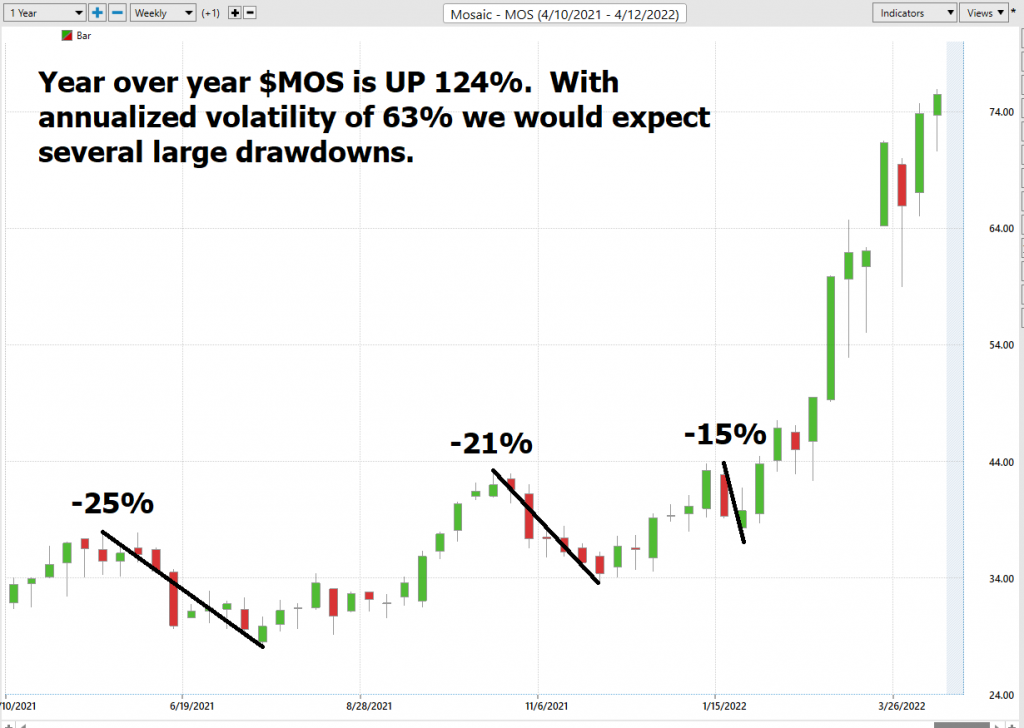
In comparison, $MOS is up 124% year over year.
S&P 500 Index is UP 6.23%
The Dow Jones Industrials is UP 1.66%
NASDAQ is UP 13.58%
The Russell 1000 Index is UP 4.25%
So, in $MOS we have an asset which over the past year has massively outperformed the broader market. In the past year the worst-case downside was -25% and the best-case upside was +124%%.
$MOS is currently trading at a NEW 52-week high. By the majority of analysts’ estimates, it is slightly overvalued.
Earnings dates have also been a key driver in $MOS price action. The next $MOS earnings call is slated for May 2, 2022.
This is a powerful narrative that could quickly see $MOS continue to post huge gains in the future.
The Vantagepoint A.I. Analysis
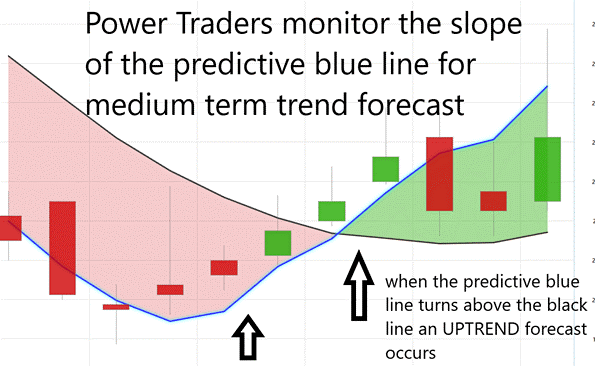
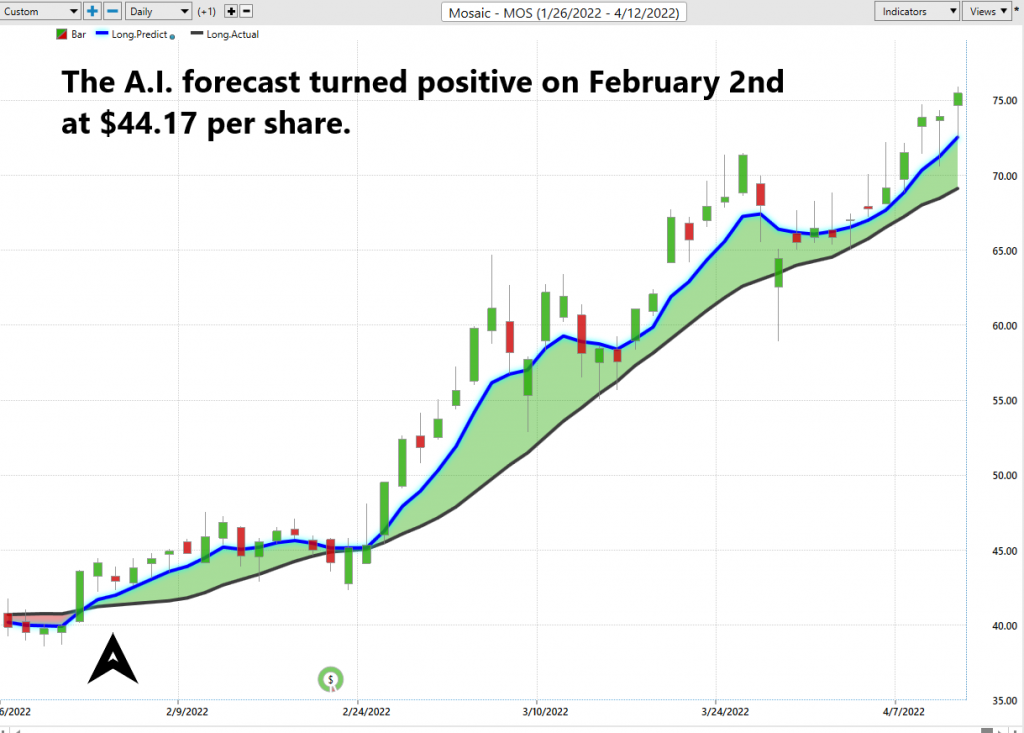
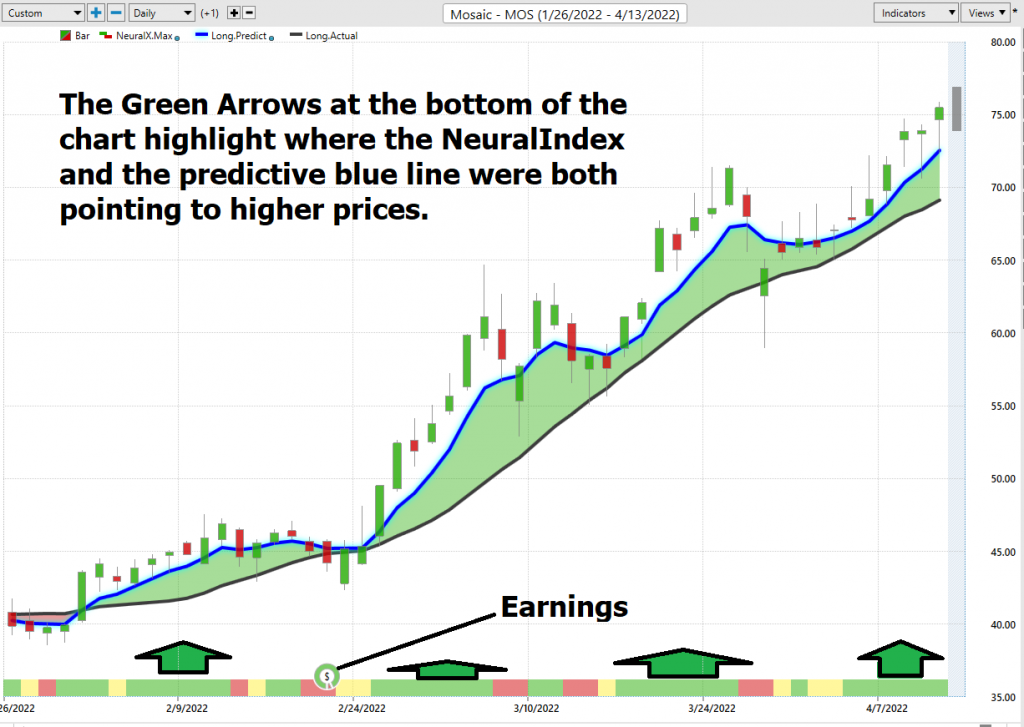
Using the Vantagepoint A.I. Software traders were alerted that the ideal value zone on this uptrend was trying to purchase $MOS at or below the predictive blue line on the chart.
Power traders use the predictive blue line in helping to determine both the value zone as well as the trend direction. I have taken the liberty of charting the predictive blue line directly underneath the price bars so that you can see its effectiveness in forecasting the trend.
Fine Tuning Entries with The Neural Net Indicator
At the bottom of the chart is the Neural Network Indicator which predicts future strength and/or weakness in the market. When the Neural Net Indicator is green it communicates strength. When the Neural Net is Red it is forecasting short term weakness in the market.
We advocate that Power Traders cross reference the chart with the predictive blue line and neural network indicator to create optimal entry and exit points.
A Neural Net is a computational learning system that uses a network of functions to understand and translate massive amounts of data into a desired output, consistently monitoring itself and improving its performance.
Power Traders are always looking to apply both the neural network and A.I. to the markets to find statistically sound trading opportunities. We refer to this as a “double confirmation” setup and look for the predictive blue line to slope higher and to be confirmed by the NeuralNet at the bottom of the chart.
VantagePoint Software Daily Price Range Prediction
One of the powerful features in the Vantagepoint A.I. Software which Power Traders use daily is the Price Range prediction forecast.
This forecast is what permits Power Traders to truly fine tune their entries and exits into the market.
At 6:30pm after the market close the software updates and all of the price predictions change based upon what the machine learning, A.I., neural networks, and intermarket analysis anticipate moving forward.
Zoom in on the last eight weeks of price action and you can see for yourself how the A.I. and machine learning combine to create a very accurate daily price range forecast that keep traders focused on optimal trade placement.
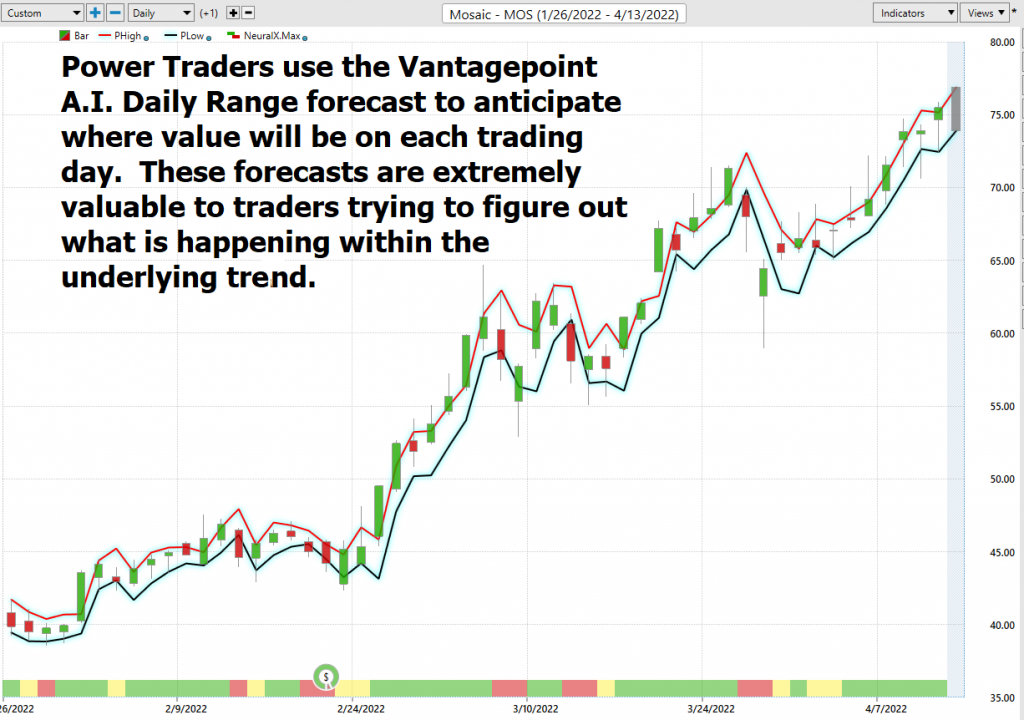
Power Traders use a price level below the predictive low price to place their protective sell stops in the market in case a sudden reversal was to occur. Observe how the predictive price low also provided numerous short term entry opportunities for traders to buy $MOS as it was trending higher.
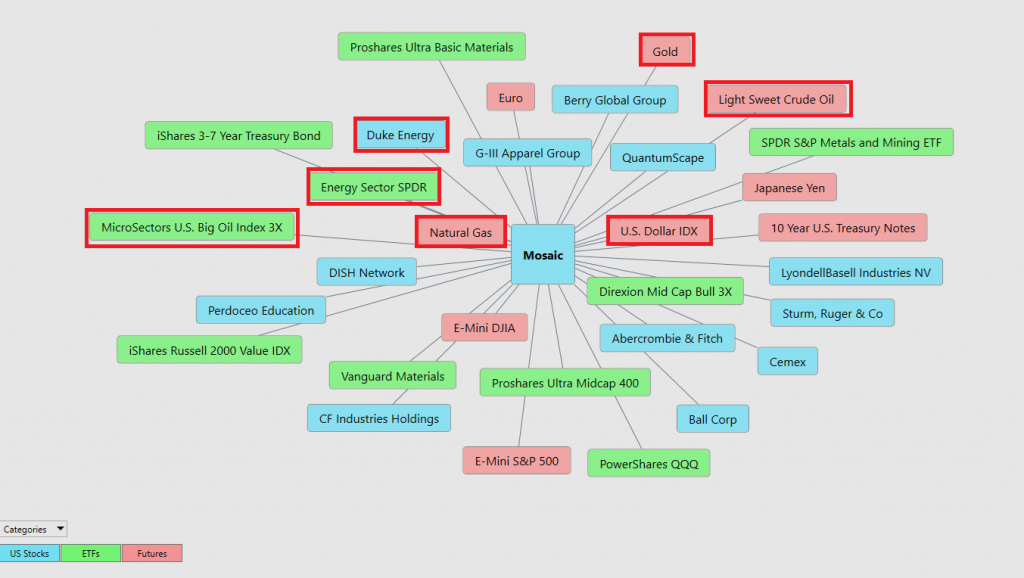
Intermarket Analysis
We live in a global marketplace. Everything is interconnected. The billion-dollar question for traders is always what are the key drivers of price for the underlying asset that I am trading?
Small changes in Interest rates, Crude Oil Prices, and the Volatility of the dollar amongst thousands of other variables affect the decisions companies must make to survive in these very challenging times. Trying to determine what these factors are is one of the huge problems facing investors and traders.
There is great value to be had in studying and understanding the key drivers of $MOS price action. universe and the most statistically correlated assets. These factors are all displayed from a standpoint of statistical correlations which show the strongest interconnectedness of prices.
Instead of watching the financial media the Vantagepoint Software provides the 31 key drivers of price. This patented technology allows traders to discover other opportunities that in the financial marketplace that you would otherwise be oblivious to.
The intermarkets also locate markets that are inversely correlated which means that as $MOS moves higher the inversely correlated markets will move lower. These hidden gems are priceless in that traders locate solid downtrends that are just as easily exploited. In looking over the intermarkets you will find several Crude Oil Petroleum resource stocks which have recently been decimated
You can quickly see that one of the reasons why $MOS has been so strong lately is that it is very highly correlated in price to the Energy Sector, Natural Gas, Gold, and the U.S. Dollar. This graphic is worth studying any time you are considering making a trade or investment. Within these price correlations is the “real narrative” of what is driving price.
Our Suggestion
We like $MOS. Why? A picture paints a thousand words. Here is a chart of Wheat.
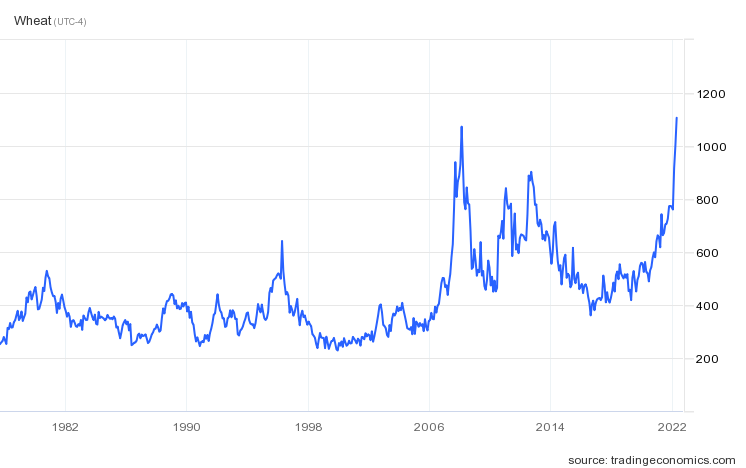
The price of this basic foodstuff can often drive historical change. In December 2010 the Arab Spring started when the price of bread rose exponentially in Islamic countries. Today we are trading 33% higher than when that uprising occurred. With a war in Eastern Europe, a supply shock regarding the price of fertilizer and its availability and a rising CPI domestically we think fertilizer assets will do extremely well.
The narrative in $MOS is explosive. The Earnings call on May 2nd will likely add more positive news to the already strong narrative.
There are only a handful of sectors and stocks that are maintaining value in the currently stagflationary environment. The ag sector and fertilizer sectors will most likely be amongst the most active sectors during the second quarter of 2022.
Our recommendation is to follow the A.I. trend analysis as outlined in this stock study and practice good money management on all trades.
We will re-evaluate based upon:
- New Wall Street Analysts’ Estimates
- New 52-week high and low boundaries
- Vantagepoint A.I. Forecast (Predictive Blue Line)
- Neural Network Forecast
- Daily Range Forecast
Let’s Be Careful Out There!
Remember, It’s Not Magic.
It’s Machine Learning.

IMPORTANT NOTICE!
THERE IS SUBSTANTIAL RISK OF LOSS ASSOCIATED WITH TRADING. ONLY RISK CAPITAL SHOULD BE USED TO TRADE. TRADING STOCKS, FUTURES, OPTIONS, FOREX, AND ETFs IS NOT SUITABLE FOR EVERYONE.
DISCLAIMER: STOCKS, FUTURES, OPTIONS, ETFs AND CURRENCY TRADING ALL HAVE LARGE POTENTIAL REWARDS, BUT THEY ALSO HAVE LARGE POTENTIAL RISK. YOU MUST BE AWARE OF THE RISKS AND BE WILLING TO ACCEPT THEM IN ORDER TO INVEST IN THESE MARKETS. DON’T TRADE WITH MONEY YOU CAN’T AFFORD TO LOSE. THIS ARTICLE AND WEBSITE IS NEITHER A SOLICITATION NOR AN OFFER TO BUY/SELL FUTURES, OPTIONS, STOCKS, OR CURRENCIES. NO REPRESENTATION IS BEING MADE THAT ANY ACCOUNT WILL OR IS LIKELY TO ACHIEVE PROFITS OR LOSSES SIMILAR TO THOSE DISCUSSED ON THIS ARTICLE OR WEBSITE. THE PAST PERFORMANCE OF ANY TRADING SYSTEM OR METHODOLOGY IS NOT NECESSARILY INDICATIVE OF FUTURE RESULTS. CFTC RULE 4.41 – HYPOTHETICAL OR SIMULATED PERFORMANCE RESULTS HAVE CERTAIN LIMITATIONS. UNLIKE AN ACTUAL PERFORMANCE RECORD, SIMULATED RESULTS DO NOT REPRESENT ACTUAL TRADING. ALSO, SINCE THE TRADES HAVE NOT BEEN EXECUTED, THE RESULTS MAY HAVE UNDER-OR-OVER COMPENSATED FOR THE IMPACT, IF ANY, OF CERTAIN MARKET FACTORS, SUCH AS LACK OF LIQUIDITY. SIMULATED TRADING PROGRAMS IN GENERAL ARE ALSO SUBJECT TO THE FACT THAT THEY ARE DESIGNED WITH THE BENEFIT OF HINDSIGHT. NO REPRESENTATION IS BEING MADE THAT ANY ACCOUNT WILL OR IS LIKELY TO ACHIEVE PROFIT OR LOSSES SIMILAR TO THOSE SHOWN.

