

Tiffany (TIF) has been in a weekly downtrend since the middle of 2011.
GAP REVIEW
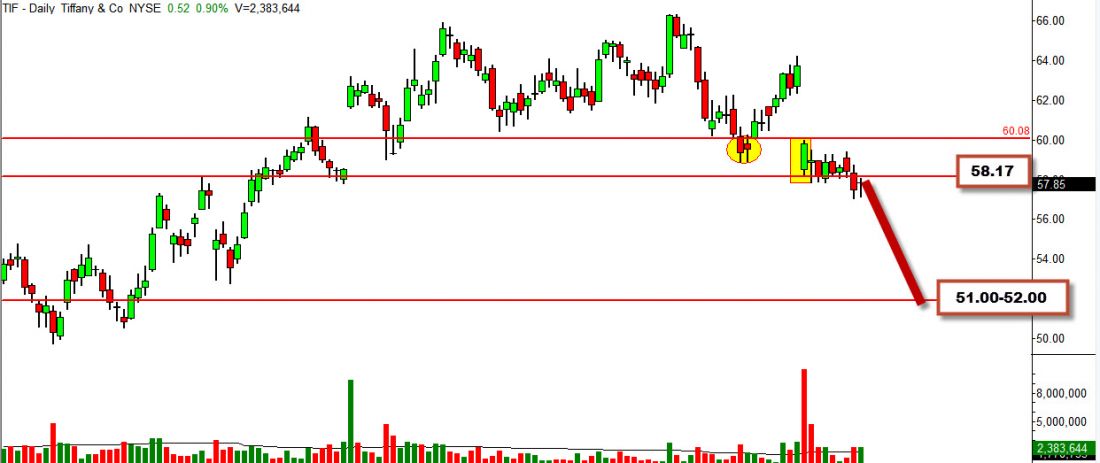
On November 29, 2012, TIF gapped down under a daily pivot. The breaking of the daily pivot confirms the weekly downtrend is still intact.
KEY LEVEL
TIF just traded below its gap down price of $58.17 and is drifting lower.
THE TRADE
Short any bounce under $58.17. Stop over $60.08. Target $51.00-$52.00 demand area.
= = =
More Stock Stories:

