

I’ve been seeing an increase in discussion about the IPO market lately.
Last year we saw the IPOs of Twitter, Rocket Fuel, the Container Store, and Potbelly to name a few. This year there are expectations for IPOs from Alibaba, the Chinese e-commerce company, GoPro, the company that makes the ‘extreme’ video cameras, Gilt Groupe, Glassdoor, and Etsy. With the surge in interest in IPOs I wanted to take a look at an ETF that gives quasi-access for investors to play this space.
The First Trust IPO Index ETF (FPX) has been trading since early 2006 but didn’t see a spike in its popular until last year. The ETF seeks to provide exposure through a value-weighted index of the 100 largest stocks in the IPOX Global Index. Some of its largest holdings include Facebook, General Motors, Kraft Foods, Tesla, and Phillips 66. Like many assets, $FPX got cut by more than half during the 2008 crisis. However, over the last five years its shot up nearly 300% while the overall equity market has risen just half that.
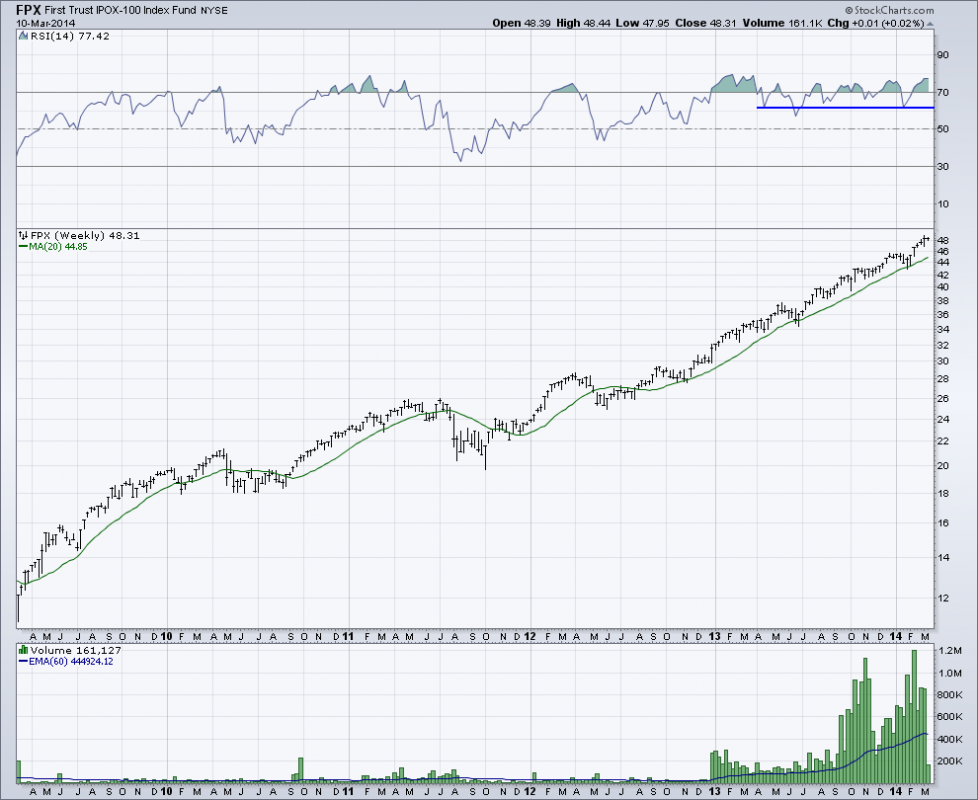
Looking at the weekly chart of FPX below, we can see the ETF rise steadily on decent volume. This all changed last year when, as the third panel of the chart shows, volume shot up. FPX went from a 60-week average volume of around 30,000 shares to almost half a million shares in 2013. Looking at the price portion of the chart we can see that since late-2012, the 20-week moving average has held up on short-term drops as it acts as support. The Relative Strength Index also has created solid support near the 65 level. It’s also important to note how much time momentum has spent in ‘overbought’ status. The surge in buyers has kept this IPO ETF with elevated momentum for nearly the entire last twelve months, a bullish sign that demand for shares of FPX has yet to wane.
With the increase in popularity of the IPO space it begs the question of when supply will exceed demand. It does not appear we are seeing signs of this just yet, but it’s hard to imagine the current interest level will stay this elevated for another twelve months. Another example of the large interest in IPOs comes from SentimenTrader which released a chart on Monday showing the high level of money-losing companies dropping ownership onto the open market. According to data from Bloomberg, 74% of the new issues over the last six months have been unable to produce a profit. This is up from 70% in 2011 and is only exceeded by 80% at the peak of the tech bubble in 2000.
Shares of IPOs are in vogue right now and show signs of a healthy bull market. It becomes troubling when this category of the equity market goes parabolic or we see signs of diverging momentum that we can begin to grow concerned.
Disclaimer: The information contained in this article should not be construed as investment advice, research, or an offer to buy or sell securities. Everything written here is meant for educational and entertainment purposes only. I or my affiliates may hold positions in securities mentioned.
RELATED READING
IPO Action this week:
Will Castlight Health’s IPO Shine by Dennis Hobein, Briefing.com

