
Who do you trust?
That can be a loaded question, but it cuts to the very heart of so much of the turmoil that is occurring in the world today.
There is a tremendous amount of social, political, economic, and cultural crisis in the news that it is difficult for one mind to try and absorb the significance of current events and plan for the future.
It’s very challenging to make sense of current events. As steady readers of this blog will notice, I refer to a handful of metrics as my “North Star” to try and make sense of the world. These metrics allow us to differentiate fact from fiction and more importantly focus on what is important.
The first metric is the yield on the US Treasury Ten Year Note.
The second metric is the government’s published inflation figures.
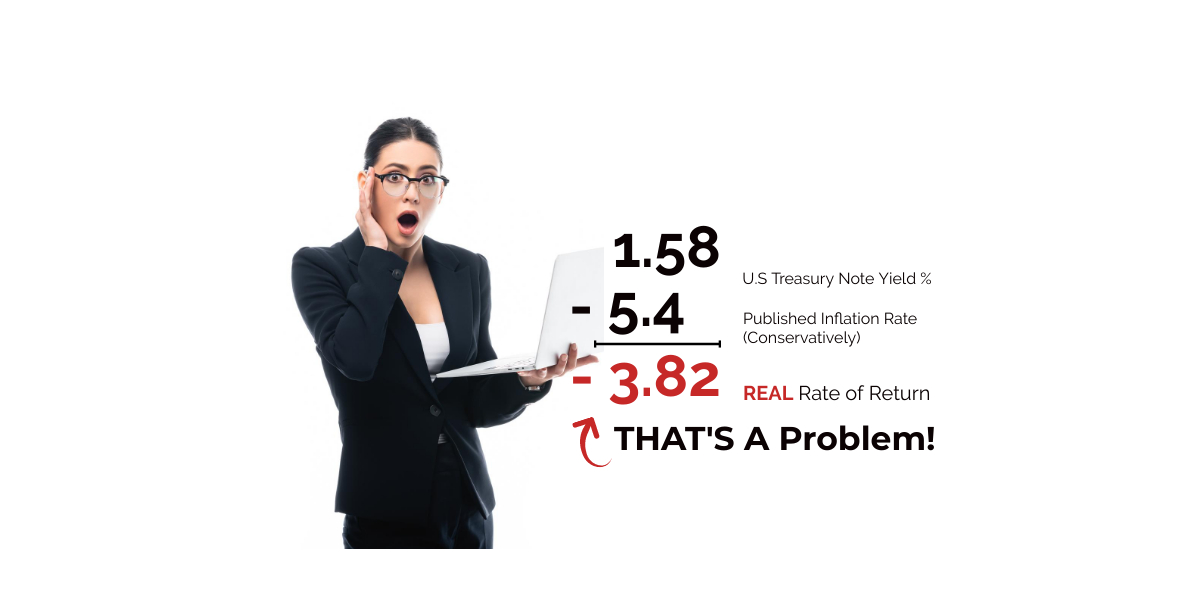
When you subtract the government’s inflation figures from the US. Treasury yield you end up with the REAL RATE of RETURN.
Currently the yield on the 10-year Treasury is 1.58
The most recent inflation figures measured by the Consumer Price Index show inflation rising at an annualized rate of 5.4%. Independent economists believe the number is much, much higher but we will work with the government figures for now.
When you subtract 5.4% from the Yield of T-Notes of 1.58% you end up with a negative 3.82% Real Rate of Return. If you want to understand what is wrong with the world just ponder the implications of that number.
Savers can’t save. Anyone who tries to save will lose 3.52% per year.
Yet, we have government officials and monetary authorities around the world telling us that interest rates need to remain near zero to promote growth in the economy.
How can an economy grow if savings are penalized?
Pension funds need 7% yields to remain viable and fulfill their obligations to retirees. Please show me how a pension fund can earn a 7% yield when they are required to invest in government bonds and their real rate of return is -3.52%?
Follow the breadcrumb trail further and you will see that low-interest rates are the culprit not the solution. Any money you have, you can choose where to allocate it. Will you loan it to the government and guarantee yourself an annualized loss of 3.52%? Or will you choose another option?
Regardless how you look at this problem it comes back to the simple reality of if savers can’t save, how is this good?
Unfortunately, the messaging by the Fed and government officials attempts to obscure the simple reality, that savers can’t save, because the currency is being devalued right before our very eyes.
Even worse, no solutions are presented!
Why?
More than HALF of the US sovereign debt will mature and will need to be refinanced within the next three years. The average interest rate on US Debt is 1.38%! Even with this historically low rate the Treasury still has $305 billion in obligations just to make interest payments. So just imagine what might happen if interest rates were to rise just to match the published inflation figures.
Suddenly the annual interest bill rises 350% to more than $1.2 TRILLION just to pay interest.
Suddenly, those $3+ trillion NEW spending plans, and $6+ trillion budget proposals, “cost something”.
More importantly, it wouldn’t take very long for the government to be unable to make interest payments any longer.
The Fed is very aware of this.
They likely realize that if they raise interest rates to fight inflation, they risk bankrupting the Treasury and triggering the US government to default on its debt.
But as much as no one wants to admit it, the Fed is out of ammo and the Debt markets may force their hand.
The Fed is “pushing on a string” which is the metaphor on Wall Street to state that they are exerting effort with no benefit. “Pushing on a String” communicates that government cannot compel businesses or households to spend, (or buy US Treasury Notes) if they choose not to, hence, the monetary policy only works in one direction: impacting government spending.
Since the Great Financial Crisis of 2008, we have seen the Central Bank increase its balance sheet to over $8 trillion, All of the Feds messaging for the last 13 years has been that this expansionist monetary policy would raise the economy out of the doldrums.
If the Fed lowers interest rates further, they remain the only buyer of US. Treasury obligations.
If the Fed stops or lowers its purchases of Treasury obligations, also referred to as tapering, it signals to the economy that government spending will have to be reduced.
If they raise rates the Treasury has to pay much more in interest payments.
This is important for traders and investors to understand because the global Treasury market is over $128 trillion in size.
You cannot compel traders, investors, and businesses to buy something if they are guaranteed to lose money by engaging with it.
This is noteworthy today because the predicament we are facing fundamentally is where will the scared investor place their money if Bonds continue to offer a horrible return and not match inflationary pressures?
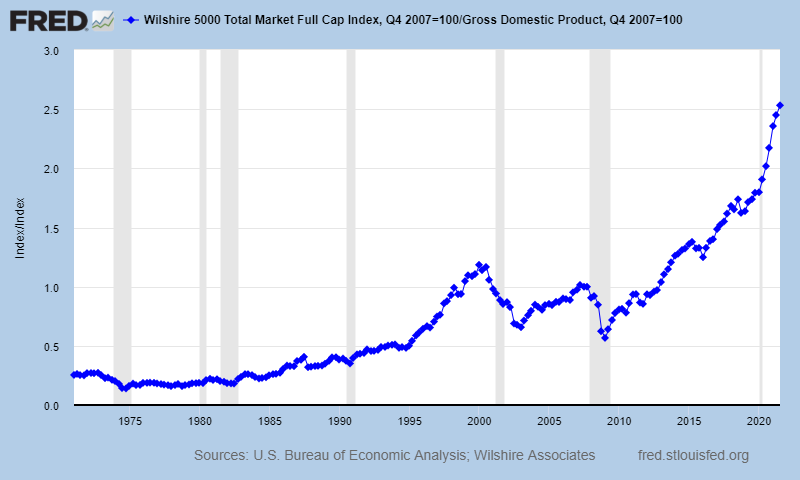
The St. Louis Federal Reserve publishes the Warren Buffet Indicator which is calculated by simply taking all the public stocks in the country and dividing by the Gross Domestic Product (GDP). The chart is published below, and you can see by this valuation metric we are twice as high as we were during the dotcom bubble bust in the year 2000. For those of you who recall the meltdown when the bubble busted, we saw stocks like Amazon selloff over 85%!
While the trend in Stocks is clearly UP, this market is not for the uninitiated or uninformed. The valuation of stocks at all-time historical highs should be cause for concern to any investor or trader.
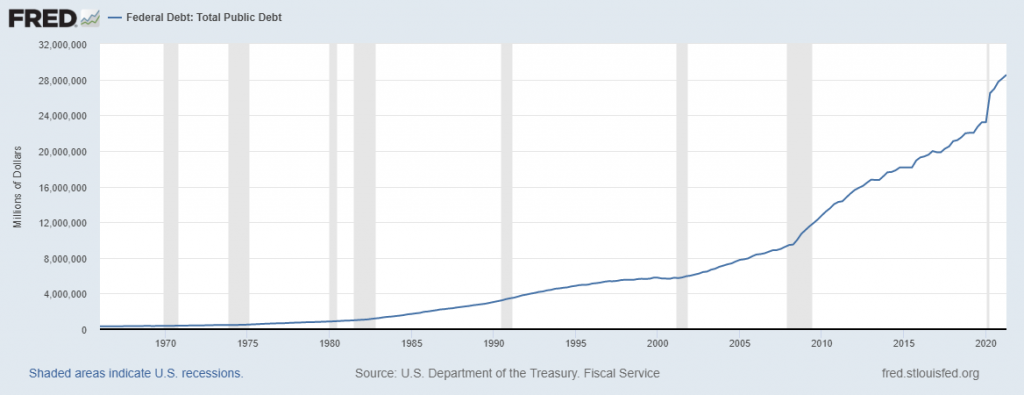
There is no government in history that has been immune to the destructive effects of heavy indebtedness.
Since the Great Financial Crisis, the US Debt has gone from $10 trillion to $28 trillion.
Meanwhile, GDP in 2009 was $14 trillion and today GDP is $21.4 trillion. Debt is growing 2.5 times faster than GDP.
Bottom line.
How do you make sense of it all?
Markets do not reward critical thinking, or sound logic.
In an age where savers are penalized, traders and investors need to be committed to finding the most solid and predictable trends.
It’s about price.
If you do what price does, you will make money.
If you don’t do what price does, you will lose money.
This is why artificial intelligence is so important for traders.
I have laid out my thesis regarding interest rates and government indebtedness, but I would urge you as you consider their plausibility not to let them interfere with your trading decisions.
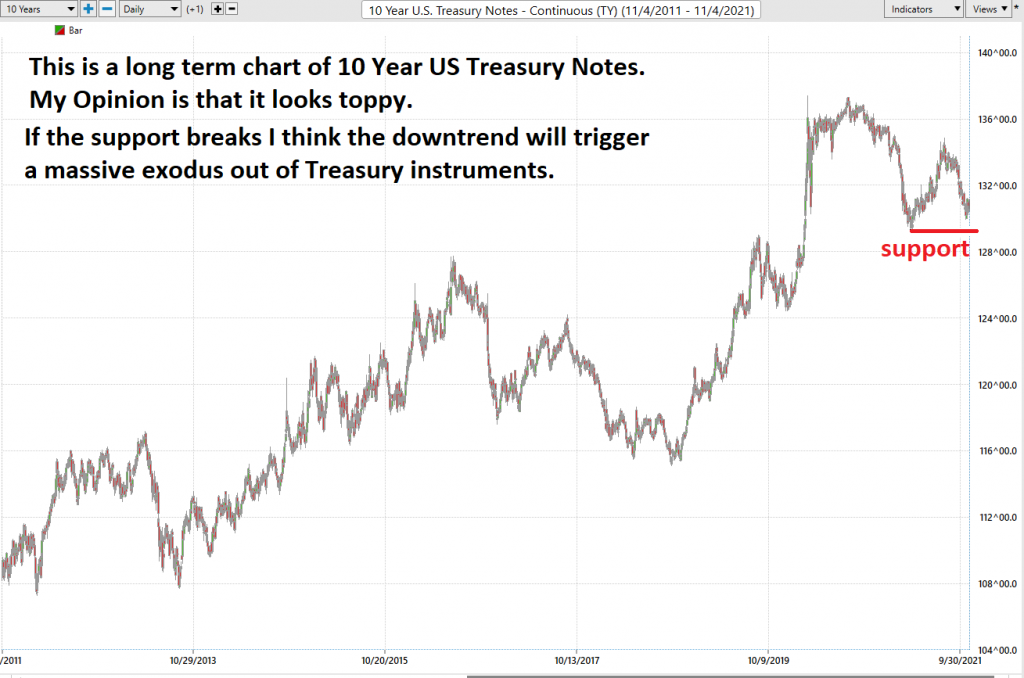
Here is the long-term chart of US Treasury Notes.
If the support on the chart breaks, it could create a massive spike downwards as we witness an exodus out of US Treasuries for all of the reasons mentioned in this article.
It’s important to note, this is just one OPINION.
But I think it is a well-reasoned and logical opinion.
But never let opinions get in the way of the FACTS you need to be successful trading markets.
Opinions are just a story.
The TREND is the FACTS.
I contend that this shift, when it occurs could see massive money flows out of DEBT instruments.
When the question of where does scared money run to is correctly answered a new breed of very wealthy traders will be created.
This is the solution that artificial intelligence provides.
Traders should brace themselves for some serious volatility.
Traders who can adapt will be handsomely rewarded.
Buy and hold investors may be in for a wild ride.
If you understand we are living in a Brave New Financial World you also understand you need new tools to make sense of the madness. Interest Rates are being pushed to negative territory around the world in the “hopes” that it will stimulate economic growth.
Last I checked there were $18 trillion dollars of negative yielding Treasury Bonds in the world. It’s anybody’s guess when the dash out of negative yielding investments will begin. But when it does it spells huge opportunity for traders.
What traders need is a solution that takes these massive distortions into effect and delivers statistically sound decision making.
How do you find the right trend at the right time, day in and day out?
Successful traders are obsessed at finding solid trends.
How good are you at making decisions?
What has your performance been this year?
What’s Your Best Chance to Make Money in The Financial Markets Today?
The Answer A.I. Offers Will Surprise You. Intrigued?
You too can start finding the best trend at the right time regardless of your experience.
After all, a.i. has beaten humans at Poker, Chess, Checkers, Jeopardy and Go. Why should trading be any different?
Visit with us and check out the A.I. at our Next Live Training.
Discover why artificial intelligence is the solution professional traders go-to for less risk, more rewards, and guaranteed peace of mind.
It’s not magic. It’s machine learning.
Make it count.

IMPORTANT NOTICE!
THERE IS SUBSTANTIAL RISK OF LOSS ASSOCIATED WITH TRADING. ONLY RISK CAPITAL SHOULD BE USED TO TRADE. TRADING STOCKS, FUTURES, OPTIONS, FOREX, AND ETFs IS NOT SUITABLE FOR EVERYONE.
DISCLAIMER: STOCKS, FUTURES, OPTIONS, ETFs AND CURRENCY TRADING ALL HAVE LARGE POTENTIAL REWARDS, BUT THEY ALSO HAVE LARGE POTENTIAL RISK. YOU MUST BE AWARE OF THE RISKS AND BE WILLING TO ACCEPT THEM IN ORDER TO INVEST IN THESE MARKETS. DON’T TRADE WITH MONEY YOU CAN’T AFFORD TO LOSE. THIS ARTICLE AND WEBSITE IS NEITHER A SOLICITATION NOR AN OFFER TO BUY/SELL FUTURES, OPTIONS, STOCKS, OR CURRENCIES. NO REPRESENTATION IS BEING MADE THAT ANY ACCOUNT WILL OR IS LIKELY TO ACHIEVE PROFITS OR LOSSES SIMILAR TO THOSE DISCUSSED ON THIS ARTICLE OR WEBSITE. THE PAST PERFORMANCE OF ANY TRADING SYSTEM OR METHODOLOGY IS NOT NECESSARILY INDICATIVE OF FUTURE RESULTS. CFTC RULE 4.41 – HYPOTHETICAL OR SIMULATED PERFORMANCE RESULTS HAVE CERTAIN LIMITATIONS. UNLIKE AN ACTUAL PERFORMANCE RECORD, SIMULATED RESULTS DO NOT REPRESENT ACTUAL TRADING. ALSO, SINCE THE TRADES HAVE NOT BEEN EXECUTED, THE RESULTS MAY HAVE UNDER-OR-OVER COMPENSATED FOR THE IMPACT, IF ANY, OF CERTAIN MARKET FACTORS, SUCH AS LACK OF LIQUIDITY. SIMULATED TRADING PROGRAMS IN GENERAL ARE ALSO SUBJECT TO THE FACT THAT THEY ARE DESIGNED WITH THE BENEFIT OF HINDSIGHT. NO REPRESENTATION IS BEING MADE THAT ANY ACCOUNT WILL OR IS LIKELY TO ACHIEVE PROFIT OR LOSSES SIMILAR TO THOSE SHOWN.

