

Arista Networks is an American computer networking company headquartered in Santa Clara, California. The company is engaged in the development, marketing, and sale of cloud networking solutions in the Americas, Europe, the Middle East, Africa, and the Asia-Pacific. $ANET primarily designs and sells multilayer network switches to deliver software-defined networking (SDN) for large datacenter, cloud computing, high-performance computing, and high-frequency trading environments. The company has a market cap of $38.2 billion and trades on average 418,000 shares per day.
Over the last decade, $ANET has been a leading competitor in the cloud networking has disrupted the traditional networking industry with innovative solutions for cloud providers. $ANET’s specialty has been that it disaggregated software and hardware to offer large customers more flexibility to build network infrastructures that better corresponded to their needs. As a result, the company had a 7.8% market share in 2014. Currently it has larger than a 16.3% market share as of 2021.
$ANET has established itself as a disruptive player in the ethernet switching industry. Arista Networks pioneered a software-driven networking solution for cloud data centers. Early on, this assisted $ANET to acquire big name customers like the Chicago Board Options Exchange who needed something to support a high frequency trading networking environment. Other big-name, high-profile customers include Microsoft and Facebook. As a matter of fact, Microsoft accounts for about 23% of its annual revenue which means the growth trajectory of $ANET should correlate very closely with Microsoft’s results. Between 2011 and 2020, $ANET revenue grew at an average rate of 36.5% while its stock soared at a 29% average rate between its 2015 IPO and the end of 2020.
Alongside earnings, $ANET announced that it will buy back up to $1 billion of its stock. Its board of directors also approved a four-for-one stock split. Each shareholder of record at the close of business on November 11, 2021, will receive three additional shares for every share they own. Usually when a company splits its share price it is trying to make its shares more accessible to a broader base of investors by lowering the price. Over the past two years Revenue has grown 16% and earnings per share year over year are up 19.5%.
$ANET’s success as a company is attributed to its proprietary Extensible Operating System (EOS). This software is what powers its entire portfolio of switching and routing products and allows clients to deploy a seamless incredible fast and efficient network across public, private, and hybrid-cloud environments.
In this weekly stock study, we will look at and analyze the following indicators and metrics as our guidelines:
- Wall Street Analysts’ Estimates
- 52-week high and low boundaries
- Vantagepoint A.I. Forecast (Predictive Blue Line)
- Neural Network Forecast
- Daily Range Forecast
- Intermarket Analysis
- Our trading suggestion
We only look at things like earnings or fundamental cash flow valuations to better understand the financial landscape that a company is operating under.
Analysts Ratings
Based on 18 Best Performing Wall Street analysts offering 12-month price targets for Arista Networks in the last 3 months. The average price target is $469.94 with a high forecast of $542.00 and a low forecast of $350.00. The average price target represents a -3.69% change from the last price of $488.62.
With its recent stellar earnings performance and 4 for 1 stock split announcement our opinion is that analysts will be revising their estimates upwards in the coming months.
The next scheduled earnings release for $ANET is on February 12, 2022. While this is 4 months away, to better anticipate what might occur moving forward, look back over the last 4 months particularly at the drawdowns. I think that assuming very similar volatility is a very valid assumption moving forward.
52-week High-Low Chart
Over the last 52 weeks $ANET has traded as high as $524.99 and as low as $239.24. This provides us with an annual trading range of $285.75. When we divide this metric by 52 weeks, we can determine that the average weekly trading range for $ANET is $5.40. What we often like to do as well is divide the annual trading range ($285.75) by the current price ($487) to provide us with a very basic and generic calculation of how the annualized volatility for $ANET, which is currently 58.6%.
We refer to these as the commonsense metrics which we use as baseline measurements of understanding normal value. When using artificial intelligence, we look to amplify our returns based upon these baseline measurements.
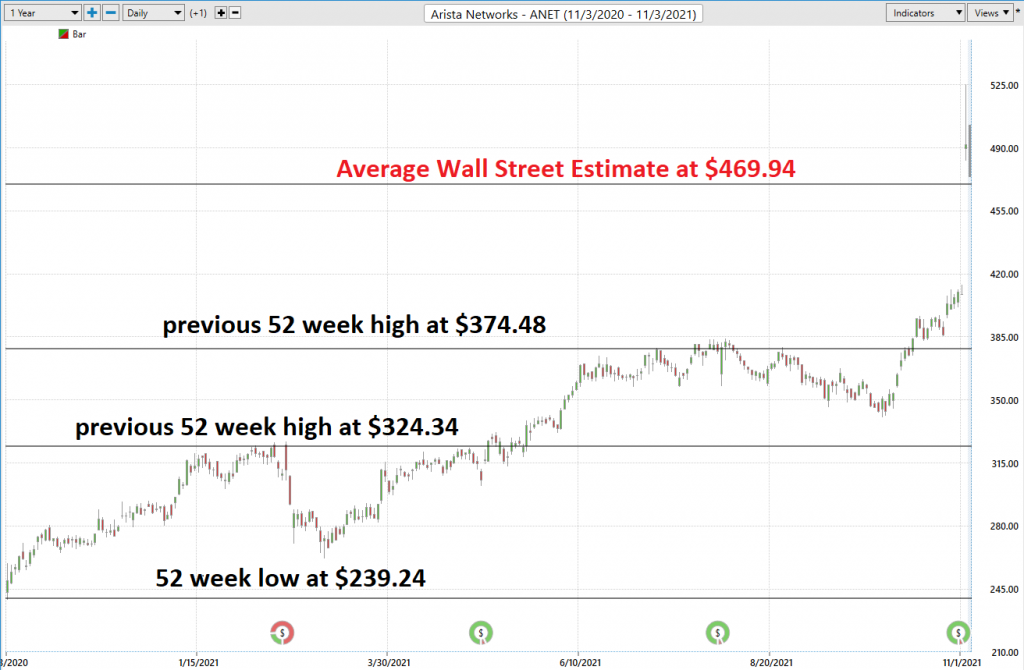
We always pay attention to where we are in relation to the 52-week trading range. It is very common to see the 52-week high provide very strong resistance to the market until it is breached. Often when the 52-week high is breached we will see the stock price explode higher very quickly over a very short period.
We like to place all these values on the chart just to get an idea of historical price action and Wall Street experts’ valuation.
Our rule of thumb is whenever we look at an asset like $ANET is trading 10% or more below how top Wall Street analysts value it, we should pay very careful attention, and place it on our radar. This is how Power Traders use artificial intelligence as their North Star.
The average Wall Street Analysts price estimate is currently at $469.94 per share. By simply drawing these lines on the 52-week chart we can quickly see how price action has reacted to these important boundaries.
Best Case – Worst Case Scenarios
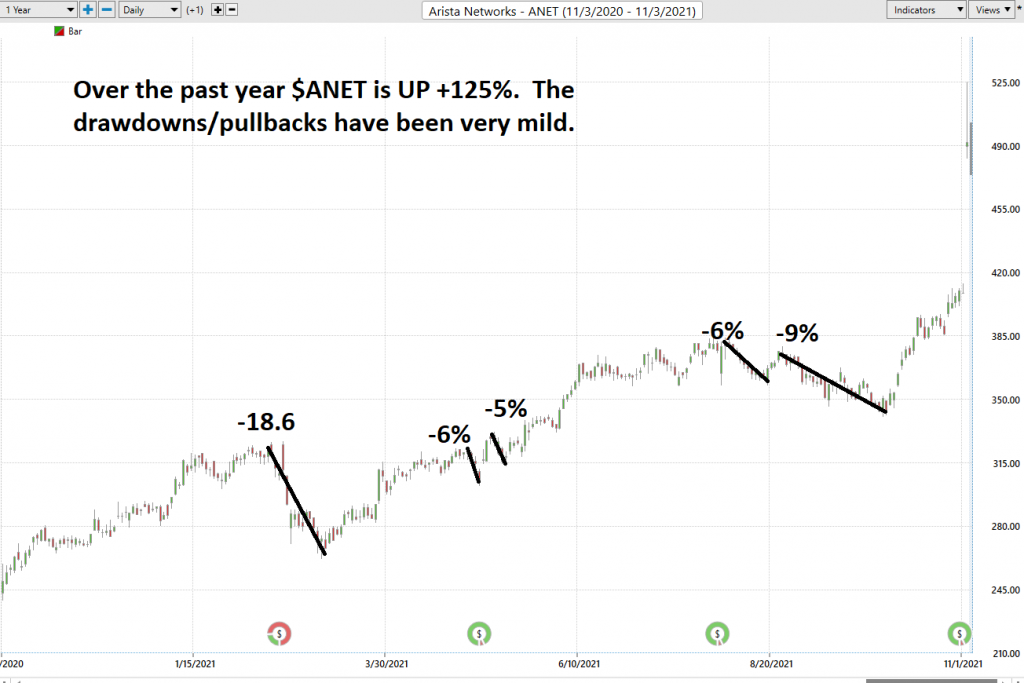
When we study the long term 52-week chart we can look at the best case and worst-case scenarios just to get an eyeball perspective of the risk and volatility of this asset. This is worth doing anytime you invest or trade to monetarily understand what the potential risks and rewards have been over the past year.
This simple practical analysis reveals what the realistic volatility of $ANET has been over the past year.
It is very unusual to see an asset move up 125%% in a year with this little downside risk.
Next, we compare $ANET to the broader stock market indexes to get an idea of its relative performance.
$ANET + 125.42%
S&P 500 Index +39.84%
Dow Jones Industrials +33.85%
NASDAQ +72.67%
Russell 1000 Index +40.48%
So, in $ANET we have an asset which historically has massively outperformed the broader stock market indexes by a minimum factor of 3 to 1. It also has had less downside volatility in comparison.
What we can learn from this simple analysis is that anytime $ANET drops 15% from a recent high you should put it on your radar and wait for the a.i. forecast to turn positive. This has been considered a winning move for Power Traders repeatedly over the past year.
The Vantagepoint A.I. Analysis
We will zoom in on a smaller time frame of the last two months.
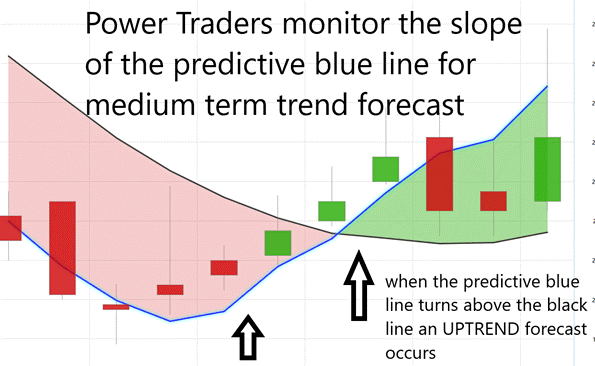
In studying the chart below pay close attention to the slope of the blue line.
The predictive blue line utilizes that Vantagepoint patented Neural Network and Intermarket Analysis to arrive at its value. It looks at the strongest price drivers of an asset through artificial intelligence and statistical correlations to determine its value.
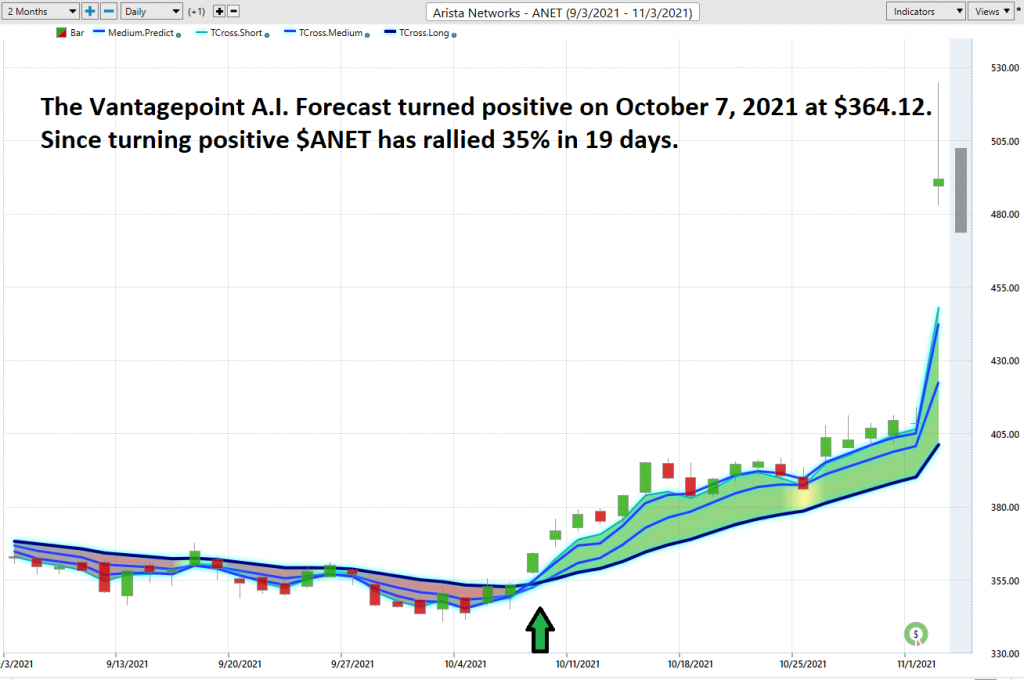
Whenever we see the predictive blue line move above the black line, we are presented with an UP-forecast entry opportunity. This is what occurred on October 7, 2021 @ $364.12 per share. Price has rallied 35% in the last 19 days.
Power traders can use the predictive blue line in helping to determine both the value zone as well as the trend direction. Two consecutive closes above the predictive blue line define where an uptrend forecast occurs.
When the SLOPE of the predictive blue line turns higher it become clear that a change in price direction is upon us.
Observe how the SLOPE of the predictive blue line started moving higher a few days before it moved above the black line. A very strong trend was evidenced by seeing that price was consistently closing above the predictive blue line.
Fine Tuning Entries with The Neural Net Indicator
At the bottom of the chart is the Neural Network Indicator which predicts future strength and/or weakness in the market. When the Neural Net Indicator is green it communicates strength. When the Neural Net is red it is forecasting short term weakness in the market.
A Neural Net is a computational learning system that uses a network of functions to understand and translate massive amounts of data into a desired output, consistently monitoring itself and improving its performance.
We advocate that Power Traders cross reference the chart with the predictive blue line and neural network indicator to find their optimal entry and exit points. We refer to this cross referencing as the DOUBLE CONFIRMATION setup. This occurs when both the Neural Index and the a.i. are aligned with regards to their trend forecast.
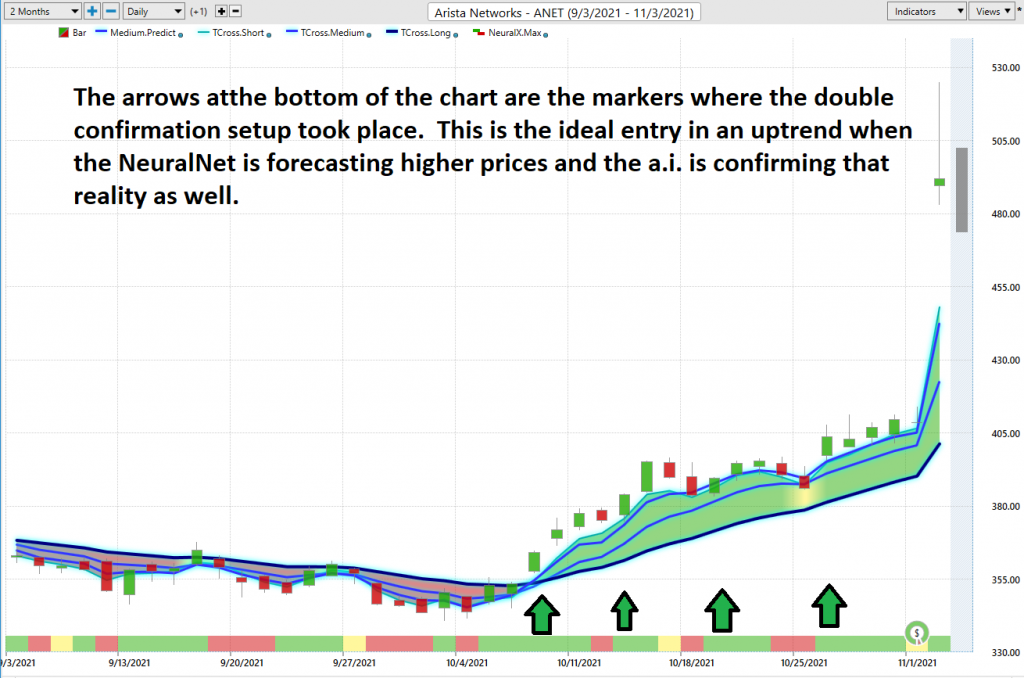
Power Traders are always looking to apply both the neural network and a.i. to the markets to find statistically sound trading opportunities. We advise Power Traders to cross-reference the predictive blue line with the Neural Net for the best entry opportunities.
VantagePoint Software Daily Price Range Prediction
One of the powerful features in the Vantagepoint A.I. Software which Power Traders use daily is the Daily Price Range prediction forecast.
This forecast is what permits Power Traders to truly fine-tune their entries and exits into the market. Every trader whenever they decide to trade has to make the decision regarding where they should get in and where they should get out. The Vantagepoint A.I. Daily Range Forecast answers these questions with exacting precision. Here is the price chart of $ANET during the most recent runup featuring the Daily Price Range forecast and the Neural Net Indicator.
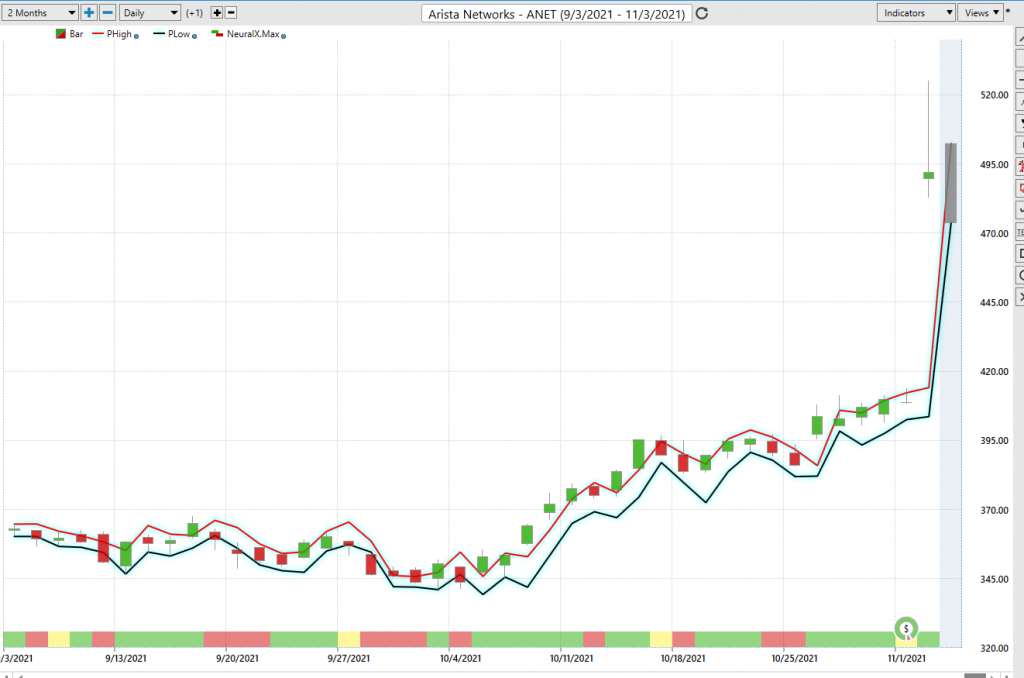
In summary, observe how after October 7, 2021, when the trend forecast turned up, that any RED moments in the Neural Net could have provided opportunities to buy during anticipated weakness and pullbacks.
Intermarket Analysis
Why is $ANET up 125% year over year?
Ask that question to 100 Wall Street Analysts and you will get 100 different answers.
The challenge for all investors and traders is differentiating between opinion and fact.
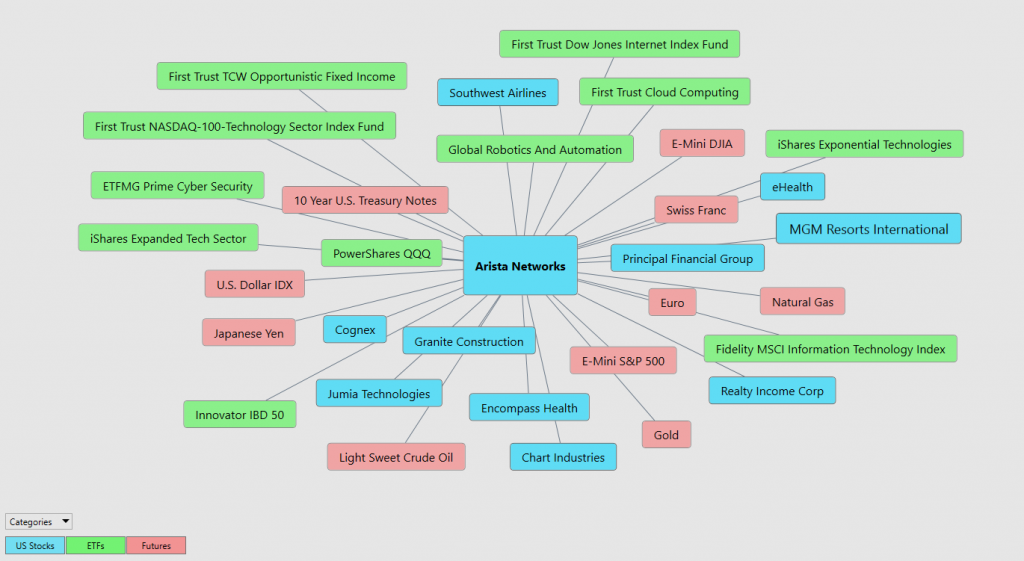
What makes the Vantagepoint Software truly unique is its ability to perform Intermarket analysis and to locate those assets which are most interconnected that are responsible for driving the price of $ANET higher or lower.
Studying the charts can always provide objective realities in terms of locating support and resistance levels which become very clear on a chart. But we live in a global marketplace. Everything is interconnected. The billion-dollar question for traders is always what are the key drivers of price for the underlying asset that I am trading?
These intangibles are invisible to the naked eye yet show very high statistical correlations.
In $ANET we see a very strong and persistent correlation to Crude Oil, The Dow Jones Index, S&P 500, Natural Gas. We can also see the other top-performing ETF’s which have $ANET as a component. Scanning these Intermarket relationships allows traders to see the statistically correlated assets that are responsible for driving $ANET’s price.
Small changes in Interest rates, Crude Oil Prices, and the Volatility of the dollar amongst thousands of other variables affect the decisions companies must make to survive in these very challenging times. Trying to determine what these factors are is one of the huge problems facing investors and traders.
There is great value to be had in studying and understanding the key drivers of $ANET price action.
Keep in mind that since $ANET is up 125% over the past year these drivers are both positively and negatively correlated. This is an amazing research tool that consistently uncovers future trading and investing gems.
Our Suggestion
The consensus of analysts’ opinions shows that $ANET is still slightly undervalued at current levels. We think the 4 for 1 stock split which will become effective November 11, 2021, also bodes well for the longer-term prospects.
However, we try to focus on the present moment to not deceive ourselves with unbridled optimism.
Technically speaking $ANET has left a huge GAP on the daily chart. The range of the GAP is priced at the $413 and $482 levels.
The trend is UP. Make no mistake about that.
$ANET has also broken out of a broad trading range.
However, it is also trading at new all-time highs. Usually when a market breaks out to new all-time highs, which is what we are seeing in $ANET, one may experience a broad-based pullback and selloff which tests the bull’s staying power.
Experienced OPTIONS traders might consider selling PUTS and collecting premium on any sharp pullbacks.
Our recommendation is – follow the A.I. trend analysis and practice good money management on all trades.
We will re-evaluate based upon:
- New Wall Street Analysts’ Estimates
- New 52-week high and low boundaries
- Vantagepoint A.I. Forecast (Predictive Blue Line)
- Neural Network Forecast
- Daily Range Forecast
Let’s Be Careful Out There!
Remember, It’s Not Magic.
It’s Machine Learning.

IMPORTANT NOTICE!
THERE IS SUBSTANTIAL RISK OF LOSS ASSOCIATED WITH TRADING. ONLY RISK CAPITAL SHOULD BE USED TO TRADE. TRADING STOCKS, FUTURES, OPTIONS, FOREX, AND ETFs IS NOT SUITABLE FOR EVERYONE.
DISCLAIMER: STOCKS, FUTURES, OPTIONS, ETFs AND CURRENCY TRADING ALL HAVE LARGE POTENTIAL REWARDS, BUT THEY ALSO HAVE LARGE POTENTIAL RISK. YOU MUST BE AWARE OF THE RISKS AND BE WILLING TO ACCEPT THEM IN ORDER TO INVEST IN THESE MARKETS. DON’T TRADE WITH MONEY YOU CAN’T AFFORD TO LOSE. THIS ARTICLE AND WEBSITE IS NEITHER A SOLICITATION NOR AN OFFER TO BUY/SELL FUTURES, OPTIONS, STOCKS, OR CURRENCIES. NO REPRESENTATION IS BEING MADE THAT ANY ACCOUNT WILL OR IS LIKELY TO ACHIEVE PROFITS OR LOSSES SIMILAR TO THOSE DISCUSSED ON THIS ARTICLE OR WEBSITE. THE PAST PERFORMANCE OF ANY TRADING SYSTEM OR METHODOLOGY IS NOT NECESSARILY INDICATIVE OF FUTURE RESULTS. CFTC RULE 4.41 – HYPOTHETICAL OR SIMULATED PERFORMANCE RESULTS HAVE CERTAIN LIMITATIONS. UNLIKE AN ACTUAL PERFORMANCE RECORD, SIMULATED RESULTS DO NOT REPRESENT ACTUAL TRADING. ALSO, SINCE THE TRADES HAVE NOT BEEN EXECUTED, THE RESULTS MAY HAVE UNDER-OR-OVER COMPENSATED FOR THE IMPACT, IF ANY, OF CERTAIN MARKET FACTORS, SUCH AS LACK OF LIQUIDITY. SIMULATED TRADING PROGRAMS IN GENERAL ARE ALSO SUBJECT TO THE FACT THAT THEY ARE DESIGNED WITH THE BENEFIT OF HINDSIGHT. NO REPRESENTATION IS BEING MADE THAT ANY ACCOUNT WILL OR IS LIKELY TO ACHIEVE PROFIT OR LOSSES SIMILAR TO THOSE SHOWN.

