
Over the past twenty months we have been writing about how the Fed’s Printing Press would result in huge inflationary price increases. Yesterday the headline news broke that the Consumer Price Index rose at 6.2% for October which is the largest increase in 31 years. Ouch!
You can click on any of these headline graphics to read a detailed analysis of this news story.
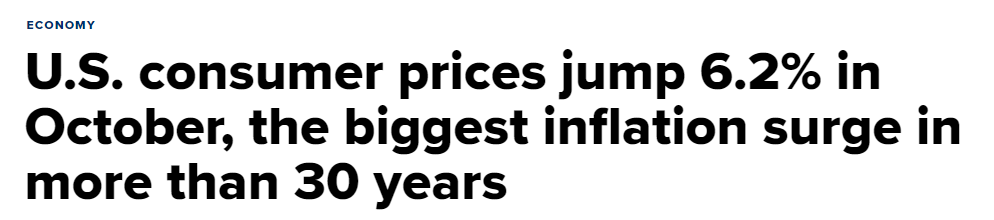
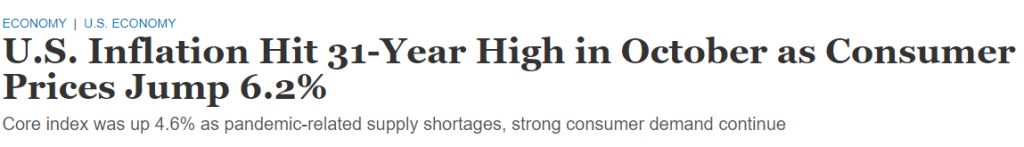
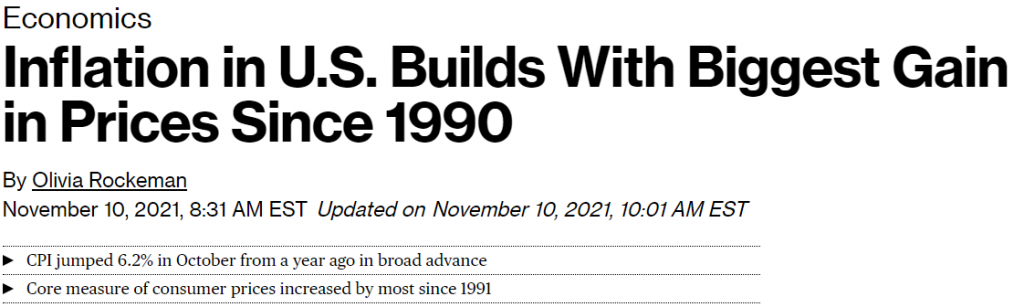

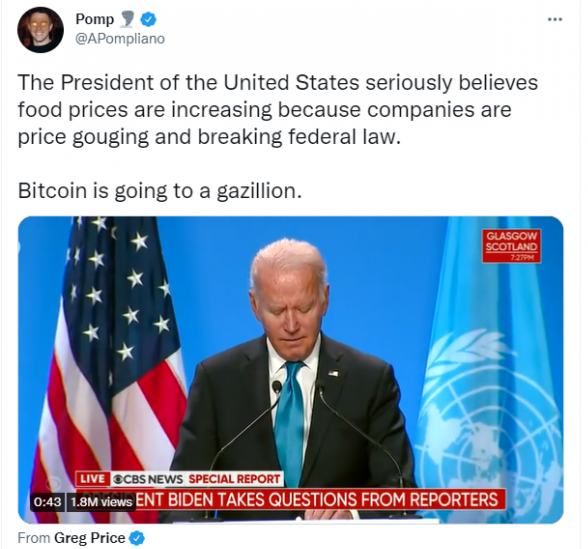
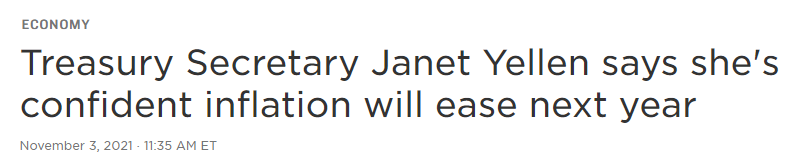
The reason I have posted four headlines from leading financial publications in this article is that this occurrence portrays the dilemma that all traders go through when analyzing and trading the markets.
Early in the ‘printing press expansion’ we were told that inflation would not occur.
Midway in the ‘printing press expansion’ we were then told by all the large monetary authorities that if inflation occurred it would be transitory.
Now that “it” (inflation) is at 31-year highs President Biden is announcing that it occurred because vendors are price gouging and violating Federal laws and Treasury Secretary Yellen is promising to get it under control by mid-2022.
Not to take potshots at politicians and monetary authorities – that would be too easy. The point is oftentimes what passes for fact in the financial media is a well-polished “untruth.” Anyone who is vested in the financial markets is required to make sense of these statements and determine what is the best move forward for your savings and investment portfolio. For the last 18 months I have written exhaustively that the current economic environment throughout the world is that savers can’t save. Inflation is raging much higher than what government debt instruments are yielding. So, the result is a devaluation of the purchasing power of the currency, and it requires more units of currency to purchase the same amount of goods and services.
Yesterday’s CPI number confirmed this basic thesis.
The Yield on the 10 Year Treasury Note is 1.56%
Inflation yesterday printed at 6.2%. That is the official rate. I can assure you the unofficial rate is substantially higher.
The difference between these two numbers is the real rate of return.
Currently, this value is NEGATIVE 4.64. What this means is that someone who is trying to save money by investing in the full faith and credit of the U.S. Government will lose 4.64% per year.
What a deal!
A brief history lesson is in order.
Forty years ago, the Fed Chairman, Paul Volcker choked off 14.8% inflation by raising the Fed Funds rate as high as 20%. Chairman Volcker was very aware of the problems created by having a negative real rate of return on US Debt instruments. His move hurt the economy bad, but it got inflation under control. The economy went into a severe recession. At that time inflation was running at 12.2%. When all was said and done Volcker forced the Fed Funds rate up five full percentage points higher than the inflation rate.
This historic reference is completely opposite to what the Fed is doing today.
I wrote about this in last week’s blog post.
“Savers can’t save.
Yet, we have government officials and monetary authorities around the world telling us that interest rates need to remain near zero to promote growth in the economy.
How can an economy grow if savings are penalized?
Pension funds need 7% yields to remain viable and fulfill their obligations to retirees. Please show me how a pension fund can earn a 7% yield when they are required to invest in government bonds and their real rate of return is negative?Follow the breadcrumb trail further and you will see that low interest rates are the culprit not the solution. Any money you have, you can choose where to allocate it. Will
you loan it to the government and guarantee yourself an annualized loss? Or will you choose another option?
Regardless how you look at this problem it comes back to the simple reality of if savers can’t save, how is this good?
Unfortunately, the messaging by the Fed and government officials attempts to obscure the simple reality, that savers can’t save, because the currency is being devalued right before our very eyes.
Even worse, no solutions are presented!
Why?
More than HALF of the US sovereign debt will mature and will need to be refinanced within the next three years. The average interest rate on US Debt is 1.38%! Even with this historically low rate the Treasury still has $305 billion in obligations just to make interest payments. So just imagine what might happen if interest rates were to rise just to match the published inflation figures.
Suddenly the annual interest bill rises 350% to more than $1.2 TRILLION just to pay interest.”
The long and short of it all is inflation is a double-edged sword.
As a consumer you lose every time you purchase something you notice that prices are increasing.
As a trader, it is the most exciting thing that can ever happen, because life changing income can be created with these dramatic price increases.
Directly from the CPI report, over the last year:
Gasoline prices are up 49.6%
Gas Utilities + 28.1%
Used Cars + 26.4%
Meats/Fish/Eggs +11.9%
New Cars + 9.8%
Electricity +6.5%
Transportation +4.5%
Apparel +4.3%
Shelter + 3.5%
As a consumer, you face an onslaught of decreasing purchasing power.
As a trader, consider the following:
Stocks are at all-time highs.
Home prices are at all-time highs.
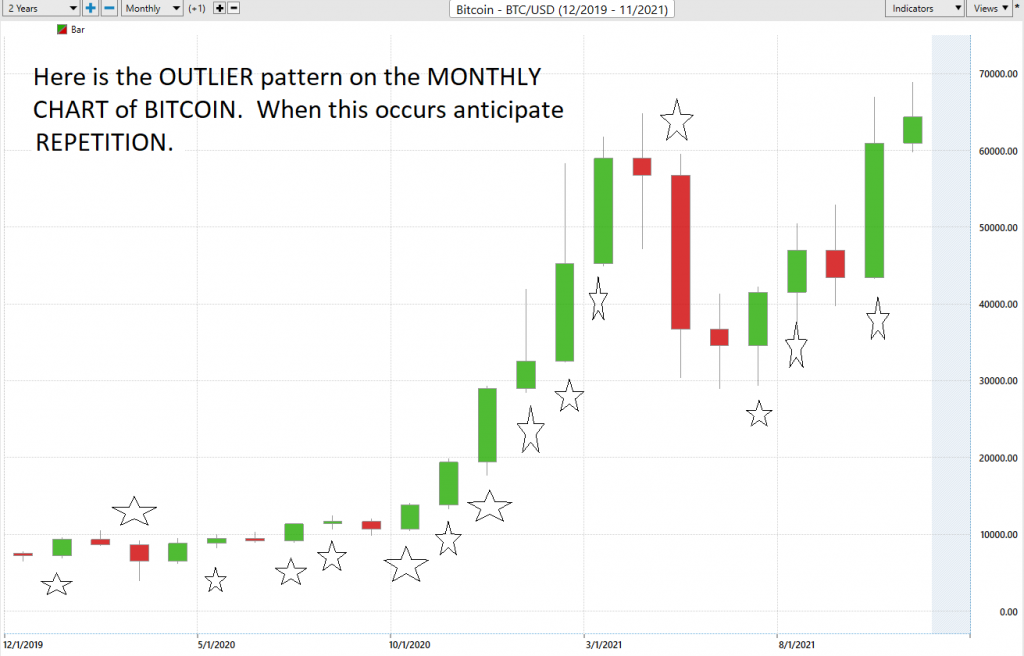
Bitcoin just made new all-time highs.
Crude Oil is up 109% year over year.
Heating Oil is up 106% year over year.
Gasoline is Up 105% year over year.
Coffee is up 88% year over year.
Cotton is up 71% year over year.
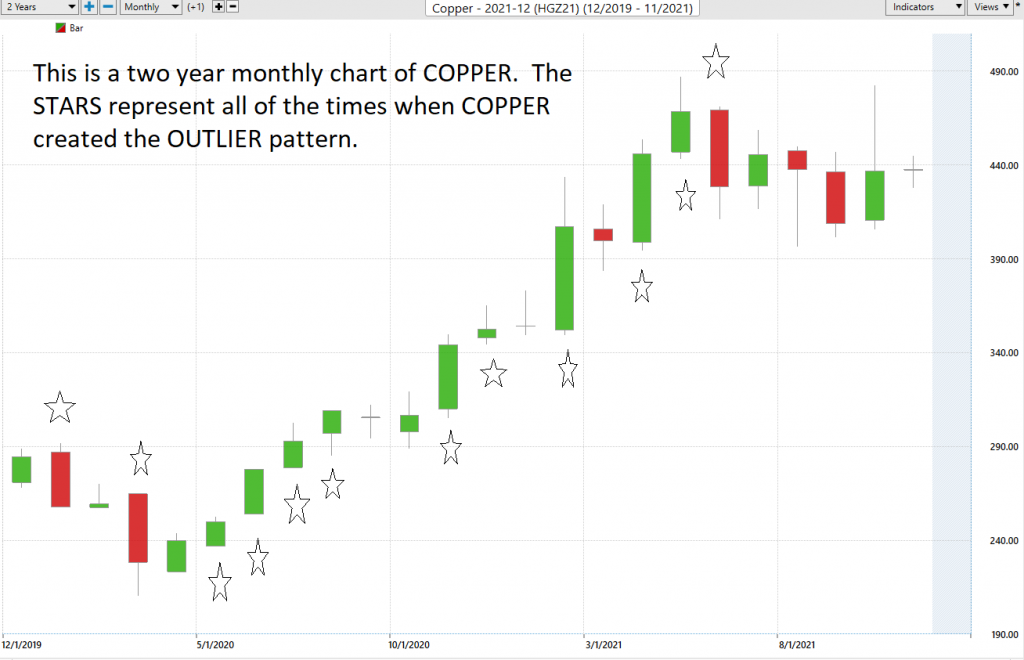
Copper is Up 39% year over year.
Aluminum is up 37% year over year.
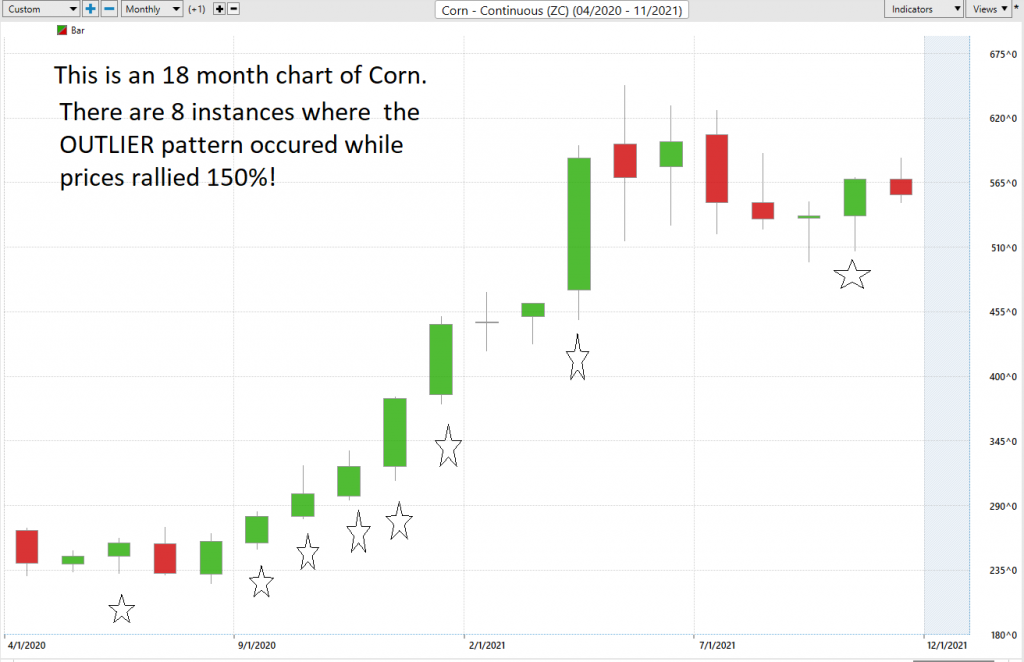
Corn is up 36% year over year.
Sugar is up 34% year over year.
Wheat is up 30% year over year.
Lumber is up 15% year over year.
Wages are at all-time highs.
Job opening are at all-time highs.
Inflation at the highest in 31 years.
And Gold is down 1% year over year. (That is out of the ordinary!)
And finally, the Fed is saying we need interest rates at 0% to promote growth so that the government can borrow more.
Everything UP (except Gold)! Pretty incredible – considering the reality, that the monetary authorities assured us that when printing 6 trillion in new stimulus this would NOT occur. This is normally the part of the story when selective amnesia occurs and we all forget that assurances that inflation would not occur, and if it did it would be transitory.
As a trader, my opinion is this is the greatest time ever to be alive.
I am going to urge that traders review the article I wrote a few weeks ago titled:
“My Favorite Candlestick Pattern and Why It Works!
Inflation means rising prices. Rising prices means the opportunity to successfully speculate. If inflation is rising at 6.2% you need to make that much just to break even.
In that article I stated there is a lot of unnecessary complexity revolving around charts. Many very successful traders literally use long term charts to identify and isolate trends by looking for price to go beyond the previous price extreme.
There are only five conditions that a market can be in at any given time.
- A market can close above the previous bars high.
- A market can close above the previous bars close.
- A market can be unchanged.
- A market can close below the previous bars close.
- A market can close below the previous bars low.
That is, it!
Great trading opportunities come to pass when you look at a long-term chart and recognize it has closed above or below the previous extreme price.
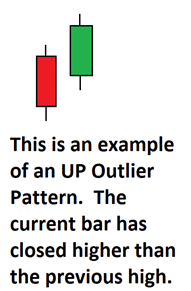
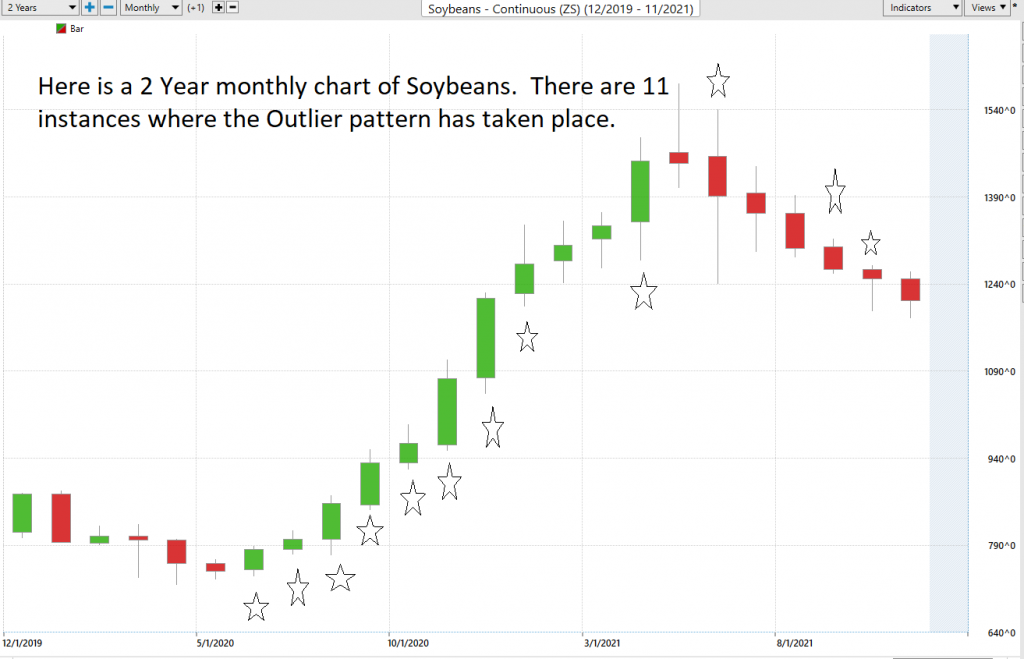
I refer to this as the OUTLIER pattern.
- In an UPTREND we want to look at the WEEKLY or Monthly charts and spot the times that price closed above the previous bars high
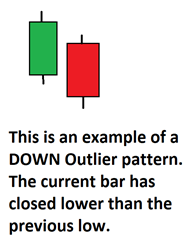
- In a downtrend we want to look at the weekly or monthly charts and find all of the times when price has closed below the previous bars low price
The best opportunities in trading occur when we spot these OUTLIERS early and recognize that they are the beginning definition of a powerful TREND.
Spotting the OUTLIER allows us to Drill DOWN further within the market and fine-tune the entry and exit opportunities.
The inverse is also true, when price is trading below the previous low, it is saying that supply is greater than demand and the trend is weak.
In other words, the OUTLIER pattern is where the trend “IS.” This is very true particularly when you study the weekly and monthly charts. These are exactly the types of trends that we as traders are looking for!
Unfortunately, many new traders obsess over the correct classification of the candlestick pattern name.
The only thing that you should obsess about is where are the best trends to trade. In an inflationary environment these trends are literally everywhere!
Let’s look at some Monthly Charts in the Commodities markets and look for the OUTLIER pattern.
I will place STARS on the chart for your review and you will be able to conclude how valuable this pattern is to traders in helping to define the trend.
When you locate the OUTLIER pattern simply observe whether price continued to push in that direction for the next 1-3 bars. Since these are monthly or weekly charts, you are witnessing extreme prices become more extreme over a longer-term horizon. Literally, this is the definition of INFLATION.
Here is a monthly chart of Cotton over the last two years:
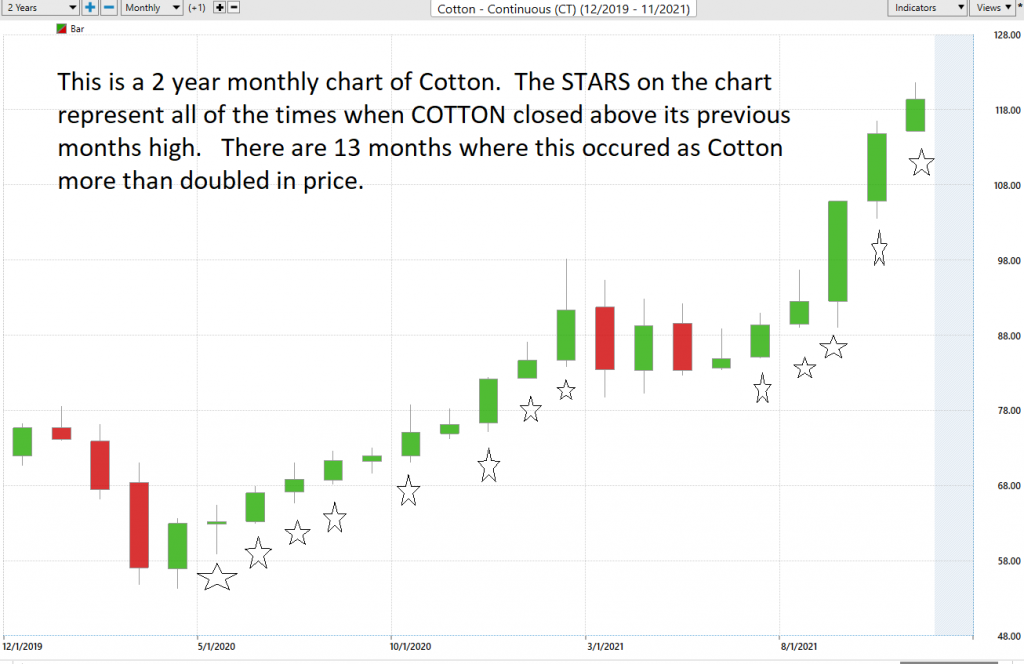
All that the OUTLIER pattern is telling us is that prices are beyond the previous extreme. That is exactly the condition that savvy trend traders are looking for!
Next let’s look at a handful or agricultural markets.
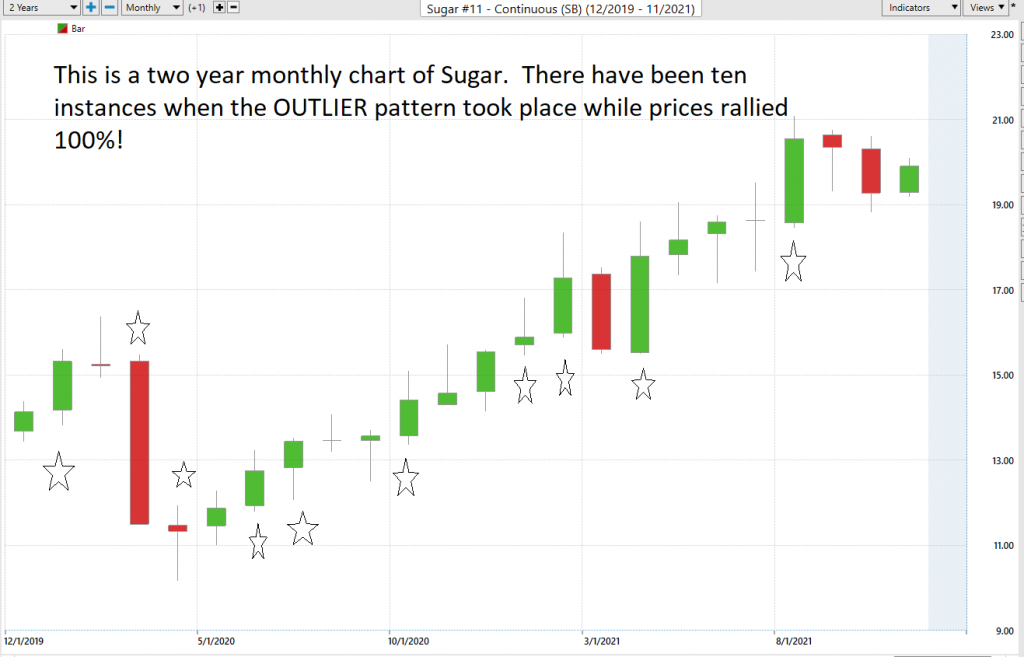
Here is a Weekly chart of SUGAR over the past year.
Sugar prices in the futures markets are up 30% in the past year. That amounts to over $5,150 gain per futures contract. Margin requirements on Sugar is roughly $1,600 per contract.
The Outlier pattern can be applied to the financial complex as well.
What you would expect during an inflationary crisis worldwide is that the U.S. Dollar, the worlds reserve currency would benefit as traders, investors and citizens run to find a safe haven asset.
Over the last 18 months, the U.S. Dollar is UP 5%.
This is a weekly chart of the U.S. Dollar over the last 18 months.
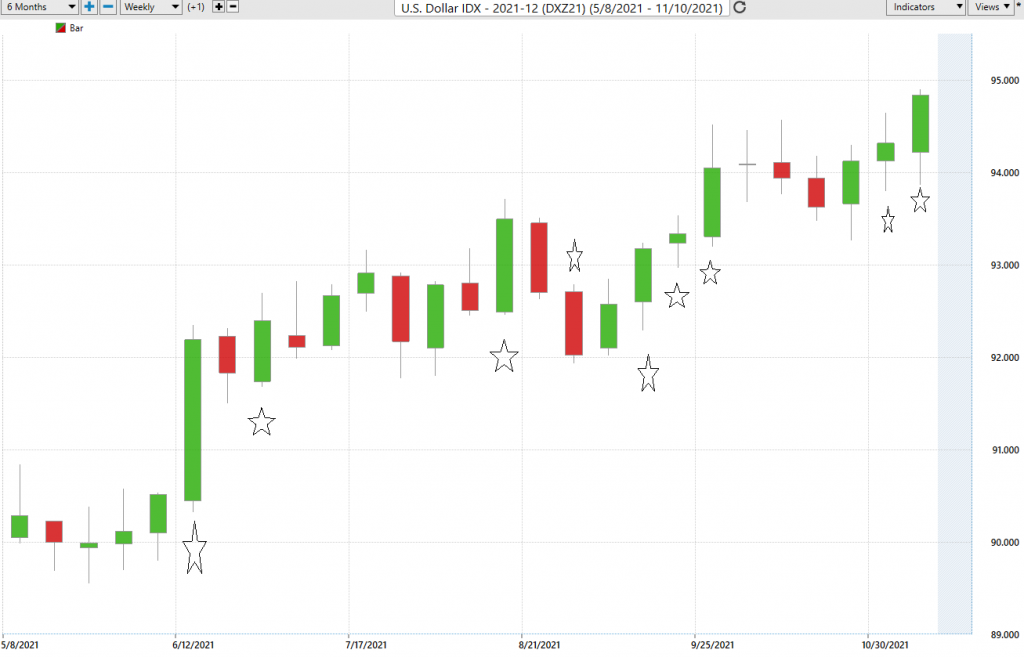
You can QUICKLY see the BIG PICTURE analysis with this OUTLIER pattern.
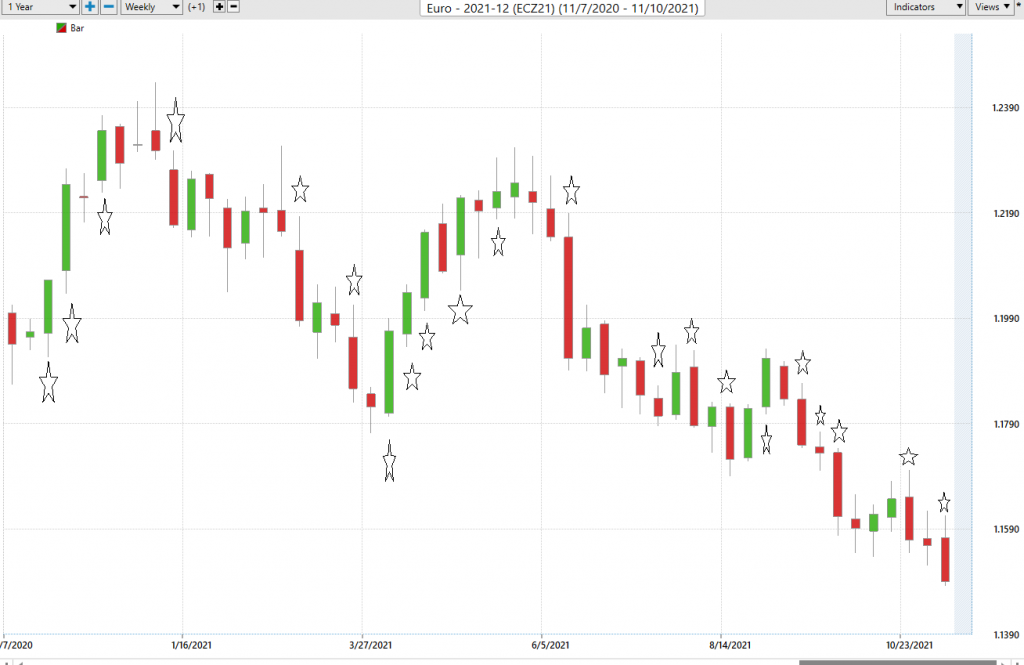
Here is the pattern applied to the EURO market. The outlier patterns works because the very definition of a TREND is REPITITION. We clearly see more extreme prices occurring.
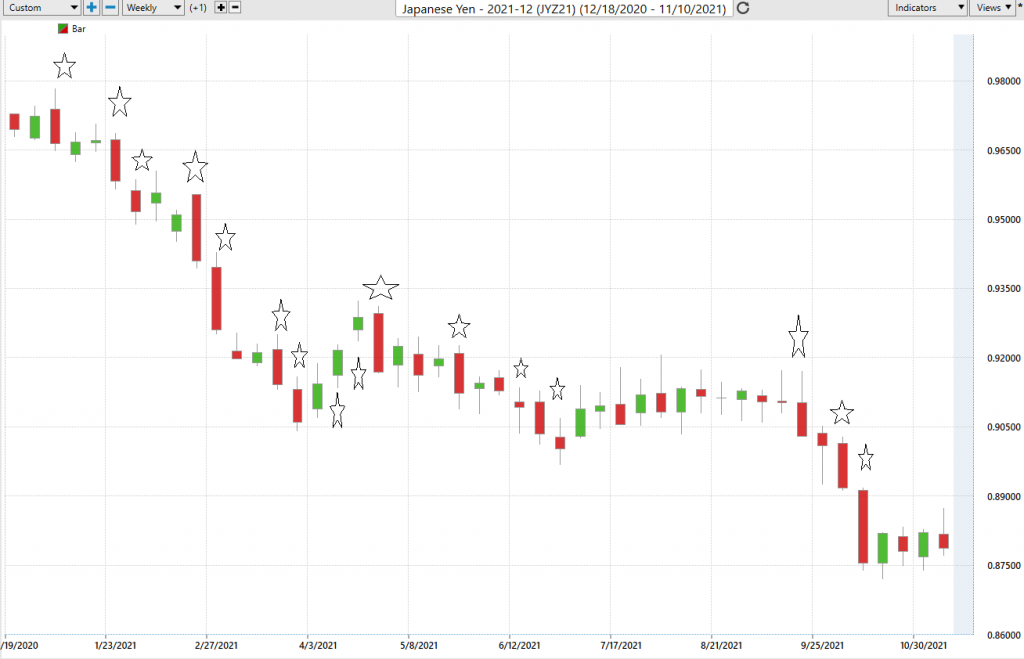
Here is the Japanese Yen. Notice how when the outlier pattern occurs on this weekly chart and the future “TENDENCY” is to repeat in the direction of the extreme.
You can begin to appreciate the opportunity that exists in inflationary markets today.
Politicians and monetary authorities since the beginning time always tell use the same playbook when it comes to dealing with national debt. Currently the U.S. is almost $29 trillion in debt, and we do not have the capacity or wherewithal to repay that obligation. So, the solution is to INFLATE the money supply. The result is higher prices on everything across the board and a currency that is being devalued in plain sight.
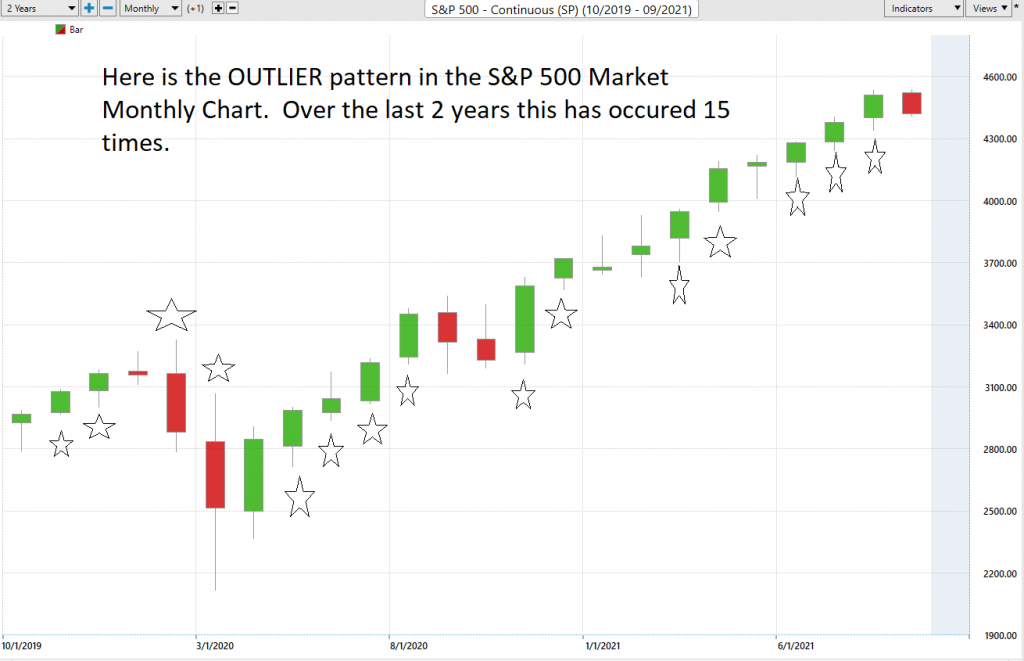
Yes, this even works in stocks. Here is the OUTLIER CHART on the S&P 500 Index:
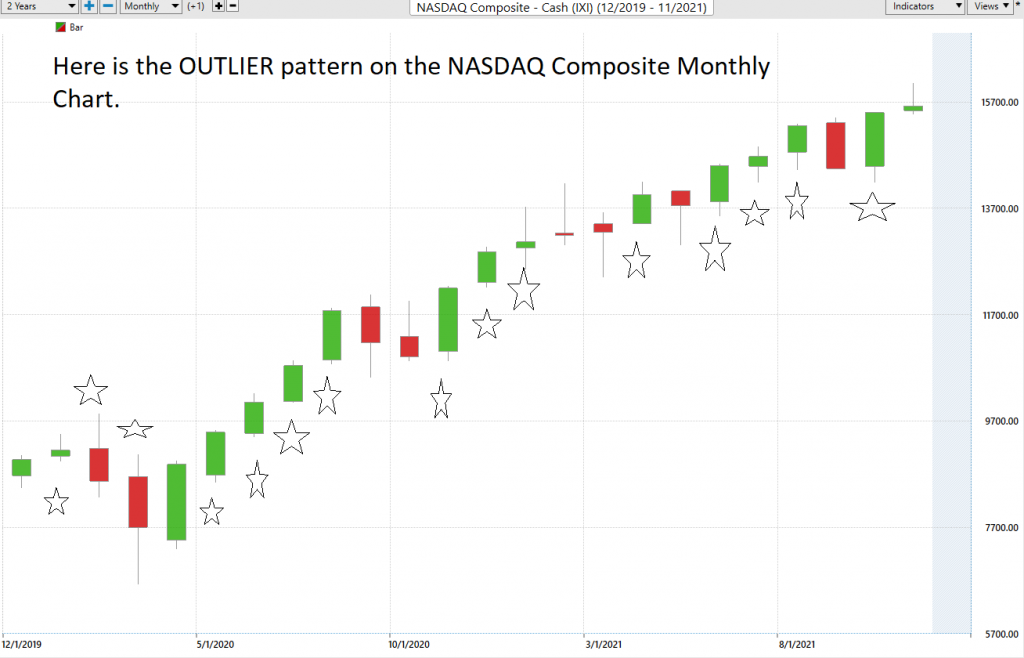
Here is the NASDAQ:
How do you define OPPORTUNITY when trading inflationary markets?
How do you go about making sense of it all?
If you study the headlines, you’ll mostly find that the journalists, politicians, and monetary authorities are wrong.
When you cross reference this OUTLIER pattern with artificial intelligence some real magic and wealth creation can occur.
The beauty of neural networks, artificial intelligence, and machine learning are they are fundamentally focused on pattern recognition to determine the best move forward. When these technologies flash a change in forecast – pay attention, it is newsworthy.
We often do not understand why something is occurring but that does not mean that we cannot take advantage of it.
Remember What’s Important.
Price is the only thing that matters when we are trading. It is what can make you wealthy or decimate your account. Everything else is just noise.
Are you capable of finding those markets with the best risk/reward ratios out of the thousands of trading opportunities that exist?
Knowledge.
Useful knowledge.
And its application is what A.I. delivers.
Isn’t that what we all want from the markets? Consistency.
So, imagine what might your portfolio would look like today had you applied artificial intelligence to it five years ago.
See for yourself how a machine-based learning software makes it easier to find statistically solid trends with less risk.
Most traditional indicators that traders use today were developed in the 1970’s and 1980’s. They are incapable of telling you what the market is going to do moving forward.
Once again, machine outperforms humanoid.
It’s important that you find out more and discover why artificial intelligence keeps traders on the right side of the trend at the right time.
Join us for a FREE, Live Training. We’ll show you at least three stocks that have been identified by the A.I. that are poised for big movement… and remember, movement of any kind is an opportunity!
Discover why artificial intelligence is the solution professional traders go-to for less risk, more rewards, and guaranteed peace of mind.
Visit with us and check out the A.I. at our Next Live Training.
It’s not magic. It’s machine learning.
Make it count.

IMPORTANT NOTICE!
THERE IS SUBSTANTIAL RISK OF LOSS ASSOCIATED WITH TRADING. ONLY RISK CAPITAL SHOULD BE USED TO TRADE. TRADING STOCKS, FUTURES, OPTIONS, FOREX, AND ETFs IS NOT SUITABLE FOR EVERYONE.
DISCLAIMER: STOCKS, FUTURES, OPTIONS, ETFs AND CURRENCY TRADING ALL HAVE LARGE POTENTIAL REWARDS, BUT THEY ALSO HAVE LARGE POTENTIAL RISK. YOU MUST BE AWARE OF THE RISKS AND BE WILLING TO ACCEPT THEM IN ORDER TO INVEST IN THESE MARKETS. DON’T TRADE WITH MONEY YOU CAN’T AFFORD TO LOSE. THIS ARTICLE AND WEBSITE IS NEITHER A SOLICITATION NOR AN OFFER TO BUY/SELL FUTURES, OPTIONS, STOCKS, OR CURRENCIES. NO REPRESENTATION IS BEING MADE THAT ANY ACCOUNT WILL OR IS LIKELY TO ACHIEVE PROFITS OR LOSSES SIMILAR TO THOSE DISCUSSED ON THIS ARTICLE OR WEBSITE. THE PAST PERFORMANCE OF ANY TRADING SYSTEM OR METHODOLOGY IS NOT NECESSARILY INDICATIVE OF FUTURE RESULTS. CFTC RULE 4.41 – HYPOTHETICAL OR SIMULATED PERFORMANCE RESULTS HAVE CERTAIN LIMITATIONS. UNLIKE AN ACTUAL PERFORMANCE RECORD, SIMULATED RESULTS DO NOT REPRESENT ACTUAL TRADING. ALSO, SINCE THE TRADES HAVE NOT BEEN EXECUTED, THE RESULTS MAY HAVE UNDER-OR-OVER COMPENSATED FOR THE IMPACT, IF ANY, OF CERTAIN MARKET FACTORS, SUCH AS LACK OF LIQUIDITY. SIMULATED TRADING PROGRAMS IN GENERAL ARE ALSO SUBJECT TO THE FACT THAT THEY ARE DESIGNED WITH THE BENEFIT OF HINDSIGHT. NO REPRESENTATION IS BEING MADE THAT ANY ACCOUNT WILL OR IS LIKELY TO ACHIEVE PROFIT OR LOSSES SIMILAR TO THOSE SHOWN.

