
In March 2021, Vantagepoint A.I. released the Cybersecurity Sector for our software users after extensive testing. For stocks we forecast to end up in our database, the Vantagepoint A.I. software must have at least a 70% effectiveness factor in predicting future trends. Cybersecurity has been headline news throughout the past year as many, major companies and the energy grid in the Southwest have faced ransomware attacks.
This week in the Vantagepoint A.I. Stock of the Week Analysis will breakdown the Cybersecurity sector again as we feel this niche still holds tremendous promise and opportunity.
How much do you know about “Ransomware?”
Yesterday the Department of Justice, the State Department, and the Treasury Department announced indictments against two foreign hackers for cyberattacks on U.S. companies last summer. The government announced sanctions against the individuals, one of whom was arrested in Poland; and they seized $6.1 million in assets. The U.S. Treasury noted that ransomware attacks cost the U.S. almost $600 million in the first six months of 2021 and disrupt business and public safety.
If you are like most people, you know what “ransomware” is, and you hope you never experience it. But it’s important to open your mind to the possibilities of “it” being one of the greatest trading opportunities of this generation.
Why?
Because everyone who has heard about “ransomware” will go to great lengths and do everything possible to prevent it from happening to them. Cybersecurity is the practice of protecting systems, networks, and programs from digital attacks. These cyberattacks are usually aimed at accessing, changing, or destroying sensitive information; extorting money from users; or interrupting normal business processes.
Ransomware is a form of malware that digitally steals and encrypts or prevents a victim’s files on their computer or network. The attacker then demands a ransom payment from the victim to restore access to their own data upon payment. Users are shown instructions for how to pay a fee to get the decryption key. The costs can range from a few hundred dollars to millions, payable to cybercriminals in cryptocurrency.
This form of cyberattack has occurred on a large scale many times over the last decade. Hackers exploit vulnerabilities in software system updates, using the information to develop their target population to exploit.
In 2020, the FBI’s Internet Crime Complaint Center (IC3) estimated there were an estimated 184 million ransomware attacks last year alone.
Ransomware was originally created to target individuals, who still comprise most attacks today. However, Ransomware has also become extremely sophisticated and can target entire corporate networks.
In a nutshell, ransomware is big business.
Ransomware attacks cause downtime, data loss, possible intellectual property theft, and in certain industries an attack is considered a data breach.
But let’s also look at psychologically how big this problem is.
How much certainty do you have now that your work, or home computer have zero ransomware threats on them?
Even if you are a cybersecurity expert and are running an advanced malware program, you will quickly understand how difficult it is to answer that question.
You need to cast the security net extremely wide and deep to protect either yourself and/or your company.
You also need to take online viruses, phishing schemes, social engineering due to ignorance and software vulnerabilities into account. Have you ever thought about how much damage one person can inadvertently do to a company at the touch of a button? Suddenly, human error and the huge problem it presents for businesses come into sharp, painful focus.
This is where cybersecurity becomes so important!
Today, almost everything that you have is vulnerable if you have it stored in a digital format.
Back in March 2021, the artificial intelligence caught the entire Cybersecurity sector before it made a gargantuan move. We will be studying the Global Cybersecurity ETF ($BUG). Global X Cybersecurity ETF’s market cap is $1.12B and has 32,290,000 shares outstanding.
The major components of this ETF are:
- Zscaler, Inc.
- Fortinet, Inc.
- Palo Alto Networks, Inc.
- CrowdStrike Holdings, Inc. Class A 6.82%
- Rapid7 Inc.
- Okta, Inc. Class A 5.07%
- Varonis Systems, Inc.
In this weekly stock study, we will look at and analyze the following indicators and metrics as our guidelines:
- 52-week high and low boundaries
- Best Case – Worst Case Analysis
- Vantagepoint A.I. Forecast (Predictive Blue Line)
- Neural Network Forecast
- Daily Range Forecast
- Intermarket Analysis
- Our trading suggestion
We only look at things like earnings or fundamental cash flow valuations to better understand the financial landscape that a company is operating under. We encourage you to study the individual components and you will find that their price action mimics the…
Analysts Ratings
Analysts do not provide price projections on ETFs since the Exchange Traded Fund is a conglomerate of many companies in the same niche. What I chose to do in this regard is to look at the top7 holdings withing the $BUG ETF and build a simple table which gives us the performance metrics that we normally strive for whenever we do a stock study.
In this table you can see that the TOP 7 Cybersecurity Holding in $BUG are up on average 124% year over year and that analysts’ high estimates on these stocks are still 23.7% higher than their most recent close.
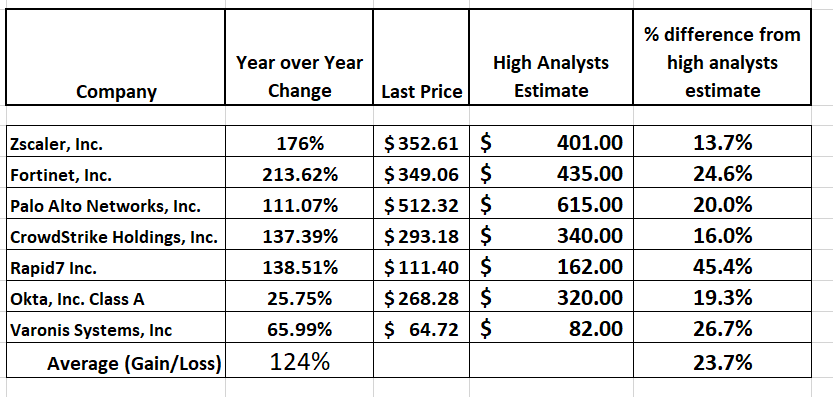
I find this bullishness aligned very much with my own perspective that the Cybersecurity sector is ripe for more gains. With this performance over the past year at present it is considered overvalued.
52-week High-Low Chart
Over the last 52 weeks $BUG has traded as high as $35.10 and as low as $20.53. This provides us with an annual trading range of $14.67. When we divide this metric by 52 weeks, we can determine that the average weekly trading range for $BUG is $.27. What we often like to do as well is divide the annual trading range ($14.67) by the current price ($35.10) to provide us with a very basic and generic calculation of how the annualized volatility for $BUG, which is currently 41.7%.
We refer to these as the commonsense metrics which we use as baseline measurements of understanding normal value. When using artificial intelligence, we look to amplify our returns based upon these baseline measurements.
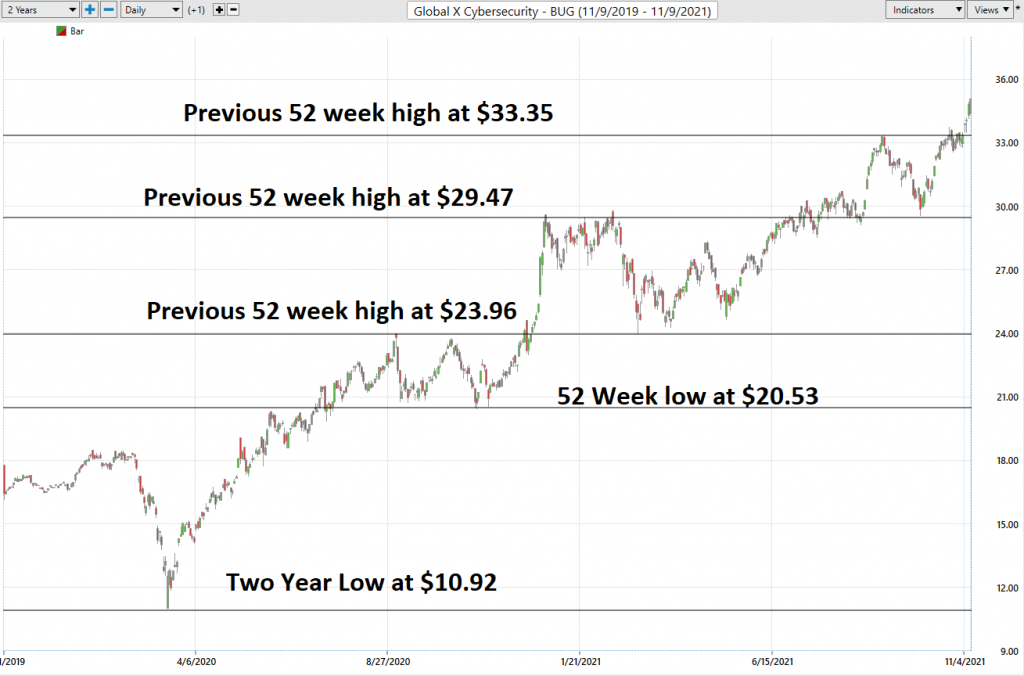
We always pay attention to where we are in relation to the 52-week trading range. It is very common to see the 52-week high provide very strong resistance to the market until it is breached. Often when the 52-week high is breached we will see the stock price explode higher very quickly over a very short period. The 52 Week boundaries are markers that we always urge traders to pay attention to.
$BUG has broken through to New All Time Highs which lends itself to great optimism now. We need to tame that optimism and look at all the drawdowns and pullbacks it has experienced in the past year,
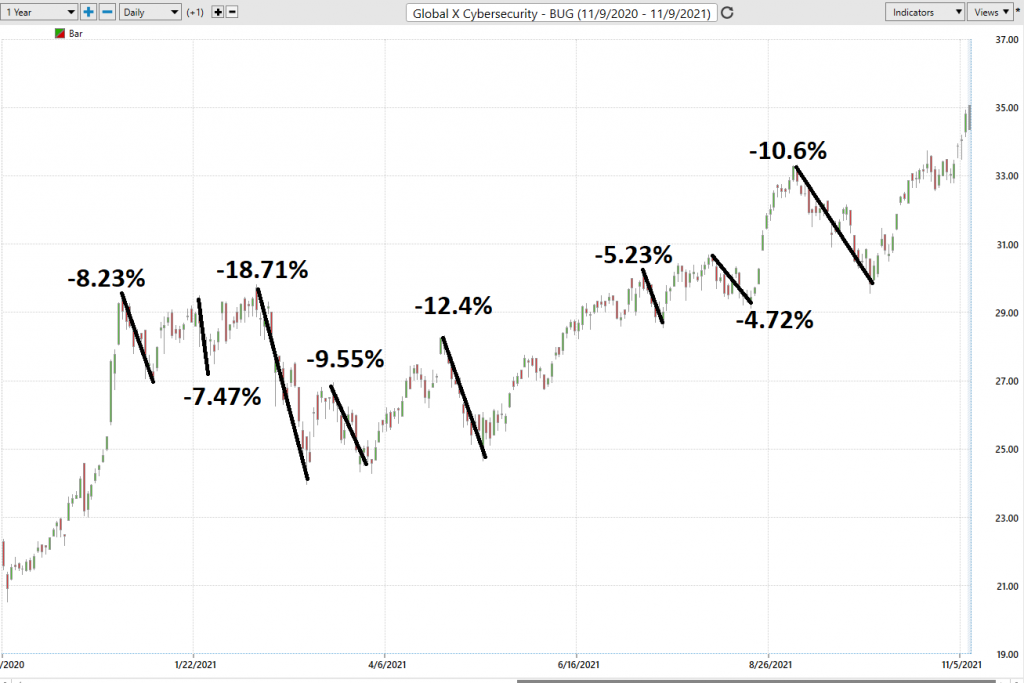
Best Case – Worst Case Scenarios
When we study the long term 52-week chart we can look at the best case and worst-case scenarios just to get an eyeball perspective of the risk and volatility of this asset. This is worth doing anytime you invest or trade to monetarily understand what the potential risks and rewards have been over the past year.
This simple practical analysis reveals what the realistic volatility of $BUG has been over the past year.
Over the last 52 weeks $BUG has appreciated 66%.
However, you can see that it has had numerous sharp pullbacks. Its largest pullback from a peak was $18.71. By completing this very simple drawdown analysis you can get a very realistic idea of what the volatility of this asset is in comparison to the broader stock market indexes.
What we can also immediately observe is that anytime this asset drops 9% or more from a recent peak, you should put it on your trading radar and wait for further guidance from the artificial intelligence.
Next, we compare the performance of $BUG to the broader stock market indexes.
$BUG + 66.7%
S&P 500 Index +32.15%
Dow Jones Industrials +23.45%
NASDAQ +65.82%
Russell 1000 Index +34.19%
So, in $BUG we have an asset which has outperformed the broader stock market indexes by a roughly a factor of 2 to 1. It also has had more downside volatility in comparison.
The Vantagepoint A.I. Analysis
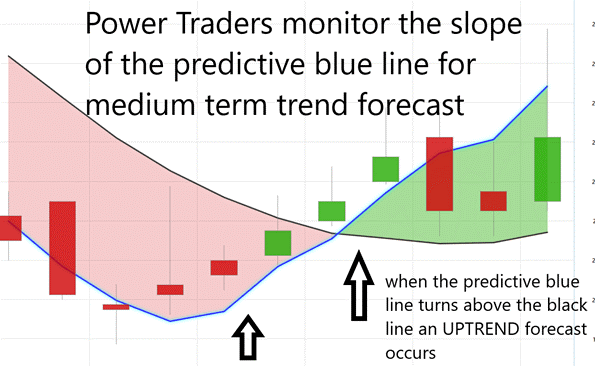
Using VantagePoint Software and the artificial intelligence, traders are alerted to trend forecasts by monitoring the slope of the predictive blue line. The black line is a simple 10 day moving average of price which simply tells you what has occurred in the market. The predictive blue line also acts as value zone where in uptrends traders try to purchase the asset at or below the blue line.
In studying the chart above pay close attention to the relationship between the black line and predictive blue line. The black line is just a simple 10 day moving average. It is calculated by taking the closing prices of the last 10 days and dividing that sum by 10. All that the black line tells you is what has occurred. It tells you where prices have been and what the average price over the last ten days is.
The predictive blue line, on the other hand utilizes that Vantagepoint patented Neural Network and Intermarket Analysis to arrive at its value. It looks at the strongest price drivers of an asset through artificial intelligence and statistical correlations to determine its value.
We will zoom in on a smaller time frame of the last six months. In studying the chart below pay close attention to the slope of the blue line.
The predictive blue line utilizes that Vantagepoint patented Neural Network and Intermarket Analysis to arrive at its value. It looks at the strongest price drivers of an asset through artificial intelligence and statistical correlations to determine its value.
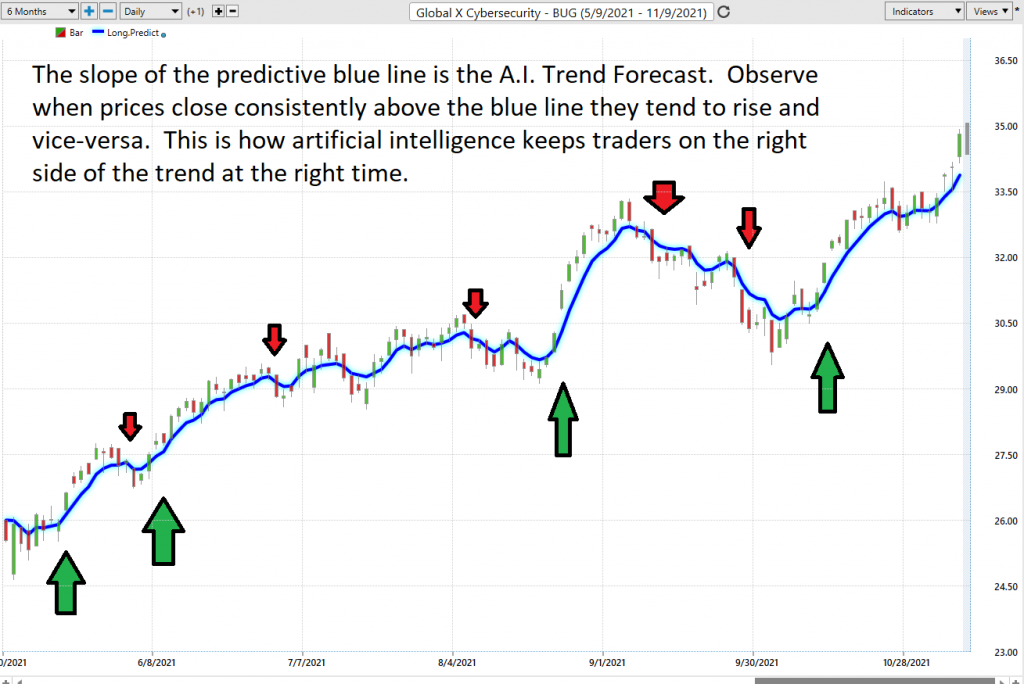
Whenever we see the predictive blue line slope higher, we are presented with an UP-forecast entry opportunity. This is what occurred 4 times in the last six months.
Power traders use the predictive blue line in helping to determine both the value zone as well as the trend direction. Pullbacks to or below the predictive blue line present buying opportunities at or below the value zone.
Likewise, the red arrows on the chart above highlight the areas where the artificial intelligence was forecasting weaker prices.
Here is what the chart of complete a.i. forecast looked like for the past two months.
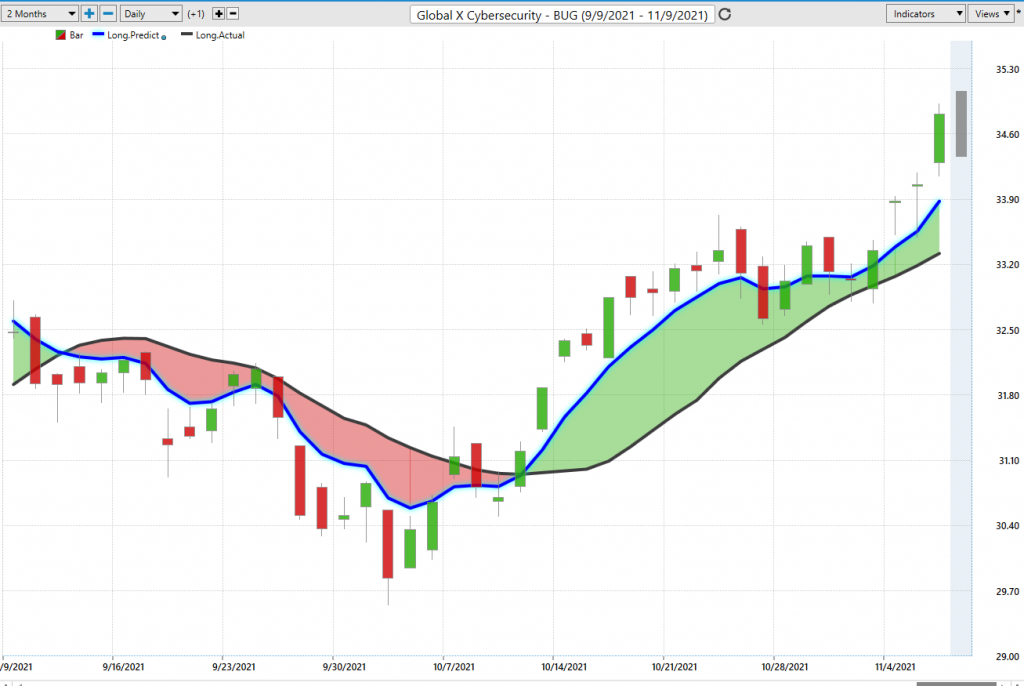
As you can see from the chart above there is no guesswork involved. The trends are very clearly delineated.
Fine Tuning Entries with The Neural Net Indicator
At the bottom of the chart is the Neural Network Indicator which predicts future strength and/or weakness in the market. When the Neural Net Indicator is green it communicates strength. When the Neural Net is Red it is forecasting short term weakness in the market.
We advocate that Power Traders cross reference the chart with the predictive blue line and neural network indicator to create optimal entry and exit points.
A Neural Net is a computational learning system that uses a network of functions to understand and translate massive amounts of data into a desired output, consistently monitoring itself and improving its performance.
Power Traders are always looking to apply both the neural network and A.I. to the markets to find statistically sound trading opportunities. We refer to this as a “double confirmation” setup and look for the predictive blue line to slope higher and to be confirmed by the Neural Net at the bottom of the chart.
We advise Power Traders to cross reference the predictive blue line with the Neural Net for the best entry opportunities. Observe how the slope of the predictive blue line has remained positive from the time earnings were announced.
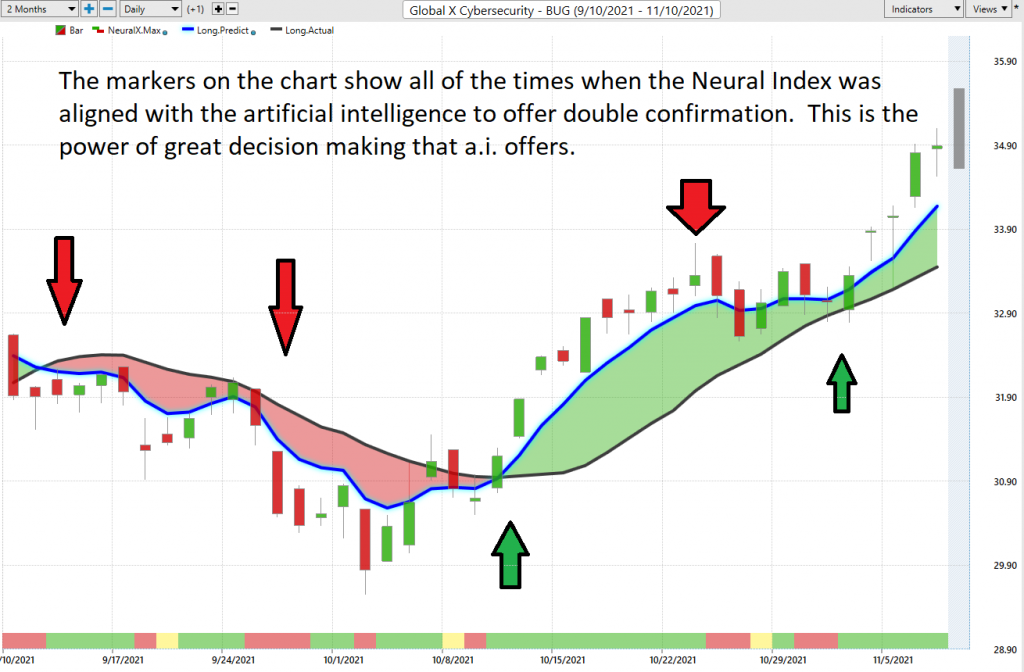
You can see in the chart above how the Neural Net offered several opportunities of double confirmation to Power Traders, when the predictive blue line and the Neural Net aligned with the same forecast. These instances provide very high probability trading opportunities to exploit the trend.
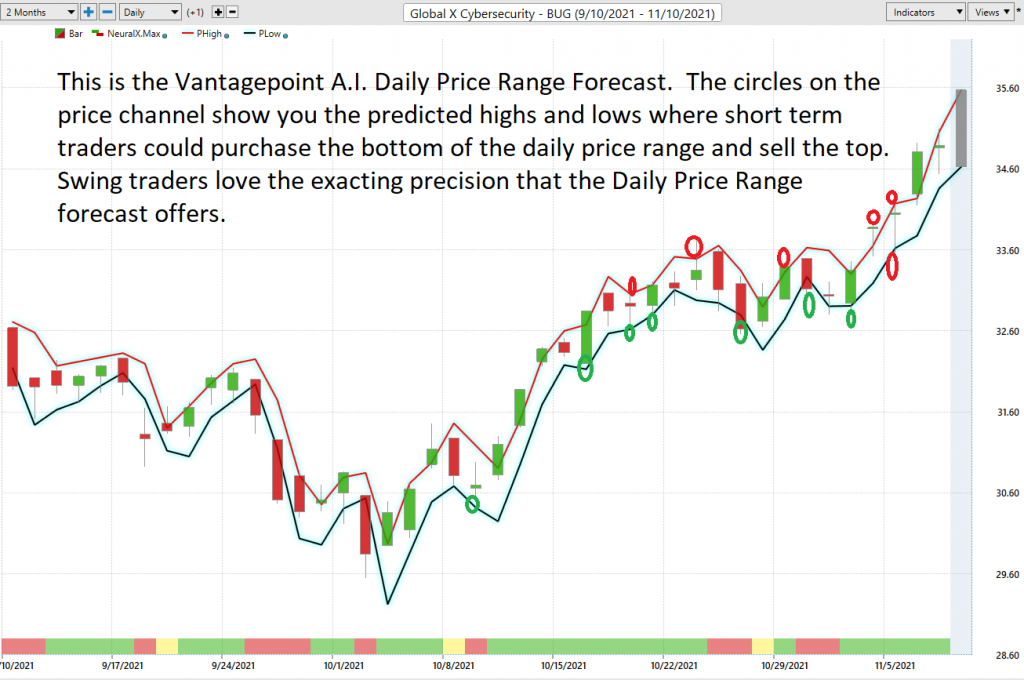
VantagePoint Software Daily Price Range Prediction
One of the powerful features in the Vantagepoint A.I. Software which Power Traders use daily is the Daily Price Range prediction forecast.
This forecast is what permits Power Traders to truly fine tune their entries and exits into the market.
Every day traders need to decide where to get in and whether they should get out. The Vantagepoint A.I. Daily Price Range forecast helps provide these answers with exacting precision.
Here is the price chart of $BUG during the most recent runup featuring the Daily Price Range forecast and the Neural Net Indicator.
Intermarket Analysis
Why is $BUG up 66% year over year?
Ask that question to 10 Wall Street Analysts and you will get 10 different answers.
The challenge for all investors and traders is differentiating between opinion and fact.
What makes the Vantagepoint Software truly unique is its ability to perform Intermarket analysis and to locate those assets which are most interconnected that are responsible for driving the price of $ANET higher or lower.
Studying the charts can always provide objective realities in terms of locating support and resistance levels which become very clear on a chart. But we live in a global marketplace. Everything is interconnected. The billion-dollar question for traders is always what are the key drivers of price for the underlying asset that I am trading?
These intangibles are invisible to the naked eye yet show very high statistical correlations.
In $BUG we see a very strong and persistent correlation to Crude Oil, The Down Jones Index, S&P 500, Natural Gas. We can also see the other top performing ETF’s which have $BUG as a component. Scanning these intermarket relationships allows traders to see the statistically correlated assets that are responsible for driving $BUG’s price.
Small changes in Interest rates, Crude Oil Prices, and the Volatility of the dollar amongst thousands of other variables affect the decisions companies must make to survive in these very challenging times. Trying to determine what these factors are is one of the huge problems facing investors and traders.
There is great value to be had in studying and understanding the key drivers of $BUG price action.
Since Cybersecurity has been one of the hottest sectors in the broader market over the past year, Power Traders will often study the components of an ETF which are outperforming the ETF and discover that this is even a better way to exploit profit opportunities in a solid trend.
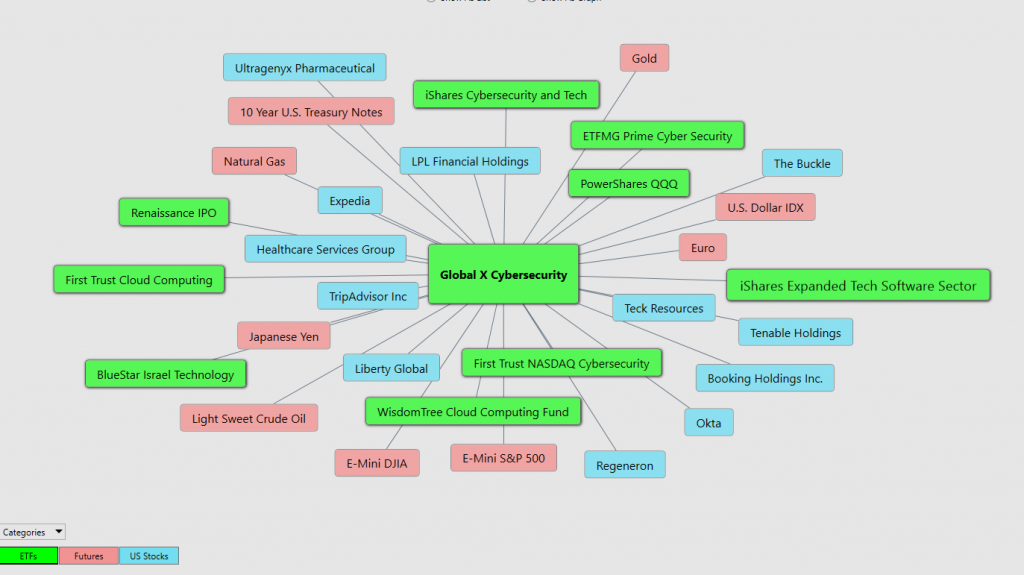
Here are 9 highly correlated ETF’s and their performance year over year for traders to evaluate.
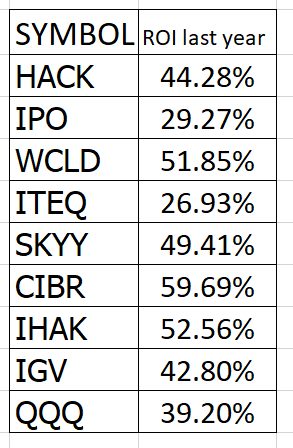
Notice how seven of the nine assets in the above list all dramatically outperformed the broader market indexes.
Our Trading Suggestion
We like the Cybersecurity sector not only because of its recent performance but also because it is headline news, and more and more companies are recognizing their responsibility in doing everything possible to eliminate digital vulnerabilities.
That being said, $BUG is at all time highs. The a.i. clearly has signaled the trend and momentum are all UP. Watch $BUG around these new all-time highs and tread carefully unless you are a seasoned trader with exceptional money management skills. The volatility in BUG is higher than the broader market, but then again so are the returns.
We are looking for sharp pullbacks of 8% to 10% within the next 30 days to get LONG BUG and rely upon the guidance of the artificial intelligence to do so.
For the immediate present, simply based upon its stellar performance this asset and sector should on your trading radar.
Vantagepoint Power Traders will continue to rely on the daily price range forecast to establish short-term trades.
We will reevaluate our opinions based upon all the tools that we discuss in this study.
- 52-week high and low boundaries
- Best Case – Worst Case Analysis
- Vantagepoint A.I. Forecast (Predictive Blue Line)
- Neural Network Forecast
- Daily Range Forecast
- Intermarket Analysis
Let’s Be Careful Out There!
Remember, It’s Not Magic.
It’s Machine Learning.

IMPORTANT NOTICE!
THERE IS SUBSTANTIAL RISK OF LOSS ASSOCIATED WITH TRADING. ONLY RISK CAPITAL SHOULD BE USED TO TRADE. TRADING STOCKS, FUTURES, OPTIONS, FOREX, AND ETFs IS NOT SUITABLE FOR EVERYONE.
DISCLAIMER: STOCKS, FUTURES, OPTIONS, ETFs AND CURRENCY TRADING ALL HAVE LARGE POTENTIAL REWARDS, BUT THEY ALSO HAVE LARGE POTENTIAL RISK. YOU MUST BE AWARE OF THE RISKS AND BE WILLING TO ACCEPT THEM IN ORDER TO INVEST IN THESE MARKETS. DON’T TRADE WITH MONEY YOU CAN’T AFFORD TO LOSE. THIS ARTICLE AND WEBSITE IS NEITHER A SOLICITATION NOR AN OFFER TO BUY/SELL FUTURES, OPTIONS, STOCKS, OR CURRENCIES. NO REPRESENTATION IS BEING MADE THAT ANY ACCOUNT WILL OR IS LIKELY TO ACHIEVE PROFITS OR LOSSES SIMILAR TO THOSE DISCUSSED ON THIS ARTICLE OR WEBSITE. THE PAST PERFORMANCE OF ANY TRADING SYSTEM OR METHODOLOGY IS NOT NECESSARILY INDICATIVE OF FUTURE RESULTS. CFTC RULE 4.41 – HYPOTHETICAL OR SIMULATED PERFORMANCE RESULTS HAVE CERTAIN LIMITATIONS. UNLIKE AN ACTUAL PERFORMANCE RECORD, SIMULATED RESULTS DO NOT REPRESENT ACTUAL TRADING. ALSO, SINCE THE TRADES HAVE NOT BEEN EXECUTED, THE RESULTS MAY HAVE UNDER-OR-OVER COMPENSATED FOR THE IMPACT, IF ANY, OF CERTAIN MARKET FACTORS, SUCH AS LACK OF LIQUIDITY. SIMULATED TRADING PROGRAMS IN GENERAL ARE ALSO SUBJECT TO THE FACT THAT THEY ARE DESIGNED WITH THE BENEFIT OF HINDSIGHT. NO REPRESENTATION IS BEING MADE THAT ANY ACCOUNT WILL OR IS LIKELY TO ACHIEVE PROFIT OR LOSSES SIMILAR TO THOSE SHOWN.

