

Over the past several months I have been paying close attention to the Real Estate market. Some of the activity is worth taking note of and applying that knowledge towards your trading portfolio.
What made me start analyzing Real Estate closely was that it had increased in price by around 28% over the past year. Homeowners yell ‘hooray’ when they discover this. However, it presents some structural issues that are starting to make people wonder if the bubble is starting to pop. Over the past year the Real Estate Investment Trust sector was the #4 best performing asset class generating returns of 22.1%.
Like many investors, I visit Real Estate sites regularly to see how much inventory is available and what the prices are. Over the last 18 months it has been a wonder to behold. But the recent price increase worried me quite a bit simply because the magnitude of the move mixed in with the main factors that drive housing prices clearly say that this type of growth is not sustainable. Over the past 18 months we have seen the Federal Reserve increase the money supply by over $6 trillion. Historically, the real estate market benefits from this type of currency devaluation.
I am not pessimistic here. Quite the opposite, but I feel critical thinking is in order. Traditionally, Real Estate is the largest investment that anyone will ever make in their lives. While it is possible to make as little as a 3% to 5% down payment and borrow the rest in the form of a 30-year mortgage, the initial problem is that when prices move 20%+ higher in a year, first time home buyers, are incapable of saving fast enough or receiving enough salary increases to be able to qualify to purchase their first home. So, the first red flag is that the recent run up in real estate prices has bowed out the first-time home buyer completely.
That means that the remaining activity in the real estate market takes place between commercial investors, home upsizers and home downsizers.
Recently the Wall Street Journal wrote about this phenomenon highlighting the FOMO characteristics that have gripped homebuyers.
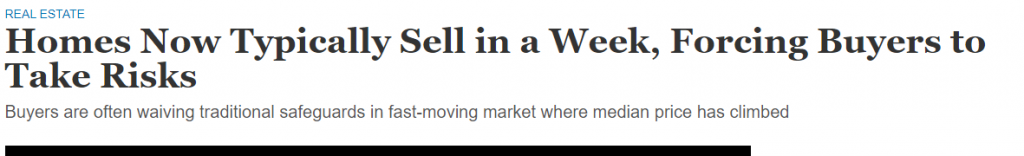
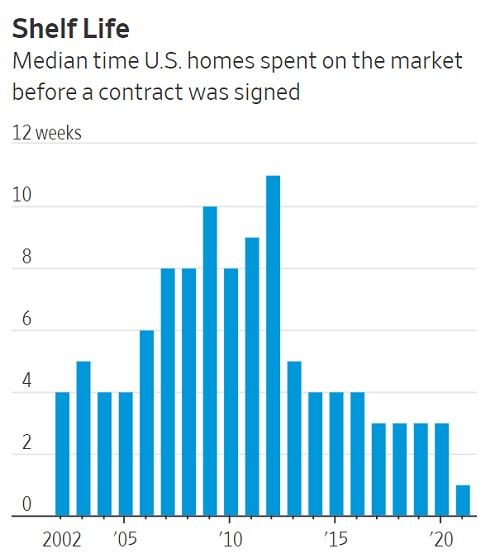
The article featured the following graph which should create a contrarian outlook for anyone who studies it. Homes coming on to the market have been selling in a weeks’ time, when historically the average has been 7 ½ weeks. In the world of trading there is a saying that “high volatility begets low volatility and vice versa.“ What the saying tries to communicate is that EXTREMES need to be recognized for when they occur the trend reverts back to the average. This is counterintuitive and goes against the grain of traditional thinking and human nature. Most people buy their air conditioners in the summer months when it is hottest and when the demand is greatest. If it is 120 degrees outside and it is August, statistically speaking it is fair to say that the temperature will only get cooler from here. Likewise, when homebuyers are making the biggest investments of their lives and paying significantly above the offering price to acquire the property, this is not normal, and the tendency will revert to the mean.
The average asking price is now the average selling price.
In a normal housing market, a seller expects to get lower bids as a starting point for back-and-forth negotiation over various parts of the deal until agreement. A bubble market is comparable to everybody putting market orders in simultaneously. I might be wrong, but this is not sustainable in any form, particularly with new home buyers being boxed out of the market. Real Estate is an inflation hedge but what we are witnessing is price appreciation in dollars because the currency is being devalued.
Next, we can start to analyze some of the biggest real estate sellers and developers and see how they are faring in this recent move up.
Take Zillow for example. Zillow ($Z) is down over 70% in the last 9 months. Ouch!
One stock does not make a market but seeing ZILLOW crumble during a booming Real Estate market should force investors to be very discerning in their decision making.
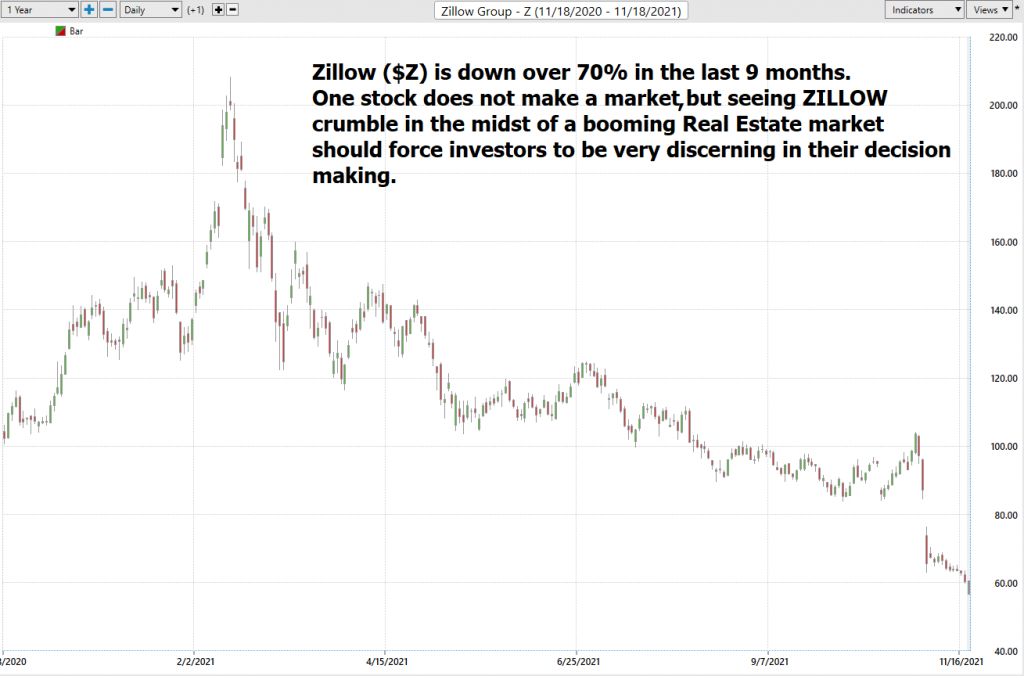
This price collapse in Zillow is noteworthy because ZILLOW was buying thousands of homes across the U.S. and reselling them to homebuyers and investors. In an upwards trending real estate market, you can flip the assets and turn a profit, but it becomes and entirely different business model when prices start going down.
Last week Zillow announced that it would stop buying houses indefinitely and reported it will lay off 2,000 employees. They want to offload the 7,000 houses purchased at over $2.8 billion that they were originally planning to fix and flip.
Last Quarter Zillow reported a $0.95 loss per share, whereas the Street was expecting a profit of $0.16 per share. It looks like Zillow got caught in a FOMO trap.
These Flipper companies like REDFIN and Open Door are holding large quantities of Real Estate assets where their purchase price likely reflects the huge increases in selling prices over the past 18 months and comes at a time when consumers may be starting to shift away from the “buy it at any cost” type of mentality.
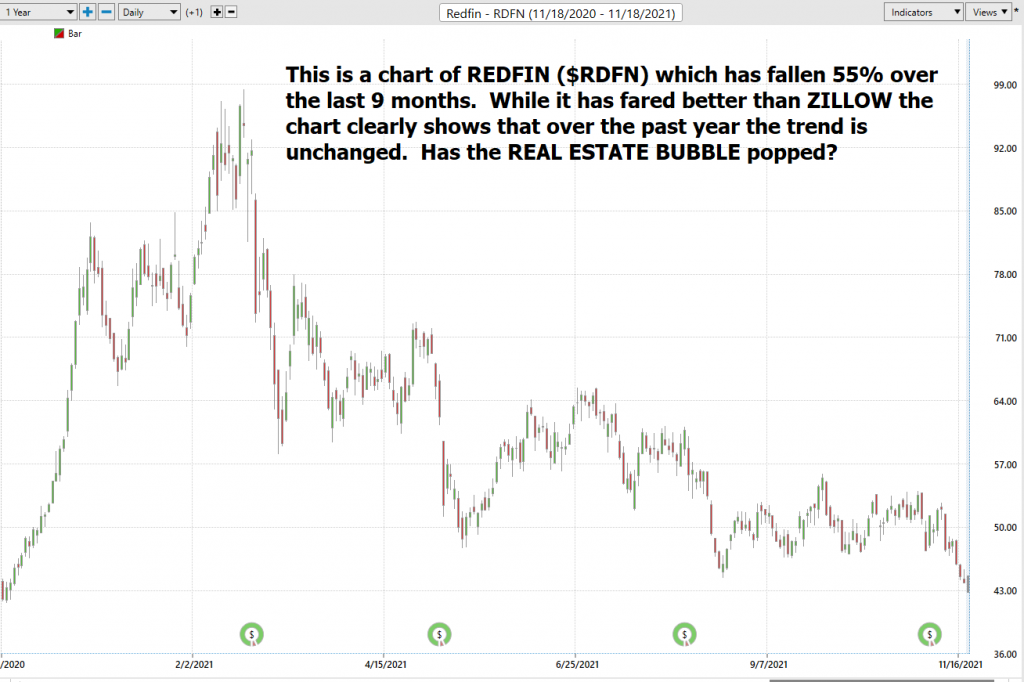
This is a chart of REDFIN ($RDFN) which has fallen 55% over the last 9 months. While it has fared better than ZILLOW the chart clearly shows that over the past year the trend is unchanged. Investors are rightfully asking the question “has the REAL ESTATE BUBBLE popped?”
In the backdrop of these events domestically, the Real Estate sector has had to contend with Evergrande the second largest Real Estate developer in China being insolvent and unable to make payments on $300 billion dollars’ worth of obligations. While this news broke in late September of 2021, it appears that over the past 30 days Evergrande has made gestures at trying to restructure its finances. The dark cloud on the horizon is that most of the top Chinese Real Estate bonds are dropping in price quite rapidly as the fear of contagion takes hold. More importantly, credit obligations may be downgraded by bond rating agencies.
Over the past decade Evergrande offered bonds yielding 10% returns. The bonds have always been considered just above junk in quality.
The higher the bond rating, the more favorable the terms will be for the bond issuer. These creditworthy issuers have lower interest rates because investors need less compensation for the risk of default. That leads to lower borrowing costs for bond issuers. Bonds rated B or less are considered speculative and are treated as speculative. These high-yield bonds, which many refer to as junk bonds have much higher risks of default are usually only purchased by those investors who can afford to chase yield with their portfolios.
The beleaguered Evergrande made $110 billion in sales last year, but they have 350 billion in assets. In June, it failed to pay some commercial paper loans. The company is the most indebted real estate developer in the world with liabilities more than $305 billion. Evergrande epitomizes China’s historic Credit Bubble.
In the year 2000 China had $1.7 trillion in total debt. Today China owes nearly $50 trillion. This lavish spending has taken per capita income in China from $300 per year to $10,500 per year in 2020. Evergrande is at the epicenter of this lavish spending and extraordinary asset inflation, speculation, and reckless debt-financed mal-investment.
It’s also the largest issuer of dollar junk bonds in Asia.
Evergrande owes money to 128 banks and more than 121 non-banking institutions. Evergrande’s stock price has dropped by 90 percent over the past 14 months and is currently trading at 32 cents, while its bonds were trading at 60 to 70 percent below par. The future of Evergrande and possibly the world economy depends on whether the Chinese central authorities will allow Evergrande to default, or if the Chinese Communist Party will intervene to maintain stability. Analysts, economists, and traders need to be aware of the possibility of Evergrande contagion as you will likely feel the ripple effects throughout the world economy. Evergrande is only one company, but its effect is far-reaching as it employs over 200,000 people and its projects supply labor needs to over 2.8 million.
Clearly, the world economic ecosystem is very much intertwined with Evergrande.
Real estate is a key sector to watch in maintaining your stock portfolio because it often acts like the canary in the coal mine.
In the early days of mining, one of the most dangerous things for the miners in the mine was the buildup of toxic gases. These were gases you couldn’t see or smell. So, the lead miner would start carrying a canary with him everywhere he went. Why? Because if there were any gases in the mine the canary would die first before the poisonous gases were toxic enough to kill anyone else.
The noxious and poison gases have been building. Whether it is enough to affect the world economy awaits to be seen.
We’ve been here before though…
During the 2008 Financial Crisis it was Real Estate and the insolvent mortgages which decimated portfolios and the world economy. It may not occur again. But Evergrande is much bigger than Lehman and today’s world is much more leveraged than that of 2008. In another popular turn of phrase, the bubble may have found its pin.
I think there is great wisdom in being prudent and discerning as a speculator. My challenge to you is quite simple.
How do you go about trying to make sense of it all…?
Embrace the solution that artificial intelligence presents for keeping you on the right side of the right trend at the right time.
In the marketplace, price is the only thing that matters. Price is what will either decimate your account or make you wealthy. Artificial intelligence accompanied by Neural Networks is designed specifically to make the best move forward. In today’s age of huge money supply expansion this is invaluable to investors and traders.
Here is a chart of iShares S&P/TSX Capped REIT Index ETF ($XRE)
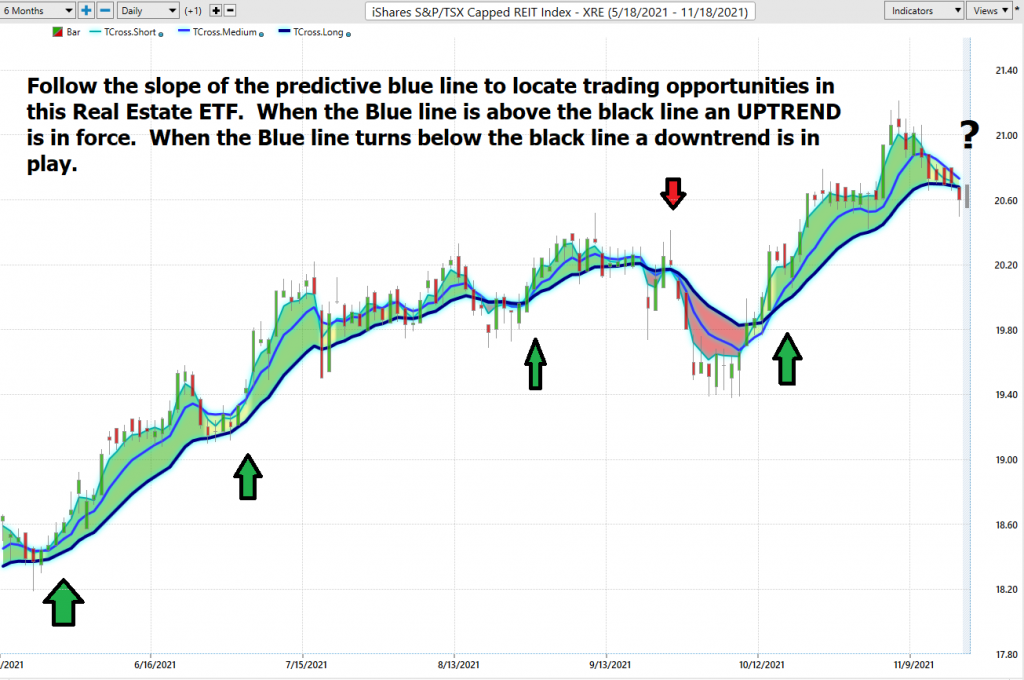
Follow the slope of the predictive blue line. When the predictive blue line turns below the black line it is a downtrend. The a.i. is on the verge of making that forecast. That does not mean that Evergrande will implode. It means that the trend of the Real Estate Investment Trust Sector looks like it is reverting back to the mean. As a trader that tells me ONE THING. Don’t be LONG when the trend is DOWN.
This is the power and simplicity that has kept Power Traders on the right side of ZILLOW and REDFIN over the past 9 months.
Finding value is becoming a completely consuming activity on the part of traders and investors. The target moves quickly based upon too many factors that remain unseen to the naked eye.
It’s all about getting on the right side, of the right trend at the right time.
Most traders have problems with the timing of their trades.
If you want to win, it’s all about who has the best tools. Artificial intelligence excels at keeping traders on the right side of the right trend at the right time.
Let’s get candid here:
• The market is brutally honest – there are winners and losers.
• It’s very black and white.
• If you need a friend, get a dog.
• If you are going to win, someone else must lose.
• If survival of the fittest makes you uneasy, stay out of the financial markets.
We live in unique times. The Printing Press is diluting the value of your money.
Everyone is aware that if the money supply grows 20% you must grow your portfolio by that amount just to break even when you look at your purchasing power.
Since artificial intelligence has beaten humans in Poker, Chess, Jeopardy and Go! do you really think trading is any different?
How do you think your investment portfolio compares when pitted against artificial intelligence?
Are you capable of finding those markets with the best risk/reward ratios out of the thousands of trading opportunities that exist?
Knowledge. Useful knowledge. And its application is what A.I. delivers.
You should find out. Join us for a FREE Live Training.
We’ll show you at least three stocks that have been identified by the A.I. that are poised for big movement… and remember, movement of any kind is an opportunity for profits!
Discover why artificial intelligence is the solution professional traders go-to for less risk, more rewards, and guaranteed peace of mind.
Visit with us and check out the A.I. at our Next Live Training.
It’s not magic. It’s machine learning.
Make it count.

IMPORTANT NOTICE!
THERE IS SUBSTANTIAL RISK OF LOSS ASSOCIATED WITH TRADING. ONLY RISK CAPITAL SHOULD BE USED TO TRADE. TRADING STOCKS, FUTURES, OPTIONS, FOREX, AND ETFs IS NOT SUITABLE FOR EVERYONE.
DISCLAIMER: STOCKS, FUTURES, OPTIONS, ETFs AND CURRENCY TRADING ALL HAVE LARGE POTENTIAL REWARDS, BUT THEY ALSO HAVE LARGE POTENTIAL RISK. YOU MUST BE AWARE OF THE RISKS AND BE WILLING TO ACCEPT THEM IN ORDER TO INVEST IN THESE MARKETS. DON’T TRADE WITH MONEY YOU CAN’T AFFORD TO LOSE. THIS ARTICLE AND WEBSITE IS NEITHER A SOLICITATION NOR AN OFFER TO BUY/SELL FUTURES, OPTIONS, STOCKS, OR CURRENCIES. NO REPRESENTATION IS BEING MADE THAT ANY ACCOUNT WILL OR IS LIKELY TO ACHIEVE PROFITS OR LOSSES SIMILAR TO THOSE DISCUSSED ON THIS ARTICLE OR WEBSITE. THE PAST PERFORMANCE OF ANY TRADING SYSTEM OR METHODOLOGY IS NOT NECESSARILY INDICATIVE OF FUTURE RESULTS. CFTC RULE 4.41 – HYPOTHETICAL OR SIMULATED PERFORMANCE RESULTS HAVE CERTAIN LIMITATIONS. UNLIKE AN ACTUAL PERFORMANCE RECORD, SIMULATED RESULTS DO NOT REPRESENT ACTUAL TRADING. ALSO, SINCE THE TRADES HAVE NOT BEEN EXECUTED, THE RESULTS MAY HAVE UNDER-OR-OVER COMPENSATED FOR THE IMPACT, IF ANY, OF CERTAIN MARKET FACTORS, SUCH AS LACK OF LIQUIDITY. SIMULATED TRADING PROGRAMS IN GENERAL ARE ALSO SUBJECT TO THE FACT THAT THEY ARE DESIGNED WITH THE BENEFIT OF HINDSIGHT. NO REPRESENTATION IS BEING MADE THAT ANY ACCOUNT WILL OR IS LIKELY TO ACHIEVE PROFIT OR LOSSES SIMILAR TO THOSE SHOWN.

