
Since last week’s US election, the following chart from Deutsche Bank economist Jim Reid has been making the rounds. It clearly shows the silver and gold were the best performing assets during the President’s first term in office.
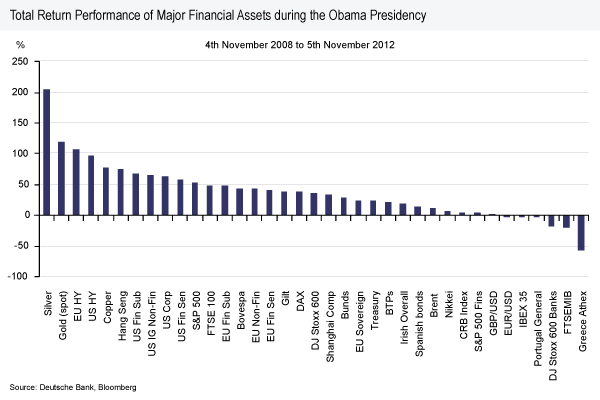
Based on the LBMA spot fix, silver rose a remarkable 211% between November 04, 2008 and November 05, 2012; from $9.95 to $30.91, to lead all asset classes. If measured from Mr. Obama’s actual inauguration day on January 20, 2009, silver still leads the pack at +173%.
Just as remarkable perhaps, is that as the President’s first term was winding down, silver was 38% off its high set in April of last year at $49.78. So at one point in that first term, silver was up 340% from inauguration day and 400% basis election day.
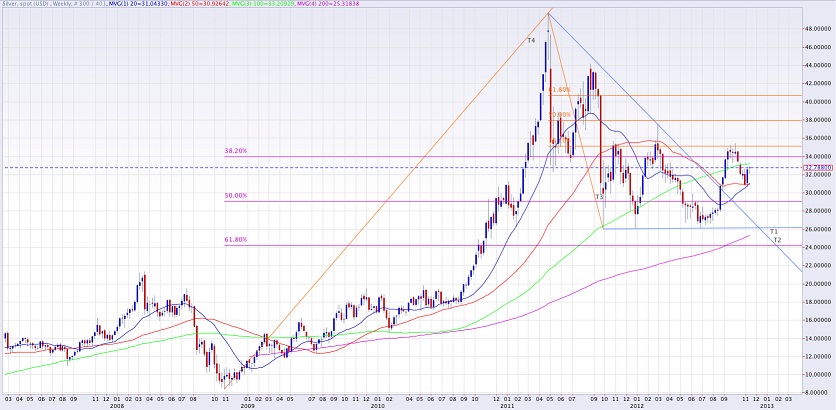
Chart by NetDania
The prevailing sense is that a second term for President Obama has bullish implications for the precious metals, premised on expectations that the next four-years are likely to look a lot like the last four-years.
As we pointed out last week, who sits in the Oval Office is of little real consequence; yet I think it is fair to conclude that with the same captain at the helm (and the same contentious division of power in Congress), and the same super-accommodative Fed, the ship is likely to remain on the same general course.
SILVER DEMAND
Philip Klapwijk, the global head of metals analytics at GFMS, summed up some of the driving forces behind silver demand at the LBMA conference in Hong Kong this week. He expects “strong investment demand, higher gold prices on the back of monetary easing, rising inflation expectations and the persistence of ultra-low interest rates,” to continue attracting buyers to the silver market. Klapwijk went on to make a prediction: “We are thinking prices will trend higher next year. I’m not convinced that we are going to $50. I think we will definitely see $40 to $45 prices.”
BIG PICTURE
The weekly chart above provides some longer-term perspective. We basically remain in the lower third of a very broad range. However, the chart pattern that has emerged since the $49.78 peak last year has many of the attributes of a continuation pattern; meaning an eventual breakout is most likely to come in the direction of the underlying trend. The recent bounce off the 200-day moving average suggests that trend is still bullish.
KEY LEVELS TO WATCH
How silver reacts to the 100-week moving average, which is just above the market at $33.21 may provide near-term direction. I would view a confirmed cross of the 20-week moving average over the 50-week moving average this week as a bullish technical event as well.
= = =
Read our front page stories here for more trading ideas.
Should the U.S. return to the gold standard? Read an article here.

