
By: Scott Redler
Traders are trying to figure out if 9% off the highs is “enough” for this correction. Right now, the jury is out, as the market is developing a “wedge-type” pattern. This is typically a precursor to some type of directional move. A 60 minute close below 1,060 gets us a retest of Friday’s intraday low of 1,044; while a 60 minute close above 1,072-1,075 probably takes us back to 1,085-1,090.

Many stocks are trapped in a box, with the ranges getting ever tighter:
- Apple (AAPL) is trapped between $194-197. A 60 minute candle closing below $194 should take prices to $190, while a close above $197 gets us back above $200.
- Amazon (AMZN) is developing a very similar pattern–it is caught in a lower range between $114-120. Implement the same strategy as with Apple here.
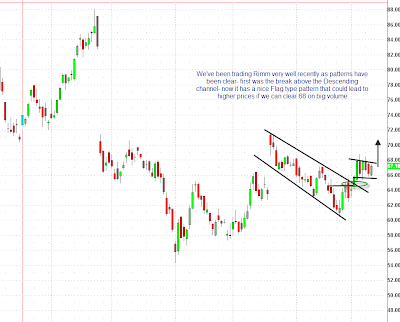
- Research in Motion (RIMM) looks good! We have been trading it from a net long bias since the reversal at around $61. It is now developing a nice bull flag. Watch $68.
 Google (GOOG) is yet another tech stock stuck in a tight range–$525-540–one day it will trigger.


- VMWare (VMW), Cree (CREE) and Intuitive Surgical (ISRG) are all tight charts with the strongest technical patterns. Here is a chart of CREE as an example:

- Toyota (TM) from Friday’s Fast Money segment is basically reaching that $77 target level this morning.
- Believe it or not, housing stocks popped on my radar. They seem setup for a trade here. Take a look at a chart of Toll Brothers (TOL) as an example:

- Goldman Sachs (GS) is poking its head at the $155 resistance area. See if it can pop above and hold. Should Goldman hold, the banks would get a lift and carry the market higher. This is a key tell!
- Baidu (BIDU) had a strong day off of earnings yesterday. The stock played with the $470 area for a while and then blasted off. This is the first important market stock to gap up on earnings and not only hold, but tack on gains.
There is a lot to watch today, follow price action closely!

