

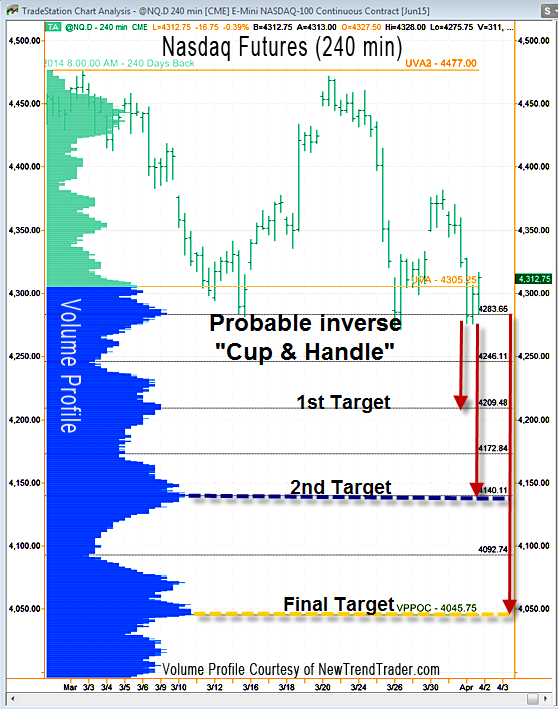
The Nasdaq futures have printed a bearish inverse “Cup and Handle” pattern on the 240-minute chart, a pattern originally identified by William O’Neil, the founder of Investors Business Daily. This pattern projects about 200 points south, and I think we will actually go a little further – all the way to the Volume Profile Point of Control, the gold line at 4045.
On the way there, the train should make two other stops. First stop is at the gap around 4209 (gap not shown), and the second stop is at the high volume node at 4140, before finally reaching the VPPOC at 4045. The 4045 level will be an excellent buying zone, so keep some powder dry.
A Note on Volume Profile
The histogram on the left side of the chart shows the volume distribution in the Nasdaq futures for different periods of time. Key support and resistance levels are indicated by the peaks and troughs.
#####
If you would like to receive a primer on using Volume Profile, please click here.

