
![]()
Carvana ($CVNA) is an ecommerce company established in 2013 by Ernest Garcia III. The company offers consumers a chance to enter the automotive market with their online used car buying and selling services. They also provide at-home delivery of cars 6 days a week, along with pickup options from over 8,500 Car Vending Machines across the US. Carvana went public in April 2017, and has since grown to include nearly 4,000 employees. Their main competitors are Carmax and AutoNation, however they are struggling to keep up with customer demand as their biggest business challenge.
The e-commerce revolution has taken the automotive retail industry by storm, with major companies such as Carvana, Vroom, and Shift Technologies drawing in massive profits through their online platforms. Many of these brands have gone public on the stock market, giving ordinary citizens the opportunity to choose and invest in the future they want to see. The auto-retailing industry is hyper competitive and has become even more so with the advent of digital technologies implemented through ecommerce. Currently the top players in this niche are AutoNation, Vroom, Shift, CarMax, TrueCar and Cars.com.
The hyper-competitive e-commerce auto retailing sector is nothing to scoff at. With an ever-changing landscape, the increased availability of platforms and technologies that allow for seamless automation and scalability has created a fast-paced environment where there are few barriers to new players entering the market. This has made it difficult for existing retailers to stay competitive, as new players bring innovation, lower prices, and enhanced customer experience measures for customers in search of a great online auto purchase experience. The biggest challenge facing auto e-commerce companies is remaining competitive through continuously evolving their service offering while still keeping overheads low and ensuring healthy margins. Additionally, companies must account for rapidly changing consumer preferences in order to maintain relevance in such a volatile industry.
All customers are looking to balance value, price, and convenience in their shopping experiences. These three factors define the challenges of the auto retailing sector online. Optimal value can be an important factor when selecting products, as they look for items that provide them with the highest quality with the most reasonable pricing. At the same time, convenience can be another major priority – customers don’t want to sacrifice their time or energy in trying to secure good purchases. As such, it is not surprising many shoppers are on the lookout for ways to get great deals while also taking advantage of opportunities available from vendors offering fast delivery or convenient pick-up options. Navigating these three factors creates another layer of competitive complexity for competitors in this niche to evaluate in fine tuning their value propositions.
Every company in the ecommerce auto retailing sector strives to find a way to stand out while offering the same basic services, such as an efficient shopping process and a wide selection of makes and models. Value propositions that separate companies can come in the form of extras such as free shipping or additional special offers on insurance, car parts, or service agreements. Companies may also differentiate themselves in customer service by providing customer representatives 24/7 via phone or chat and having fast turnaround times on order fulfillments. Many companies will go the extra mile to provide specialized customer services, such as providing virtual test drives or tailored advice based on individual preferences. In this cutthroat market, it takes a compelling value proposition for an online auto retailer to be successful in standing out from the pack.
To provide a glimpse of the landscape here is a snapshot of Carvana’s competitors and their value propositions.
AutoNation: AutoNation is the largest online car retailer in the United States, established by billionaire entrepreneur Wayne Huizenga in 1996. The company has become a leader in automotive retailing. It generates revenue from its sales of new and used vehicles as well as its financing activities. Additionally, AutoNation offers services such as vehicle spare parts, insurance, and extended warranties to its customers. By leveraging cutting-edge technologies such as AI, Machine Learning, Predictive Analytics and Big Data Solutions, AutoNation continues to expand its network and foray into new markets. The company’s ability to offer world-class customer service makes it a standout in the highly competitive automotive retailing market.
Vroom: Vroom is an online car retailer that was founded in 2013 by Allon Bloch. Vroom went public in 2020. They are headquartered in New York City, USA, and specialize in selling used cars with an emphasis on convenience for their customers. Their innovative platform features an extensive selection of cars from both dealerships and private sellers that can be purchased securely online with free delivery to the customer’s doorstep. Their success is due to features such as their 7-day return policy, money-back guarantee on cars priced above $20,000, and 100% price transparency on accurate inspection reports. With these innovations, they deliver a highly satisfying car buying experience to all customers regardless of location or budget.
Shift: Shift is an online car retailer founded in 2013 by George Arison, a former Google employee. The company’s mission is to provide customers with the ultimate car buying experience, one that is easy and transparent. Shift works with leading automobile retailers across the United States to ensure its inventory is always top-notch and updated regularly. To date, Shift has generated over $230 million in revenue by simplifying the entire car buying experience for their customers. With its dedication to customer satisfaction, timely delivery of services, and quality inventory options – Shift is respected because of its ability to easily implement the most cutting edge technologies to its buying processes.
CarMax: CarMax is a leading online car retailer that was founded in the early 1990s. It offers customers an extensive selection of new and used vehicles at prices that have been fixed, meaning there is no haggling involved. Since its launch, CarMax has seen incredible success with their unique approach to car sales generating over $11 billion in revenue in 2019 alone. Every year, millions of customers look to CarMax for their automotive needs and it remains one of the most popular websites for car design and services. With continual growth and expansion, CarMax shows no signs of slowing down anytime soon.
TrueCar: TrueCar has quickly become the go-to platform for shoppers looking to save money on their purchase of a new vehicle. By connecting buyers with pre-qualified dealerships, the company promotes transparency and better communication in the car-buying process. With its commission-based revenue model, TrueCar has created a business ecosystem backed by both automakers and car dealerships,
Cars.com: Cars.com has grown to become one of the top-rated websites for both car buyers and sellers. Cars.com sells new and used cars. The company also generates significant revenue from advertising from major automakers, car dealerships, aftermarket companies, and parts manufacturers.
Carvana ($CVNA) has never been profitable in its history, which makes trading the stock a very speculative activity. In many ways, the company and its income statement are a paradox. Let me explain.
A paradox is a seemingly contradictory statement that nonetheless contains truth. Generally, a paradox consists of two separate ideas put together in a way that makes it difficult to explain without having to reconcile the two seemingly opposite concepts. On the one hand, $CVNA has increased their revenue every year for the past 5 years.
- 2021: $5.6 billion
- 2020: $5.5 billion
- 2019: $3.9 billion
- 2018: $2.2 billion
- 2017: $858.9 million
But in spite of this exponential revenue growth, the company has increased its operating losses every year. Here is a summary of their annual operating losses for the past five years (2017-2021) based on their financial statements:
- 2021: $444.9 million
- 2020: $401.1 million
- 2019: $332.6 million
- 2018: $220.3 million
- 2017: $153.3 million
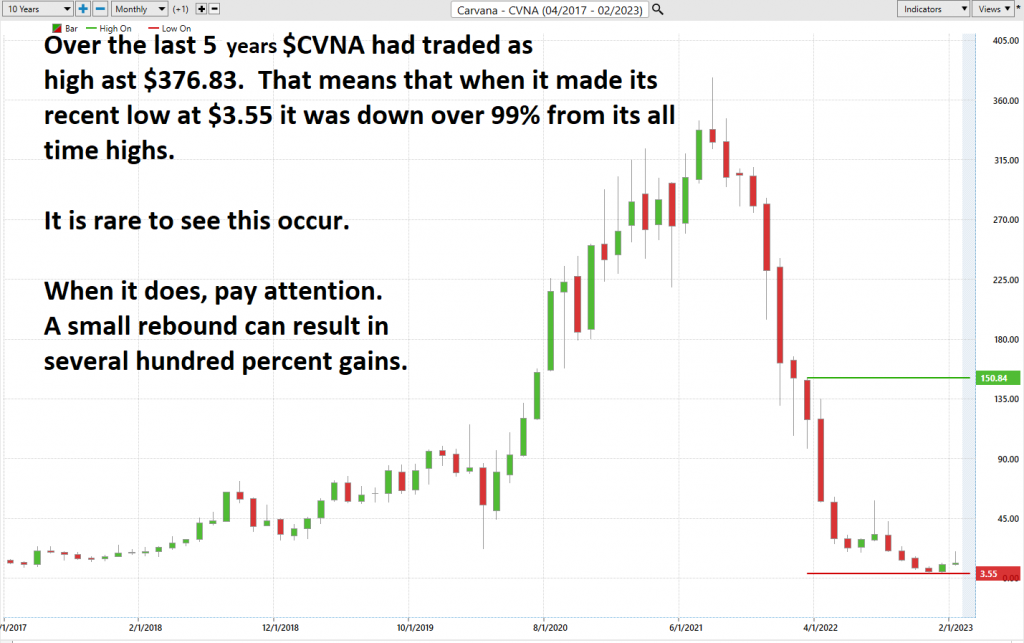
These apparent contradictions help explain why CVNA literally lost over 99% of its value from its all-time highs.
The company has over $6 billion in long-term debt and only $316 million of cash and its equivalents on its balance sheet.
In this weekly stock study, we will look at and analyze the following indicators and metrics as are our guidelines which dictate our behavior on a particular stock.
- Wall Street Analysts’ Estimates
- 52-week high and low boundaries
- Best Case – Worst Case Analysis
- Vantagepoint A.I. Forecast (Predictive Blue Line)
- Neural Network Forecast
- Daily Range Forecast
- Intermarket Analysis
- Our trading suggestion
We don’t base our decisions on things like earnings or fundamental cash flow valuations. However, we do look at them to better understand the financial landscape that a company is operating under.
Analysts Ratings
The first set of boundaries which we explore in our stock study is what do the professionals think who monitor the stock for a living. We can acquire this information by simply looking at the boundaries that the top Wall Street Analysts set for $CVNA. This initial set of boundaries provides us with an idea of what is expensive, fairly valued, and cheap.
Based on 15 Wall Street analysts offering 12-month price targets for Carvana in the last 3 months. The average price target is $8.55 with a high forecast of $21.00 and a low forecast of $1.00. The average price target represents a -15.01% change from the last price of $10.06.
From this simple analysis, we can see that expectations for the future vary greatly, which is the recipe for volatility that we are normally looking for.
52-week High-Low Chart
We always pay attention to where we are trading in relation to the 52-week range. Being aware of where the stock is trading allows us to understand how value has been defined over the last 52 weeks.
$CVNA is currently trading at its 4th percentile on the 52-week chart.
One of the simplest ways to evaluate a stock is to look at some long term monthly and weekly charts to be able to zoom out and see the big picture of the trend. Some of the greatest traders in the world use the longer-term monthly charts to determine trend analysis.
Here is the 52-week chart of $CVNA. How often do you see a former Wall Street darling lose 97% of its value in 52 weeks?
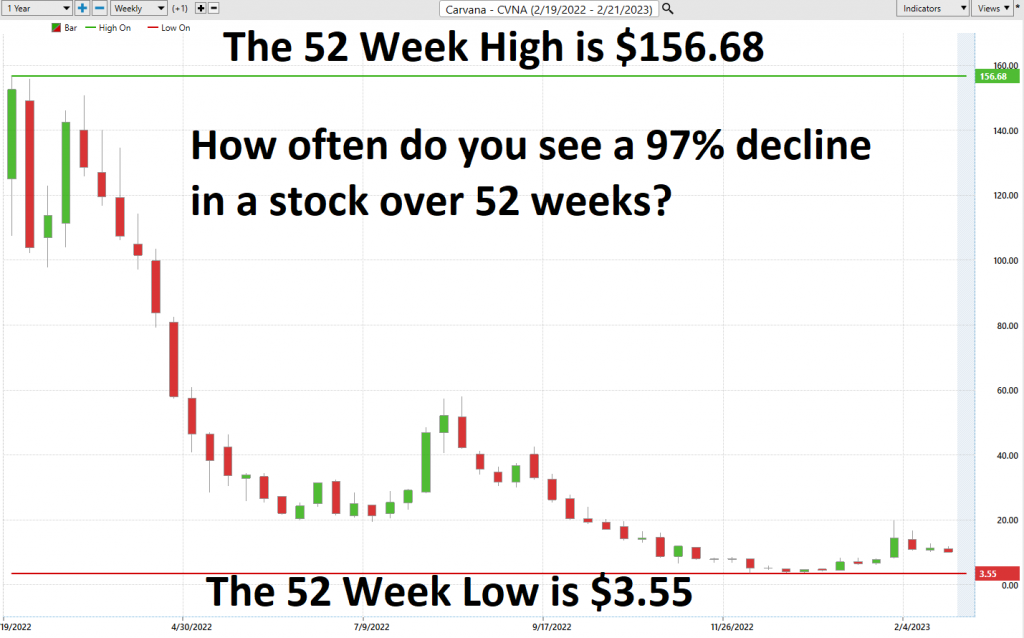
We have learned from years and years of observation that when a stock loses almost all of its value in a 52-week time frame it is time to put on the discriminating trader hat. These types of meltdowns can and often reverse very quickly.
This type of speculation requires patience for the setup to develop and to be effective it should only be pursued in a very tiny segment of a portfolio. But when guided by the a.i. forecast the opportunity can be very lucrative.
The annual and long-term trend certainly needs to be acknowledged and respected.
Best Case – Worst Case Analysis
Doing a best-case analysis and worst-case analysis of a stock is like putting on two different glasses that offer perspectives from opposite sides of the same coin. By doing this, investors can make better decisions as they become aware of both the opportunities and risks associated with each opportunity. It also helps them to determine their vulnerability to potential losses, make investment adjustments accordingly, and decide whether a particular stock may be worth investing in. Overall, it’s an invaluable tool for assessing risk versus reward and positioning portfolios for financial success.
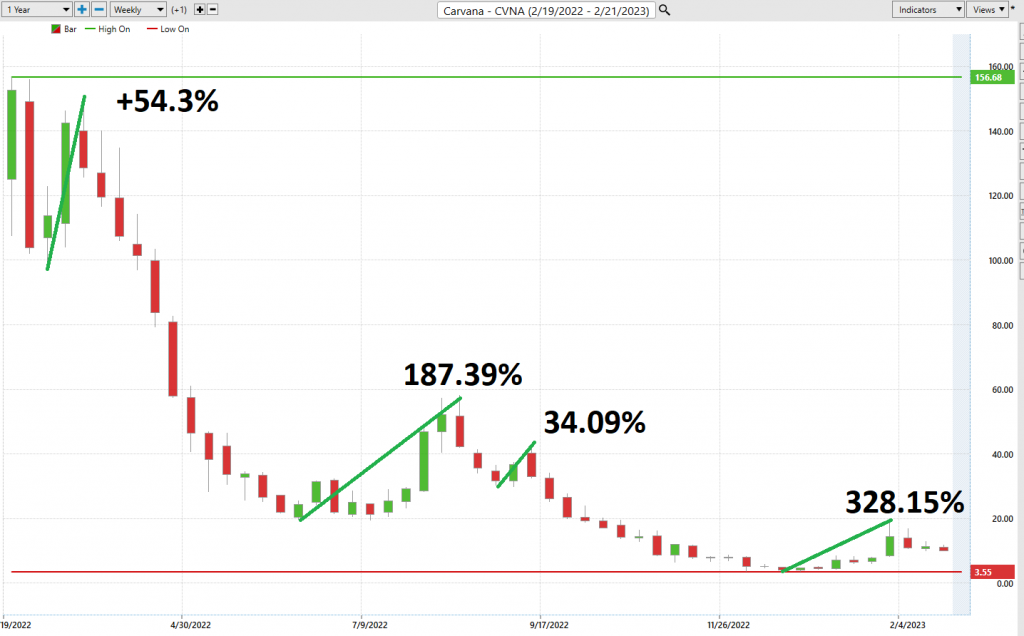
The goal of this exercise is to simply compare the risks versus the rewards and by doing so we can assess how the rallies performed in comparison to the declines.
Here is the best-case analysis:
Followed by the worst-case analysis:
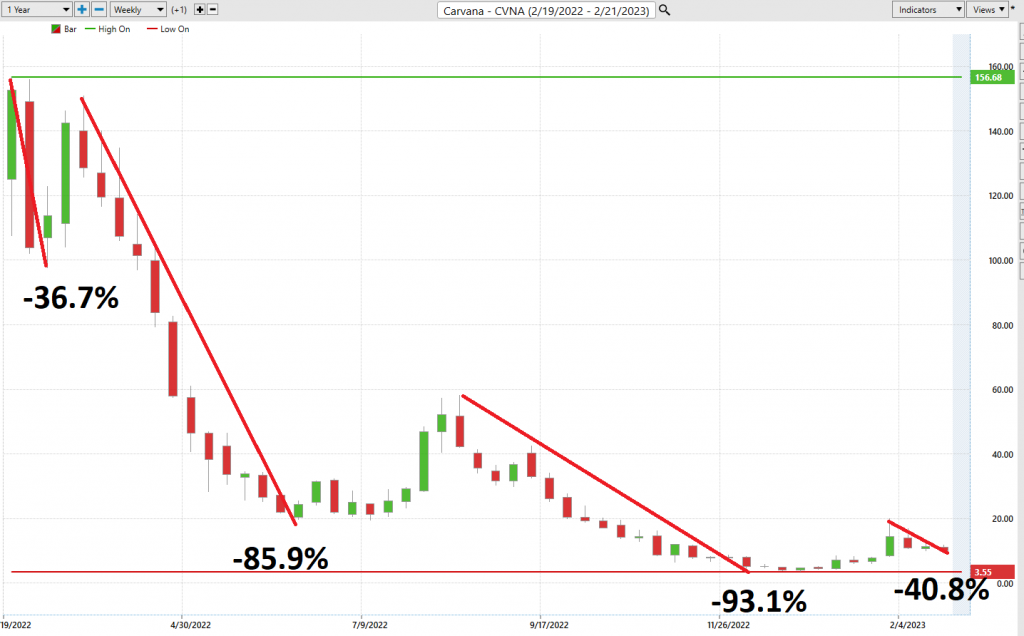
Clearly the bears were in control all year. But as you study the percentage returns observe that the % gains on the upside were larger.
Next, we want to evaluate $CVNA is in comparison to the performance of the major stock market indexes which we have greater familiarity with and then look at the drawdowns of the stock over the past year to get a worst-case scenario idea for any conclusions that we might reach when we trade this asset.
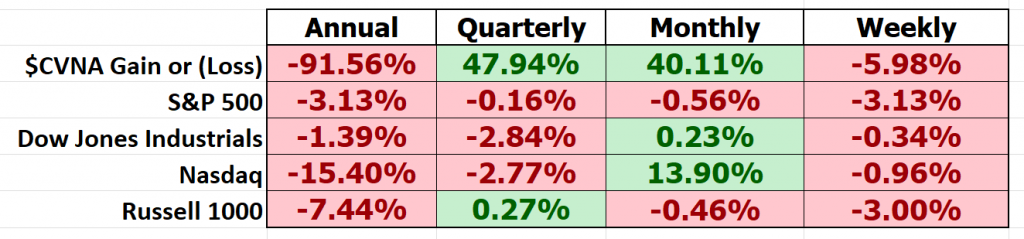
This allows us to quickly see how much more volatile $CVNA has been than the broader stock market.
Lastly, we would like to drill down to the main competitors in the sector to determine who are the leaders and losers and have an idea of relative performance within the sector.
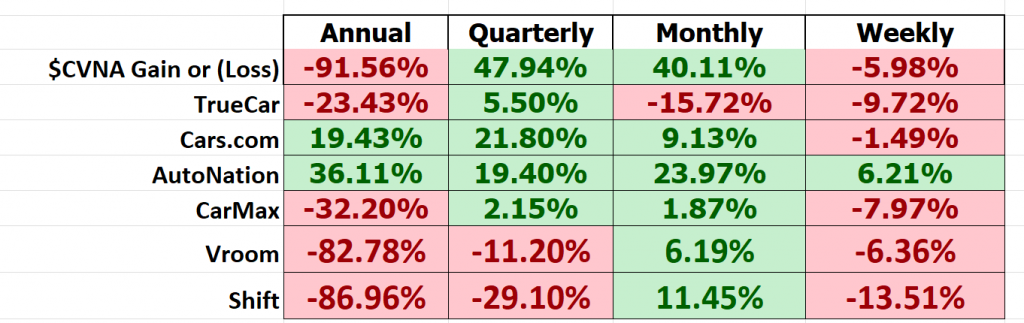
Bingo!
In this final analysis we see that $CVNA was the most oversold comparatively speaking against all of its rivals. Even after its recent 300% rally it is still down 91.56% year over year. This is important because a tiny, microscopic bounce in a stock that is off 99% can generate massive percentage gains when timed correctly.
The Vantagepoint A.I. Analysis
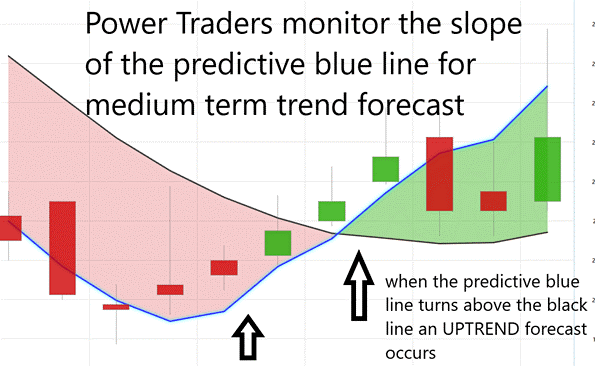
Using VantagePoint Software and the artificial intelligence, traders are alerted to trend forecasts by monitoring the slope of the predictive blue line. The black line is a simple 10 day moving average of price which simply tells you what has occurred in the market. The predictive blue line also acts as a value zone where in uptrends traders try to purchase the asset at or below the blue line.
In studying the chart below, pay close attention to the relationship between the black line and predictive blue line. All that the black line tells you is what has occurred. It tells you where prices have been and what the average price over the last ten days is.
The predictive blue line, on the other hand utilizes that Vantagepoint patented Neural Network and Intermarket Analysis to arrive at its value. It looks at the strongest price drivers of an asset through artificial intelligence and statistical correlations to determine its value.
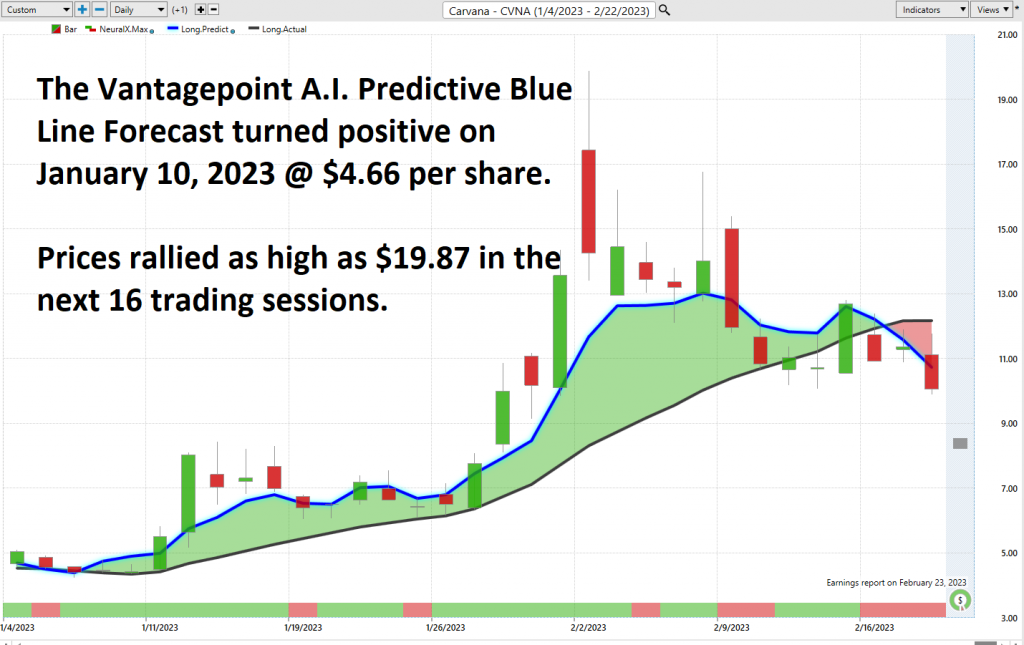
Whenever we see the predictive blue line move above the black line, we are presented with an UP-forecast entry opportunity. These are highlighted by UP arrows on the chart.
Whenever the predictive blue line moves below the black line, we are presented with a DOWN forecast. More importantly, there is no guesswork involved. Traders know where the value zone and trend are at all times.
Within a time frame of only 16 trading sessions prices exploded as high as $19.87.
Fine Tuning Entries with The Neural Net Indicator
At the bottom of the chart is the Neural Network Indicator which predicts future strength and/or weakness in the market. When the Neural Net Indicator is green it communicates strength. When the Neural Net is red it forecasts short-term weakness in the market.
We advocate that Power Traders cross reference the chart with the predictive blue line and neural network indicator to create optimal entry and exit points.
A Neural Net is a computational learning system that uses a network of functions to understand and translate massive amounts of data into a desired output, consistently monitoring itself and improving its performance.
Neural networks are an advanced type of artificial intelligence (AI) used in the world of financial trading. They’re designed to mimic a human brain, allowing them to recognize patterns and make decisions based on these patterns. Neural networks are typically set up like a web, with each node representing an individual neuron within the network. As data is fed into the system, it is continually examined and processed through this network of neurons and inputs, which in turn produces various results that can reveal crucial insights about market trends or how to best perform certain trades. By cross-referencing numerous financial and economic factors such as stock prices or consumer sentiment, neural networks provide traders with valuable quick decisions when deciding how to apply their strategies during fast-moving markets. Ultimately, this technology can reduce mistakes being made by eliminating human error and producing accuracy in decision-making for traders who use it.
Power Traders are always looking to apply both the neural network and A.I. to the markets to find statistically sound trading opportunities. We refer to this as a “double confirmation” setup and look for the predictive blue line to slope higher and to be confirmed by the Neural Net at the bottom of the chart.
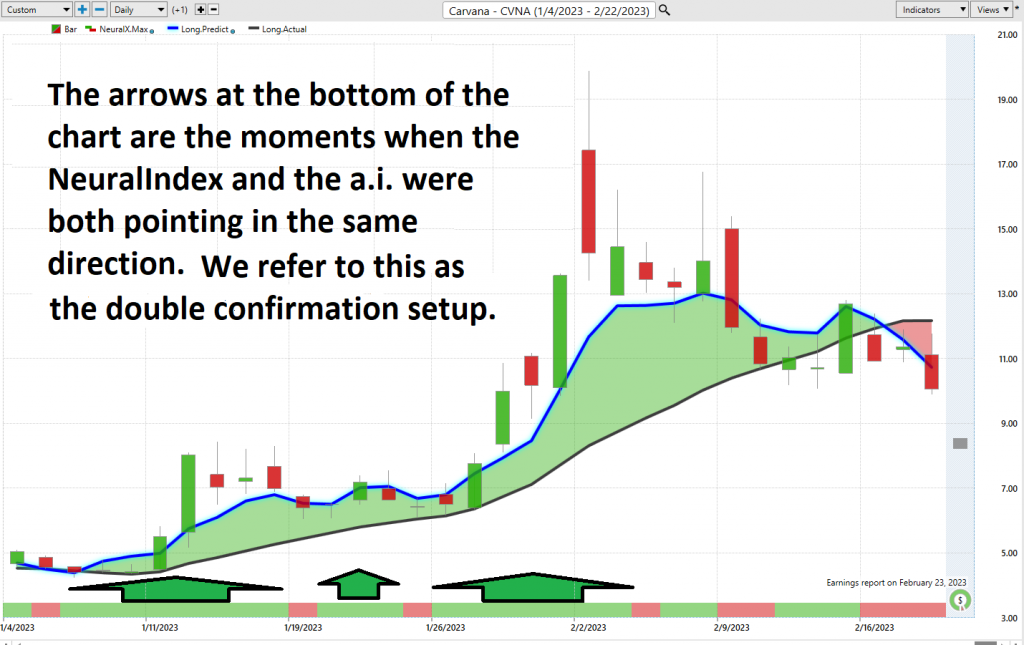
We advise Power Traders to cross reference the predictive blue line with the Neural Net for the best entry opportunities. Observe how the slope of the predictive blue line has remained positive from the time earnings were announced.
You can see in the chart above how the Neural Net offered several opportunities of double confirmation to Power Traders, when the predictive blue line and the Neural Net aligned with the same forecast. These instances provide extremely high probability trading opportunities to exploit the trend.
VantagePoint Software Daily Price Range Prediction
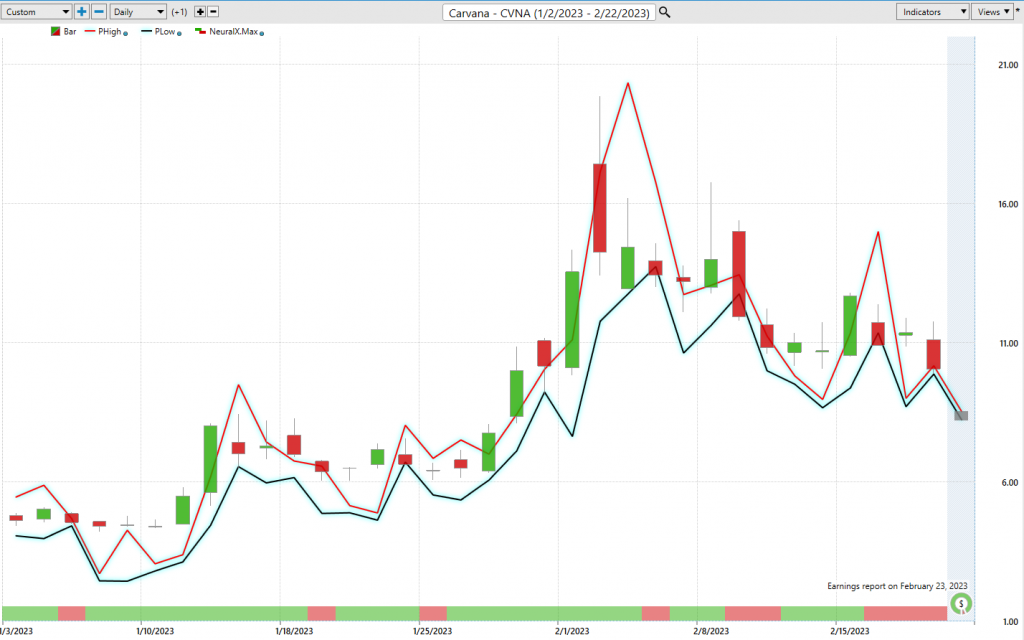
One of the powerful features in the Vantagepoint A.I. Software which Power Traders use daily is the Daily Price Range prediction forecast.
This forecast is what permits Power Traders to truly fine tune their entries and exits into the market.
What is the most important feature that traders are concerned about? Traders need to know where to enter and exit a market. VantagePoint provides this answer with exacting precision. Every day the Daily Range forecast is updated to provide insight to anticipated price action.
Over the past year Carvana ($CVNA) has exhibited the following percentages in terms of daily, weekly, and monthly time frames.
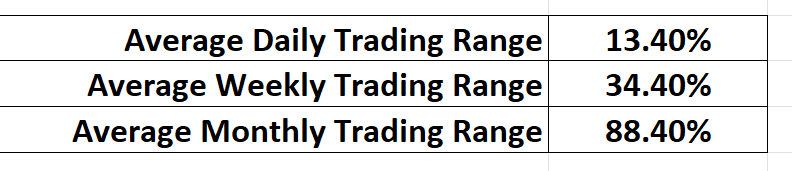
These numbers demonstrate how VOLATILE $CVNA is and the charts we have shared and studies prove it is a knife that can cut both ways.
By cross-referencing the double confirmation setup with the daily range forecast Power Traders are alerted to swing trading opportunities with exacting precision. The power of the daily range forecast is proven by simply studying the following chart and assuming you have placed your protective stop slightly below the dark line you would have captured almost the entirety of the entire upmove.
Intermarket Analysis
What makes the Vantagepoint Software extraordinary is its capacity to perform Intermarket analysis and to find those assets which are most statistically interconnected and are the key drivers of price.
Studying the charts can always provide objective realities in terms of locating support and resistance levels which become truly clear on a chart. But we live in a global marketplace. Everything is interconnected. The billion-dollar question for traders is always what are the key drivers of price for the underlying asset that I am trading?
These intangibles are invisible to the naked eye yet show extremely high statistical correlations.
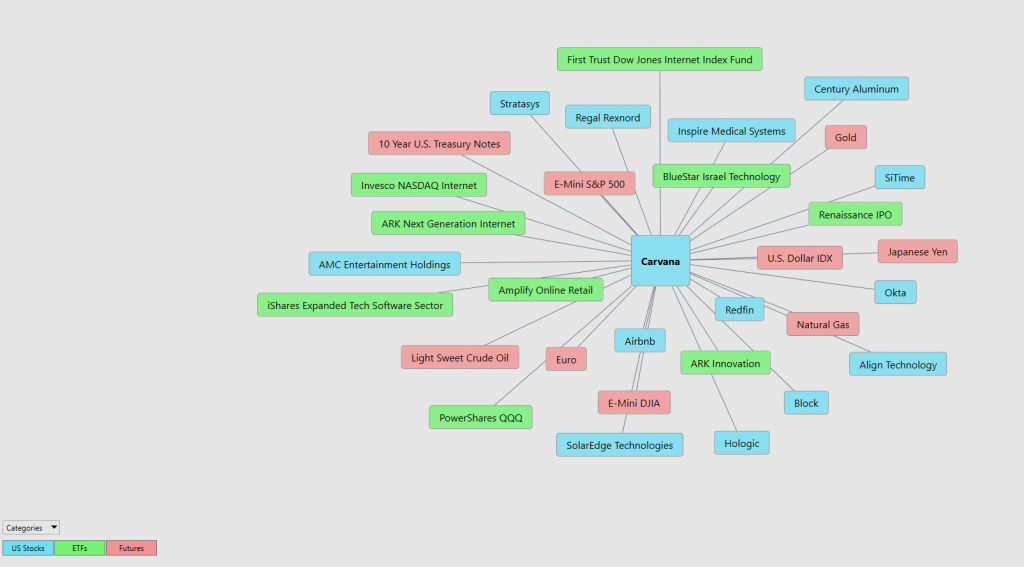
Small changes in Interest rates, Crude Oil Prices, and the Volatility of the dollar amongst thousands of other variables affect the decisions companies must make to survive in these very challenging times. Trying to determine what these factors are is one of the huge problems facing investors and traders.
There is excellent value to be had in studying and understanding the key drivers of $CVNA’s price action.
By doing so you can often see which ETFs are most likely to acquire $CVNA as well as uncovering other industries which affect $CVNA price movement.
This can be invaluable information because it allows a trader to locate other opportunities and see a listing of the ETF’s that are also buyers of $CVNA. This knowledge is how other trading opportunities are often uncovered in their embryonic stages.
Suggestion
Carvana has never been profitable and is bleeding money hand over first. It is releasing its next earnings on February 23, 2023. They are expected to post losses of -$2.30 per share. If the number is smaller than that it will be considered an earnings surprise and the rally will continue. If not, expect the volatility that $CVNA has experienced over the past year to continue.
For Carvana to turn a profit, it must take steps to address the challenges posed by its business model and current market conditions. Identifying ways to reduce operating costs while keeping up with changing demands of the used car industry are crucial for long-term success. To this end, pursuing strategies such as boosting operational efficiency or utilizing cutting edge technology could help ensure greater profitability in the future. This has not been, and will not be an easy task. Keep in mind that $CVNA has $6 billion in debt on its balance sheet and only $318 million in cash. A few more bad quarters and it will run out of money and will either file for bankruptcy or will be purchased by one of its rivals.
This is why it deserves to be on your trading radar.
The stock is as volatile as anything we have ever studied. We chose to analyze it primarily because it is an asset that had lost 99% of its value in less than two years.
The predictive blue line is the guidance that we will be following. Expect massive volatility post earnings. For experienced traders this is a godsend. Newbies should steer clear.
Our advice: Follow the a.i. trend analysis and practice good money management on all your trades.
$CNVA deserves to be on your radar. It might take several months to unfold but if it makes a new closing high, we think it will run substantially higher very quickly. Since we are trading 15% under the highest monthly close, we suggest you watch that level on this stock very closely.
We will re-evaluate this analysis based upon:
- Wall Street Analysts’ Estimates
- 52-week high and low boundaries
- Vantagepoint A.I. Forecast (Predictive Blue Line)
- Neural Network Forecast
- Daily Range Forecast
- Intermarket Analysis
Let’s Be Careful Out There!
Remember, It’s Not Magic.
It’s Machine Learning.

IMPORTANT NOTICE!
THERE IS SUBSTANTIAL RISK OF LOSS ASSOCIATED WITH TRADING. ONLY RISK CAPITAL SHOULD BE USED TO TRADE. TRADING STOCKS, FUTURES, OPTIONS, FOREX, AND ETFs IS NOT SUITABLE FOR EVERYONE.
DISCLAIMER: STOCKS, FUTURES, OPTIONS, ETFs AND CURRENCY TRADING ALL HAVE LARGE POTENTIAL REWARDS, BUT THEY ALSO HAVE LARGE POTENTIAL RISK. YOU MUST BE AWARE OF THE RISKS AND BE WILLING TO ACCEPT THEM IN ORDER TO INVEST IN THESE MARKETS. DON’T TRADE WITH MONEY YOU CAN’T AFFORD TO LOSE. THIS ARTICLE AND WEBSITE IS NEITHER A SOLICITATION NOR AN OFFER TO BUY/SELL FUTURES, OPTIONS, STOCKS, OR CURRENCIES. NO REPRESENTATION IS BEING MADE THAT ANY ACCOUNT WILL OR IS LIKELY TO ACHIEVE PROFITS OR LOSSES SIMILAR TO THOSE DISCUSSED ON THIS ARTICLE OR WEBSITE. THE PAST PERFORMANCE OF ANY TRADING SYSTEM OR METHODOLOGY IS NOT NECESSARILY INDICATIVE OF FUTURE RESULTS. CFTC RULE 4.41 – HYPOTHETICAL OR SIMULATED PERFORMANCE RESULTS HAVE CERTAIN LIMITATIONS. UNLIKE AN ACTUAL PERFORMANCE RECORD, SIMULATED RESULTS DO NOT REPRESENT ACTUAL TRADING. ALSO, SINCE THE TRADES HAVE NOT BEEN EXECUTED, THE RESULTS MAY HAVE UNDER-OR-OVER COMPENSATED FOR THE IMPACT, IF ANY, OF CERTAIN MARKET FACTORS, SUCH AS LACK OF LIQUIDITY. SIMULATED TRADING PROGRAMS IN GENERAL ARE ALSO SUBJECT TO THE FACT THAT THEY ARE DESIGNED WITH THE BENEFIT OF HINDSIGHT. NO REPRESENTATION IS BEING MADE THAT ANY ACCOUNT WILL OR IS LIKELY TO ACHIEVE PROFIT OR LOSSES SIMILAR TO THOSE SHOWN.

