
If you trade long enough, what you will quickly come to appreciate is great traders place immense value on odds and probabilities. Odds and probabilities are the foundation of statistics. Experience teaches us what makes long-term success possible is having an “edge.” The best way to understand this concept is look at any game of chance and familiarize yourself with the potential outcomes and payouts.
The way that I like to think about it is if you look at any activity involving probability theory, there are those who make the bets and those who take the bets. Once you dissuade yourself from the gambler’s mentality, you see very clearly casinos have a highly effective and successful business model. In other words, casinos take the bets because they have familiarized themselves with the odds of the game. It’s this understanding of odds and probabilities that allows casinos to be continually successful.
Odds and probabilities can seem like confusing concepts, but they are quite simple.
Odds are a way of expressing the likelihood of something happening, while probabilities are a way of quantifying that likelihood.
To understand odds, imagine flipping a coin. The odds of the coin landing on heads are 1 to 1, or 50%. This means that for every time the coin is flipped, there is an equal chance of it landing on heads or tails. The probability of the coin landing on heads is also 50%.
Probabilities can be expressed as fractions, decimals, or percentages. Odds are usually expressed as ratios, such as 1 to 1 or 2 to 1. Odds can also be expressed as probability equivalents, such as 50% or 100%. To calculate the probability of an event happening, divide the number of favorable outcomes by the total number of outcomes. For example, if there are two possible outcomes (heads or tails), and one of them is favorable (heads), then the probability of the event happening is 1/2, or 50%.
Odds and probabilities can be used to calculate the chances of winning any game of chance. They can also be used to make decisions about investment opportunities and other risky ventures.
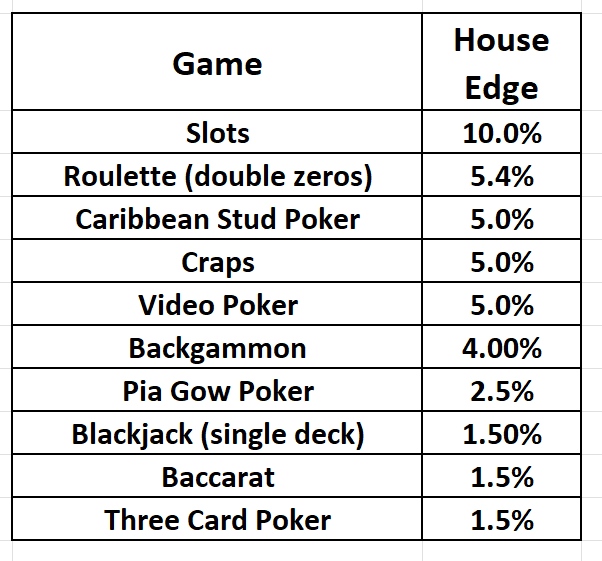
Let’s briefly look at the casino business model, their games of chance, and how they consistently make money. The graphic below shows the most popular games in every casino as well as the established edge the house has. The edge is defined as the mathematical payout that occurs based upon all of the potential outcomes over time.
In slots, the Casino has a 10% edge on the player. This means that for every $100 that is played, they will make 10% of that amount or $10. Essentially it is a license to print money. It’s tantamount to a coin flip game where I pay you 90 cents if you are correct on guessing the right outcome and charge you $1.00 for each toss.
Chances are you’ve seen the billboards in any town where casinos are present promoting a huge slots winner. With a 10% edge the casino simply wants to add millions and millions of plays as the expectations of their success are known in advance.
At first glance these percentages do not seem impressive.
But to think about these numbers accurately simply multiply them by hundreds of billions of dollars.
Casinos are not expecting to win each and every time. But, because of their established edge, they consistently generate revenue.
For example, MGM Grand is the largest casino in the world. In 2020 they generated over $11.4 billion in revenue. This equates to $36 million per day. That’s quite a massive cash flow from exploiting their mathematical edge.
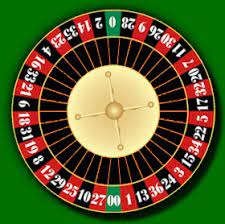
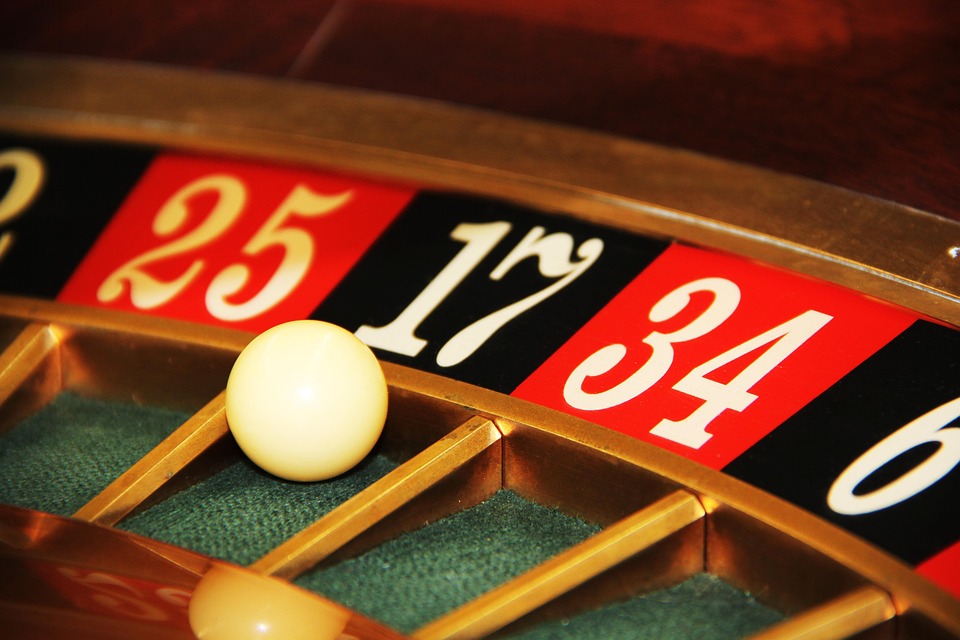
Let’s look at the game of Roulette (double zeros). Double zero roulette is a casino game that is played on a wheel with 38 numbers: 0, 00, and 1 through 36.
There are 18 Red fields on the wheel.
There are 18 Black fields on the wheel.
And there is zero and double zero.
The probability of Red coming up on the wheel is 18/38 or 47.3%
The probability of black coming up is 47.3%
The probability of zero or double zero coming up is 2/38 or 5.26%.
The rules are the same as those of single zero roulette except for the addition of the 00. The double zero gives the house an edge of 5.4%. This is higher than the 2.70% edge in single zero roulette. The odds of any given number coming up are 38 to 1. However, the casinos typically only pay 35 to 1 on a winning bet. This gives them their edge. In other words, for every $1,000 wagered, they can expect to win 5.4% or $54, then if the odds were exactly even. Over time, this can really add up, giving casinos a significant advantage.
What is central to the casino business model is that because of probabilities they always make more than they lose. This is a certainty because of their focus on risk.
How does this all relate to trading?
The casino mentality is completely different than the gambler’s mentality. The gambler is often desperate to change their financial life that they live for the thrill of going all-in in the hopes that lady luck bestows fortune upon them. On the other hand, the casino is focused on its edge. If we enter a coin flipping game and I pay you 90 cents whenever you guess correctly but charge you $1 to play, I will consistently make my 10% money over the long term.
All casinos do likewise.
If a casino risks $1 on Roulette, they expect to payout 94.4 cents on every loser and collect $1 when they are correct. All traders can immediately implement this simple yet powerful lesson.
Most traders ignore the important relationship between trade size, risk, and reward. When these factors are isolated and mathematically sound you are looking at a winning formula.
Every great trader instinctively understands this principle.
Risk must ALWAYS be less than the potential reward if the strategy is to be statistically sound.
In the world of trading, risk is often referred to mathematically as “R.” All great traders copy the casino mentality by making sure that they risk less than their expected reward. If they look at a chart and place their stop loss at $1, if they are going to be successful over the long term, they must have a reward that is greater than $1 consistently.
Let’s do the math.
Let’s say that your strategy wins 50% of the time and loses 50% of the time.
After 1000 trades if you win $1.05 on each trade you made a gross profit of 500 trades times $1.05 = $525.
And if you lose $1.00 times 500 trades, you lost $500. But your net win was positive at $25.
While this is common sense it is often overlooked by even experienced traders. In the world of trading the stakes are higher and most traders hold on to losers and cut winner early. They consistently end up risking more than their reward.
In the trading world, like in any game of chance, you are always confronting risk. There is the possibility of gain and the risk of loss. These two realities are ever-present. Any successful trader will tell you that one of the keys to success is knowing your trading metrics. Top traders look at their performance the same way that a high-performance athlete does. This means more than just knowing your win rate or your profit/loss ratio. To really be successful, you need to track a variety of different metrics and use them to inform and guide your trading decisions. These are not just your performance metrics but the performance of the asset that you are trading. Knowing what the trading terrain looks like is equally challenging.
- What is the probability of the market trading higher?
- What is the probability of the market closing above last month’s highs?
- What is the probability of a market reversal?
- If you lose on this next trade how does that affect your net?
- If you lose on the next 10 trades in a row how does that affect your net?
When it comes to trading in financial markets, there are a few key questions that traders always keep in mind.
First, what is the state of the overall market? Is it in a bull market, bear market, or sideways market?
Second, what is the trend in the specific sector or stock that I’m looking at? Is it moving up, down, or sideways?
Third, what is the current level of volatility? Is it high, low, or somewhere in between?
Fourth, what is the risk/reward profile of the trade? What is my potential loss if the trade doesn’t work out, and what is my potential profit if it does?
Fifth and finally, what is my timeframe for this trade? Am I looking to hold it for a few minutes, a few hours, a few days, or longer?
Answering these questions is what helps traders make statistically informed decisions that focus on your “edge.” All of these isolated items are what A.I. is tracking in keeping a trader on the right side, of the right trend at the right time.
The most important metrics include your risk/reward ratio, your average win rate, and your average loss rate. By tracking these metrics, you develop statistical expectations and expectations just like a casino.
A statistical expectation is the expectancy of an outcome over a given number of trials. For example, if you flip a fair coin, the statistical expectancy of getting tails is 50%. This means that, on average, over many flips, you would expect to get tails 50% of the time. The expectancy of an outcome can be affected by many factors, including the number of trials, the type of event, and any bias that may be present. However, in general, the expectancy of an outcome is a helpful tool for understanding the likelihood of that outcome occurring.
If you look at your most recent 100 trades, you can create an expectancy of what your next 100 trades will look like with a high degree of certainty.
Most traders aren’t going to make it because they ignore the simple foundational concept that expected reward must always be greater than risk if they are to survive. Hope is not a strategy.
Great traders focus on four essentials. Probability, Risk, Reward and Edge.
So, what is your statistical expectancy based upon your last 100 trades?
Do you have an edge in the markets?
What has your performance been over the past year?
What specifically are you doing to make sure your portfolio maintains its purchasing power in light of the inflation the economy is experiencing?
We discuss these ideas and concepts in our Live Training Masterclass which I invite you to attend.
For example, there are hundreds of options trading tactics which, when mastered, can provide the same edge that casinos have.
With A.I., machine learning, and neural networks these technologies are constantly making statistically informed decisions 24/7, 365 days a year on every asset that they track and always looking to maintain and improve their performance.
The Vantagepoint A.I. Software has been independently verified to be 87.4% accurate in forecasting the future trend of the market 24 to 72 hours in advance.
Let’s get candid here:
- The market is brutally honest – there are winners and losers.
- It’s very black and white.
- If you need a friend, get a dog.
- If you are going to win, someone else must lose.
- If survival of the fittest makes you uneasy, stay out of the financial markets.
We live in unique times. The Printing Press is diluting the value of your money.
Everyone is aware that if the money supply grows 20% you must grow your portfolio by that amount just to break even when you look at your purchasing power.
Since artificial intelligence has beaten humans in Poker, Chess, Jeopardy and Go! do you really think trading is any different?
How do you think your investment portfolio compares when pitted against artificial intelligence?
Are you capable of finding those markets with the best risk/reward ratios out of the thousands of trading opportunities that exist?
Knowledge. Useful knowledge. And its application is what A.I. delivers.
You should find out. Join us for FREE Live Training. We’ll show you at least three stocks that have been identified by the A.I. that are poised for big movement… and remember, movement of any kind is an opportunity for profits!
Discover why artificial intelligence is the solution professional traders go-to for less risk, more rewards, and guaranteed peace of mind.
Visit with us and check out the A.I. at our Next Live Training and Learn To Trade Like a Casino.
Discover why Vantagepoint’s artificial intelligence is the solution professional traders go-to for less risk, more rewards, and guaranteed peace of mind.
It’s not magic. It’s machine learning.
Make it count.

IMPORTANT NOTICE!
THERE IS SUBSTANTIAL RISK OF LOSS ASSOCIATED WITH TRADING. ONLY RISK CAPITAL SHOULD BE USED TO TRADE. TRADING STOCKS, FUTURES, OPTIONS, FOREX, AND ETFs IS NOT SUITABLE FOR EVERYONE.
DISCLAIMER: STOCKS, FUTURES, OPTIONS, ETFs AND CURRENCY TRADING ALL HAVE LARGE POTENTIAL REWARDS, BUT THEY ALSO HAVE LARGE POTENTIAL RISK. YOU MUST BE AWARE OF THE RISKS AND BE WILLING TO ACCEPT THEM IN ORDER TO INVEST IN THESE MARKETS. DON’T TRADE WITH MONEY YOU CAN’T AFFORD TO LOSE. THIS ARTICLE AND WEBSITE IS NEITHER A SOLICITATION NOR AN OFFER TO BUY/SELL FUTURES, OPTIONS, STOCKS, OR CURRENCIES. NO REPRESENTATION IS BEING MADE THAT ANY ACCOUNT WILL OR IS LIKELY TO ACHIEVE PROFITS OR LOSSES SIMILAR TO THOSE DISCUSSED ON THIS ARTICLE OR WEBSITE. THE PAST PERFORMANCE OF ANY TRADING SYSTEM OR METHODOLOGY IS NOT NECESSARILY INDICATIVE OF FUTURE RESULTS. CFTC RULE 4.41 – HYPOTHETICAL OR SIMULATED PERFORMANCE RESULTS HAVE CERTAIN LIMITATIONS. UNLIKE AN ACTUAL PERFORMANCE RECORD, SIMULATED RESULTS DO NOT REPRESENT ACTUAL TRADING. ALSO, SINCE THE TRADES HAVE NOT BEEN EXECUTED, THE RESULTS MAY HAVE UNDER-OR-OVER COMPENSATED FOR THE IMPACT, IF ANY, OF CERTAIN MARKET FACTORS, SUCH AS LACK OF LIQUIDITY. SIMULATED TRADING PROGRAMS IN GENERAL ARE ALSO SUBJECT TO THE FACT THAT THEY ARE DESIGNED WITH THE BENEFIT OF HINDSIGHT. NO REPRESENTATION IS BEING MADE THAT ANY ACCOUNT WILL OR IS LIKELY TO ACHIEVE PROFIT OR LOSSES SIMILAR TO THOSE SHOWN.

