
![]()
Scorpio Tankers Inc., together with its subsidiaries, engages in the seaborne transportation of refined petroleum products in the shipping markets worldwide. The company’s fleet consists of 124 owned, finance leased, or bareboat chartered-in tankers, with a weighted average age of approximately 6.2 years. Scorpio Tankers Inc. was incorporated in 2009 and is based in Monaco.
The very first thing you will notice about $STNG is that it is a counter cyclical stock. This means that it moves inversely to the broader stock market.
One of the unusual, yet newsworthy, items is the company is actively promoting that their President recently purchased 2,201 call options of $STNG for $2,488,000. The call option contracts have a strike price of $15.00. Normally, these types of purchases are declared in SEC form 13F, but the company is promoting this purchase through their communications department and through Press Release distribution networks.
We can do the arithmetic on the purchase of the call options, and we can quickly discover that 2,201 January 2023 $15 call options were purchased for $11.30 each. The breakeven price on those call options is $26.30 and the stock is currently trading at $28.79. Since the purchase were announced, the stock has rallied 20%. This purchase implies the President of the company is controlling an additional 220,100 common shares of $STNG. He is not required to hold the purchase till expiration and can liquidate his position at any time. But whenever an insider purchases a large block of stock the assumption is that they are putting their money where their mouth is, and they see positive prospects for the company moving forward. Purchasing the options is a leveraged play where they are putting up 47% of the cash required to purchase the stock. Wall Street has responded very optimistically to this option purchase by a company insider. You can read more about it here.

Timed coincidentally with the release of the call options purchase by $STNG’s President, analysts on Wall Street are forecasting that the company will increase earnings by 65% over the next year. Naturally, this is very bullish.
In this weekly stock study, we will look at and analyze the following indicators and metrics which are our guidelines which dictate our behavior regarding a particular stock.
- Wall Street Analysts’ Estimates
- 52-week high and low boundaries
- Vantagepoint Triple Cross A.I. forecast
- The Best Case – Worst Case Scenarios
- Neural Network Forecast
- Daily Range Forecast
- Intermarket Analysis
- Our trading suggestion
We don’t base our trading decisions on things like earnings or fundamental cash flow valuations. However, we do look at them to better understand the financial landscape that a company is operating under.
Wall Street Analysts’ Estimates
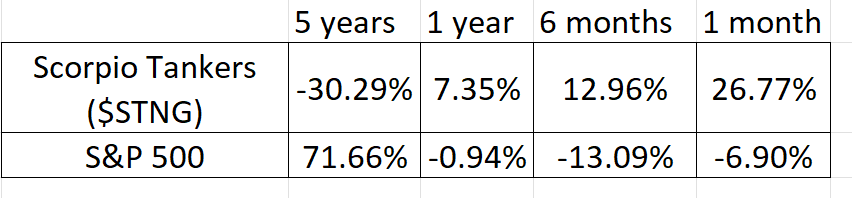
Based on 7 Wall Street analysts offering 12-month price targets for Scorpio Tankers in the last 3 months. The average price target is $32.00 with a high forecast of $41.00 and a low forecast of $24.00. The average price target represents a 11.15% change from the last price of $28.79.
These estimates are quite large in their divergence. The difference between the low estimate of $24 and the high estimate of $41 is $17 which represents 59% of the current stock price.
Whenever we see Wall Street estimates this high it is a sign that we should expect increased volatility in the asset.
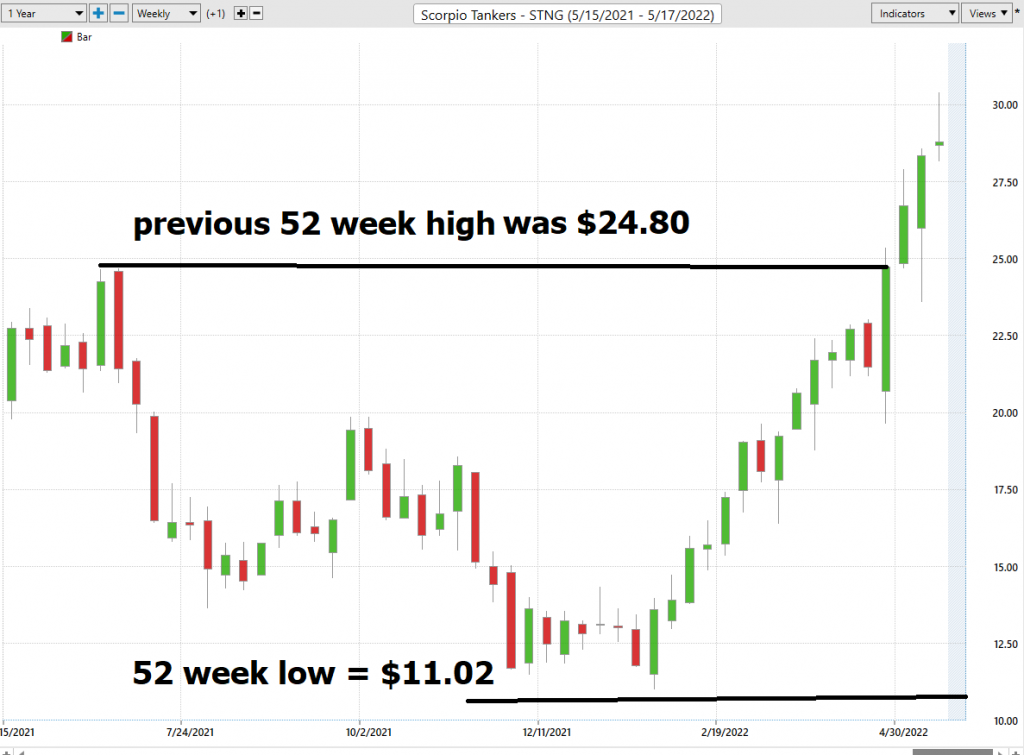
52-Week High and Low Boundaries
Over the past year we have seen $STNG trade as low as $11.02 and as high as $30.40. This tells us that the annual trading range is $19.38.
We also like to divide the annual trading range of $19.38 by the current price of $28.79 to get a broad-based estimate of trading volatility. This tells us that the volatility of $STNG over the past year has been 67.3%. This value also provides us a basic estimate in letting us know that if the future is like the recent past, it would be normal for $STNG to trade in a range that is 67% higher and lower from the current price over the next year.
Based upon this volatility estimate it would be statistically normal to see $STNG trade as high as $48.17 and as low as $9.41 over the next 52 weeks.
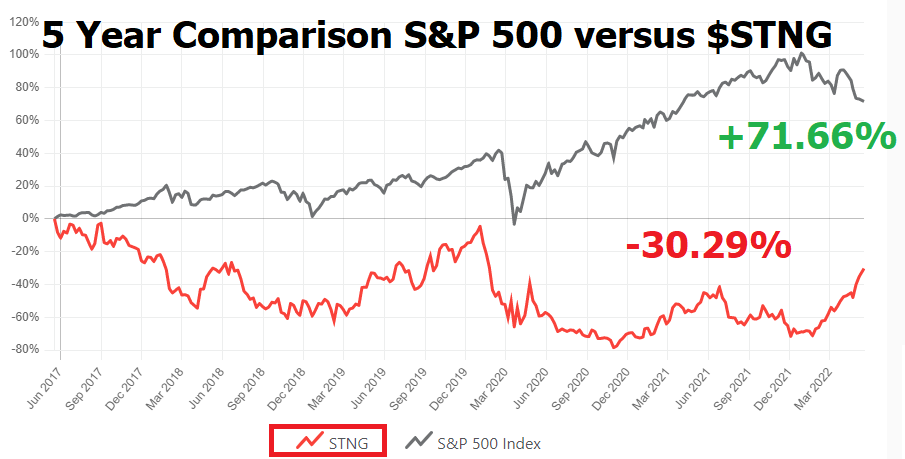
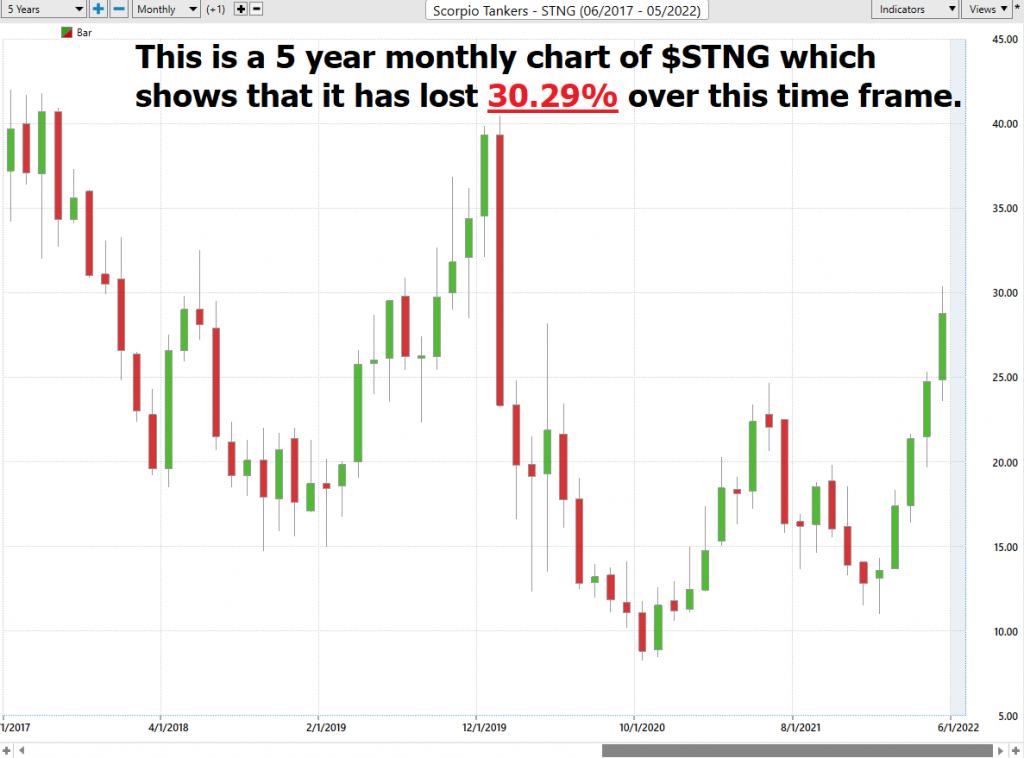
Here is the annual 52 week chart of $STNG so that you can see the powerful price journey it has taken over the longer term time frames.
One of the most powerful trend indicators is simply a stock that continues to make new highs repeatedly. We like the reality that Crude Oil is in a powerful bullish trend and that $STNG is trading at 1-year highs. But my enthusiasm quickly evaporated when I looked at $STNG on the 5-year chart which shows that over the last 5 years it is down 30.29%.
So, in $STNG we see a countercyclical asset that is up 122% in the last 17 weeks but over the longer-term time frames it is still showing negative returns with remarkably high volatility.
Now we compare $STNG to other opportunities in the broader market indexes.
Best Case – Worst Case Scenario $STNG
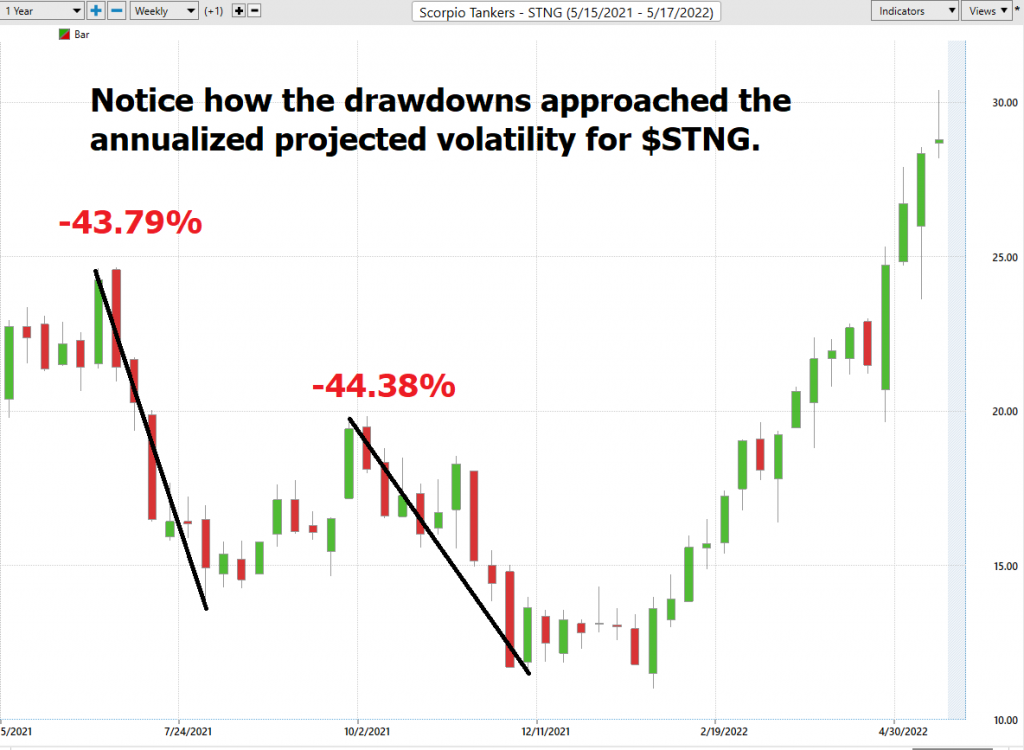
Whenever we look at a trade or long-term investment opportunity to really understand what we are dealing with we need to compare the performance of the asset we are considering with the returns of the major market indexes.
But we also want to get an idea of the best case and worst-case scenarios have been in the asset.
$STNG has traded inverse to the broader stock market indexes.
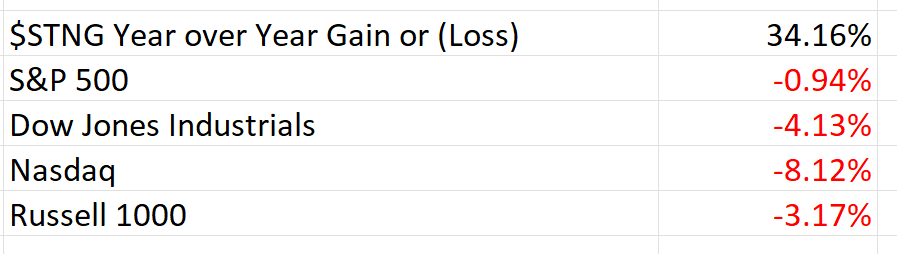
So, we can see that in $STNG we have a countercyclical asset that historically has traded inverse to the broader stock market indexes.
More importantly the drawdowns have been quite large as well. The largest drawdowns were 44.38% peak to trough.
This is clearly shaping up to be a very mixed bag for $STNG. If we expect the broader stock market to suffer, we will look to trade $STNG from the long side. But if we look for the broader market to recover, we expect $STNG to suffer.
The Vantagepoint A.I. Analysis
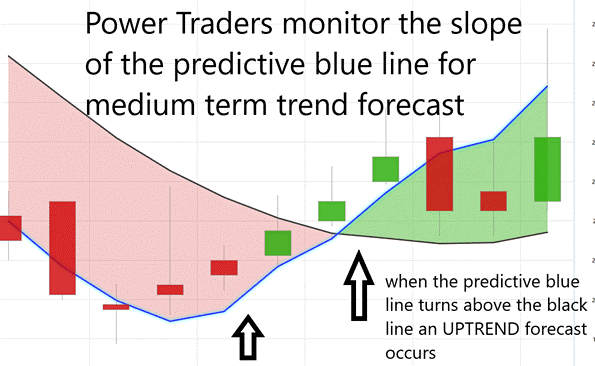
Let’s do some basic trend forecasting analysis based upon looking at the VantagePoint predictive blue line over the last year. On the following chart you will see the power of the VantagePoint Predictive blue line which determines the medium term trend price forecast.
The guidelines we abide by are as follows:
- The slope of the predictive blue line determines the trend and general direction of $STNG
- When the blue line turns above the black line an UP opportunity occurs
- When the blue line turns below the black line a DOWN opportunity occurs
- Ideally, the VALUE ZONE is determined to try and buy the asset at or below the predictive blue line
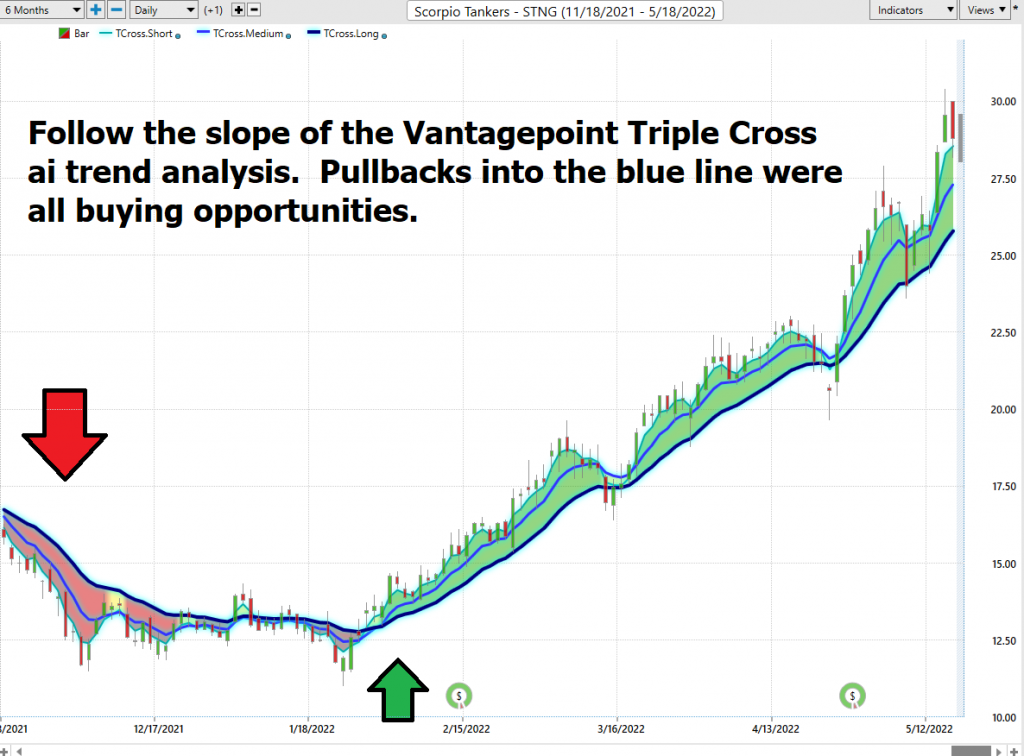
This is the power and effectiveness of the Vantagepoint A.I. forecast in assisting traders to stay on the right side of the trend at the right time.
The world of trading is in the midst of a major upheaval thanks to artificial intelligence. In the past, human traders would make decisions based on their analysis of market conditions. However, they are now being increasingly replaced by a.i. trading software, which is able to make decisions much faster and more accurately. This is having a big impact on the way that market’s function. Overall, artificial intelligence is having a large and disruptive impact on the world of trading.
Fine Tuning Entries with The Neural Net Indicator
At the bottom of the chart is the Neural Network Indicator which predicts future short-term strength and/or weakness in the market. When the Neural Net Indicator is green it communicates strength. When the Neural Net is red it is forecasting short term weakness in the market.
A neural network is a computing system that is modeled after the brain. neural networks are composed of input nodes, output nodes, and hidden nodes. Input nodes receive information from the outside world, while output nodes send information to the outside world. Hidden nodes are neither input nor output nodes; rather, they process information internally. neural networks learn by adjusting the weights of the connections between the nodes. The stronger the connection between two nodes, the more influential that connection is. neural networks can be used for a variety of tasks, including pattern recognition and data classification.
At its essence, a Neural Net is a computational learning system that uses a network of functions to understand and translate massive amounts of data into a desired output, consistently monitoring itself and improving its performance.
Whenever Power Traders are looking for statistically valid trading setups, they look for a DOUBLE confirmation signal. This signal occurs whenever the blue predictive line and the Neural Net at the bottom of the chart suggest the same future expected outcome.
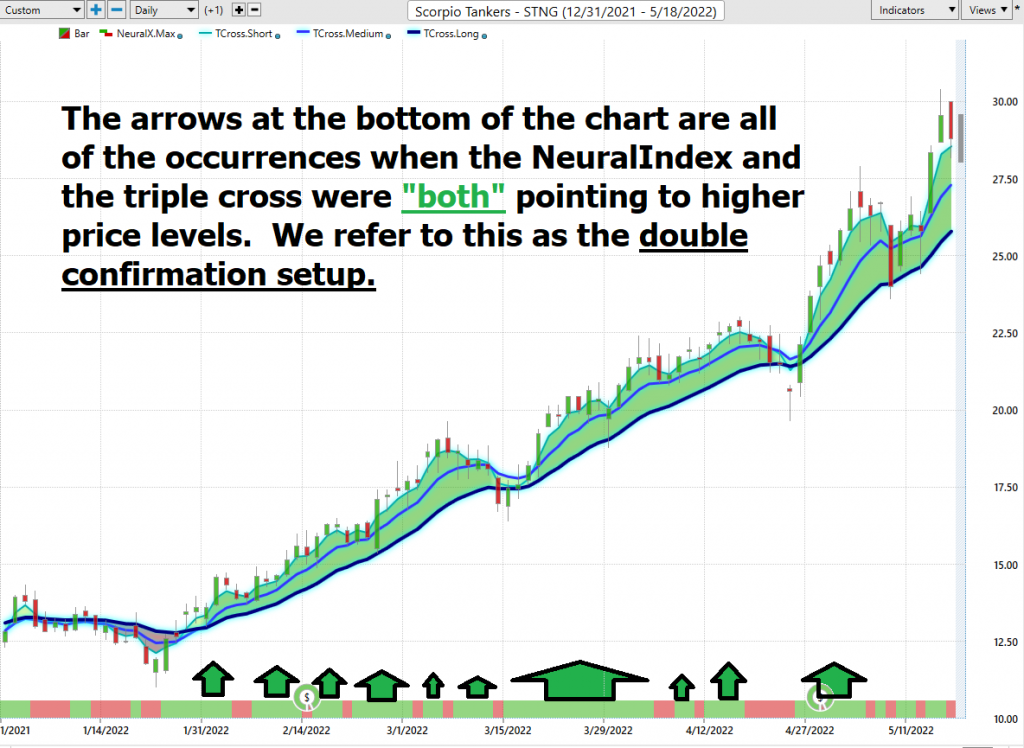
We advocate that Power Traders cross reference the chart with the predictive blue line and neural network indicator to create optimal entry and exit points.
Traders look for confirmation on the Neural Net to position themselves for LONG or SHORT opportunities in the market. In other words, when the A.I. forecast is green, and The Neural Net is green, that presents a buying opportunity.
The inverse is also true, when the A.I. forecast is red and the Neural Net is red, that is a selling opportunity. The arrows on the chart below highlight the trading zones where Power Traders would’ve been using double confirmation to find a buying opportunity in cross referencing the A.I. forecast with the Neural Net.
Power Traders are always looking to apply both the Neural Network and A.I. to the markets to find statistically sound trading opportunities.
VantagePoint Software Daily Price Range Prediction
One of the powerful features in the VantagePoint Software which Power Traders use daily is the Price Range prediction forecast.
This forecast is what permits Power Traders to truly fine tune their entries and exits into the market.
Every day traders are faced with the anxiety and frustration of wondering where they should be looking for opportunities to buy and sell the market. VantagePoint’s A.I. makes this decision super easy with the Daily Price Range Forecast. This is where the rubber meets the road.
Many factors can affect the daily price range of stocks, from global political events to the weather. As a result, forecasting the daily price range is a complex task that requires careful analysis. There are a number of methods that can be used to forecast daily price ranges, including technical analysis, fundamental analysis, and news-based analysis. Technical analysis involves studying past price movements to identify patterns that may provide clues about future price behavior. Fundamental analysis focuses on economic indicators such as company earnings and interest rates. News-based analysis involves tracking breaking news stories that could have an impact on the stock market. Vantagepoint A.I. uses a proprietary algorithm that combines the power of a.i., neural networks and machine learning to provide a daily price range forecast. By using a combination of these methods, it is possible to develop a more accurate forecast of the daily stock market price range.
Here is the price chart of $STNG during the most recent uptrend.
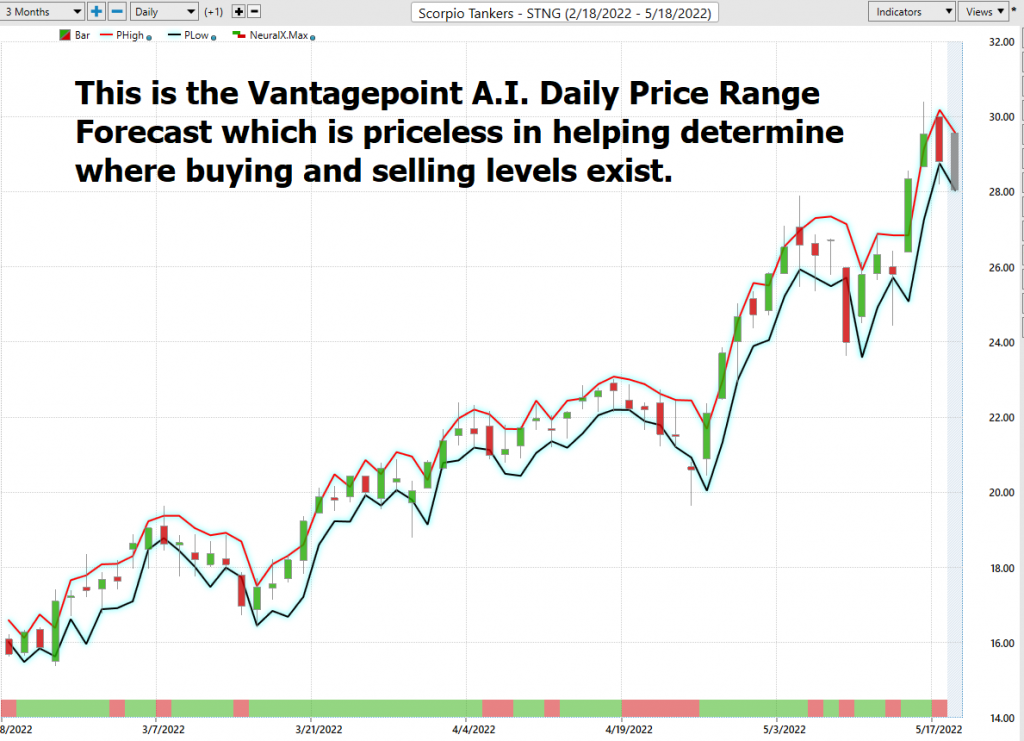
This chart helps traders decide where stop placement should occur. Observe how placing protective sell stops below the dark line on the chart was a powerful way to minimize risk on this trade.
See how the upper and lower bands of the price range forecast for a clear channel of trading activity as well. Swing traders are always looking for opportunities to buy towards the bottom of the predicted channel and selling opportunities above the top band.
Intermarket Analysis
Power lies in the way we respond to the truth we understand.
One of the supremely important questions in trading is what is driving the price? Headlines often create interesting narratives. But these “stories” only capture the imagination. Traders want and need to understand the cause and effect of price movement.
The only way to get an answer to this important question is through intermarket analysis which looks at statistical price correlations of assets.
Intermarket analysis is the study of relationships between different financial markets. It looks at how these markets affect each other, and how they can be used to predict future market movements. By understanding these relationships, traders can make informed decisions about where to allocate their capital. Intermarket analysis can be used to trade a variety of asset classes, including stocks, bonds, commodities, and currencies. There are a number of Intermarket indicators that can be used to identify opportunities, such as price correlations and momentum indicators. By taking the time to understand Intermarket dynamics, traders can give themselves a significant edge in the market.
So, a study of the relationship(s) will prove to be beneficial to a trader.
We live in a global marketplace.
Everything is interconnected.
Interest rates, Crude Oil Prices, and the volatility of the Dollar amongst thousands of other variables affect the decisions companies must make to flourish and prosper in these challenging times. Trying to determine what these factors are is one of the huge problems facing investors and traders.
You always have a choice. You can tune in to the talking heads in the media who spin talking points which promote fear. Or you can rely on facts to base your decision making on.
Within the Intermarket Analysis graphic, you will see the 31 markets that are the key drivers to STNG’s price.
Our Suggestion
While the last 4 months have been incredibly positive for $STNG, the last 5 years the company has massively underperformed the broader market – in a BIG, BIG way. So, I can only muster minimal enthusiasm for an asset with this set of mixed metrics.
On Wall Street countercyclical stocks do very well in market downturns. Th. is what has occurred in $STNG.
We are traders not investors so any trades in $STNG are short term.
If you think that the broader stock market is going to continue massively lower $STNG is a good place to park part of your portfolio.
The large call option purchase by the companies President is a vote of confidence. It implies that the long-term prospects are positive. However, sometimes executives in companies do things for reasons that we can only understand after the fact. Things like loans they receive against the value of the stock of the company are unknown variables that always need to be evaluated by investors.
The weekly and monthly trends are UP.
Momentum is UP.
But the company has another 30% of resistance that it needs to overcome before it reaches its 5-year high. We think there is short term opportunity here, but I am skeptical on the longer-term prospects for the company.
Scorpio Tankers has not formally confirmed its next earnings publication date, but the company’s estimated earnings date is Thursday, August 4th, 2022, based off the prior year’s report dates.
PUT $STNG on your radar and allow the a.i. to guide your trading decisions.
Practice solid money management on all your trades.
We will re-evaluate based upon:
- New Wall Street Analysts’ Estimates
- New 52-week high and low boundaries
- Vantagepoint A.I. Forecast (Predictive Blue Line)
- Neural Network Forecast
- Daily Range Forecast
Let’s Be Careful Out There!
Remember, It’s Not Magic.
It’s Machine Learning.

IMPORTANT NOTICE!
THERE IS SUBSTANTIAL RISK OF LOSS ASSOCIATED WITH TRADING. ONLY RISK CAPITAL SHOULD BE USED TO TRADE. TRADING STOCKS, FUTURES, OPTIONS, FOREX, AND ETFs IS NOT SUITABLE FOR EVERYONE.
DISCLAIMER: STOCKS, FUTURES, OPTIONS, ETFs AND CURRENCY TRADING ALL HAVE LARGE POTENTIAL REWARDS, BUT THEY ALSO HAVE LARGE POTENTIAL RISK. YOU MUST BE AWARE OF THE RISKS AND BE WILLING TO ACCEPT THEM IN ORDER TO INVEST IN THESE MARKETS. DON’T TRADE WITH MONEY YOU CAN’T AFFORD TO LOSE. THIS ARTICLE AND WEBSITE IS NEITHER A SOLICITATION NOR AN OFFER TO BUY/SELL FUTURES, OPTIONS, STOCKS, OR CURRENCIES. NO REPRESENTATION IS BEING MADE THAT ANY ACCOUNT WILL OR IS LIKELY TO ACHIEVE PROFITS OR LOSSES SIMILAR TO THOSE DISCUSSED ON THIS ARTICLE OR WEBSITE. THE PAST PERFORMANCE OF ANY TRADING SYSTEM OR METHODOLOGY IS NOT NECESSARILY INDICATIVE OF FUTURE RESULTS. CFTC RULE 4.41 – HYPOTHETICAL OR SIMULATED PERFORMANCE RESULTS HAVE CERTAIN LIMITATIONS. UNLIKE AN ACTUAL PERFORMANCE RECORD, SIMULATED RESULTS DO NOT REPRESENT ACTUAL TRADING. ALSO, SINCE THE TRADES HAVE NOT BEEN EXECUTED, THE RESULTS MAY HAVE UNDER-OR-OVER COMPENSATED FOR THE IMPACT, IF ANY, OF CERTAIN MARKET FACTORS, SUCH AS LACK OF LIQUIDITY. SIMULATED TRADING PROGRAMS IN GENERAL ARE ALSO SUBJECT TO THE FACT THAT THEY ARE DESIGNED WITH THE BENEFIT OF HINDSIGHT. NO REPRESENTATION IS BEING MADE THAT ANY ACCOUNT WILL OR IS LIKELY TO ACHIEVE PROFIT OR LOSSES SIMILAR TO THOSE SHOWN.

