

Statistical analysis is used in a wide variety of fields, from the natural sciences to the social sciences, in order to better understand the relationships between different variables.
At its essence, statistics attempts to define what is “normal” and what is “not normal.” This perspective is helpful to traders, because they can be alerted to “not normal” occurrences that traditionally help identify the beginning and end of relationships which we as traders refer to as trends. Successful quantitative traders often quip that there “ain’t no money in normal.” By focusing energy and resources on “not normal” occurrences, traders are far ahead of the crowd in uncovering opportunities to profit.
Statistical methods help traders to design systems, test hypotheses, and draw conclusions from data. In addition, statistical methods can be used to make predictions about future events. Statistical analysis is a valuable tool for anyone who wants to make sense of data.
Whether you realize it or not, we are always attempting to define “normal” in everything we do.
The temperature outside can have a very wide variance, but regardless of where you live, you have a pretty good idea of how “normal” is defined. The “normal” speed with which most drivers drive on a road is how law enforcement, will statistically define “not normal” and pursue those who violate this quantitative boundary. Health professionals use an individual’s vital signs to diagnose “not normal” conditions and prescribe solutions. Insurance companies are in the business of defining RISK specifically by how they perceive “normal” and “not normal.”
In the world of trading, it is important for traders to be data-driven and to use statistics to make better trading decisions. Great traders are keenly aware that huge opportunity occurs when “not normal” conditions present themselves.
Let me explain.
Probability theory is the branch of mathematics that deals with the analysis of random phenomena. The central idea of probability theory is that of a mathematical model for random events.
This model can be used to predict the likelihood of certain events happening, and to make decisions based on these predictions. Probability theory is a powerful tool, and it has applications in many different fields, from finance to physics.
One of the most famous probabilistic models is the coin toss model, which is used to illustrate the basic principles of probability theory. In this model, a coin is tossed a number of times, and the probabilities of various outcomes are calculated. For example, the probability of getting heads on each toss is 1/2, and the probability of getting tails on each toss is also 1/2. The coin toss model can be used to calculate the probabilities of more complicated events, such as the likelihood of getting a certain number of heads in a row. Probability theory is a fascinating subject, and it can be used to answer many questions about the world around us. It is used every day in business to anticipate outcomes, define risk and the probability of risk versus reward.
The probability of you flipping a head on your first toss is 50%.
The probability of you flipping two heads in a row is 50% times 50% or 25%.
The probability of you flipping three heads in a row is 50% times 50% times 50% or 12.5%.
You can continue with this process to infinity if you choose.
The odds you flipping 10 heads in a row are 1 out of 1024.
What I am trying to illustrate in this remarkably simple example, is that the probability of one toss is 50%. The probability of half your tosses being heads and half being tails is 50%. But the statistical probabilities state that as a consistent streak develops in a coin toss, the probabilities favor that a regression trend back to “normal” will eventually occur.
As a speculator, if I were to bet on the outcome of a single coin toss, I would want to be alerted every time a streak of 5 or more heads or tails in a row occurred, simply because the probabilities of the streak continuing are less than the trend returning to normalcy.
Would I win every time?
Absolutely not. But I would be trading with the probabilities in my favor.
The foundation of statistical analysis is rooted in looking at large datasets and calculating how much dispersion exists relative to the average. This is referred to as the standard deviation.
The standard deviation is a measure of how spread-out numbers are in a data set. It’s represented by the Greek letter sigma (σ).
Standard deviation is the central tool that statisticians use to make sense of data sets. It allows them to see how much variation there is within a data set and to compare different data sets so that certain outcomes can be predicted with a remarkably high degree of certainty.
A bell curve is the statistical distribution that is often used to represent data sets. The curve is named for its shape, which resembles a bell. The bell curve is also sometimes referred to as a normal distribution. Statisticians use the bell curve to interpret data sets in order to understand probabilities. The higher the peak of the bell, the more likely it is that an event will occur. The further the data is from the mean, the less likely it is that the event will occur. The bell curve can be used to predict everything from test scores to election results. As a result, it is an essential tool for statisticians.
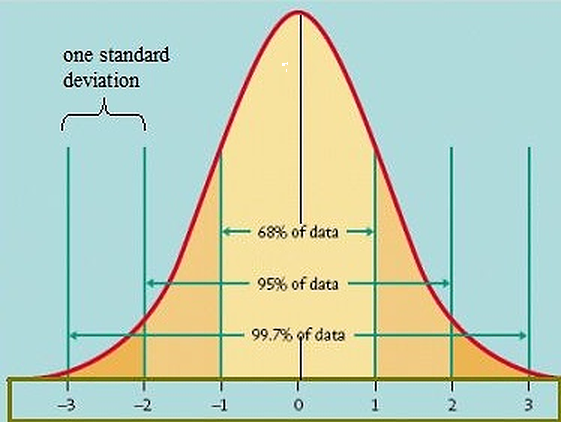
The graphic above shows you a normal bell curve distribution. The average is at the ZERO intercept.
The positive and negative values represent the standard deviation.
Here are the important things to remember:
- 68% of the time, results will fall within +1 or -1 standard deviation.
- 95% of the time, results will fall within +2 or -2 standard deviations.
- 99% of the time, results will fall within +3 or -3 standard deviations.
This is the framework that statisticians use to define “normal” and “not normal” and define risk. It pretty much applies to almost everything.
Anything, outside of the +1 to -1 standard deviations is considered not normal. This is the 95% to 99% boundary of starting to define outliers and extremes. These are the opportunities that traders live for.
Let’s look at how traders can utilize this knowledge to improve their trading.
Standard deviation is often used in trading to measure the volatility of a security or market. By understanding how volatile a security is, traders can better gauge the probability of it moving in a certain direction. A security with high volatility is more likely to make big moves, while a security with low volatility is more likely to move in a tight range. By understanding standard deviation theory, traders can better assess the risk and potential reward of a trade and make more informed decisions about when to enter and exit a position.
Some traders use standard deviation to set stop-loss orders, which can help to limit losses in the event of a sudden price movement. Others use standard deviation to identify potential breakout points, which can offer opportunities for profit. In short, standard deviation theory can be a useful tool for traders who are looking to improve their results.
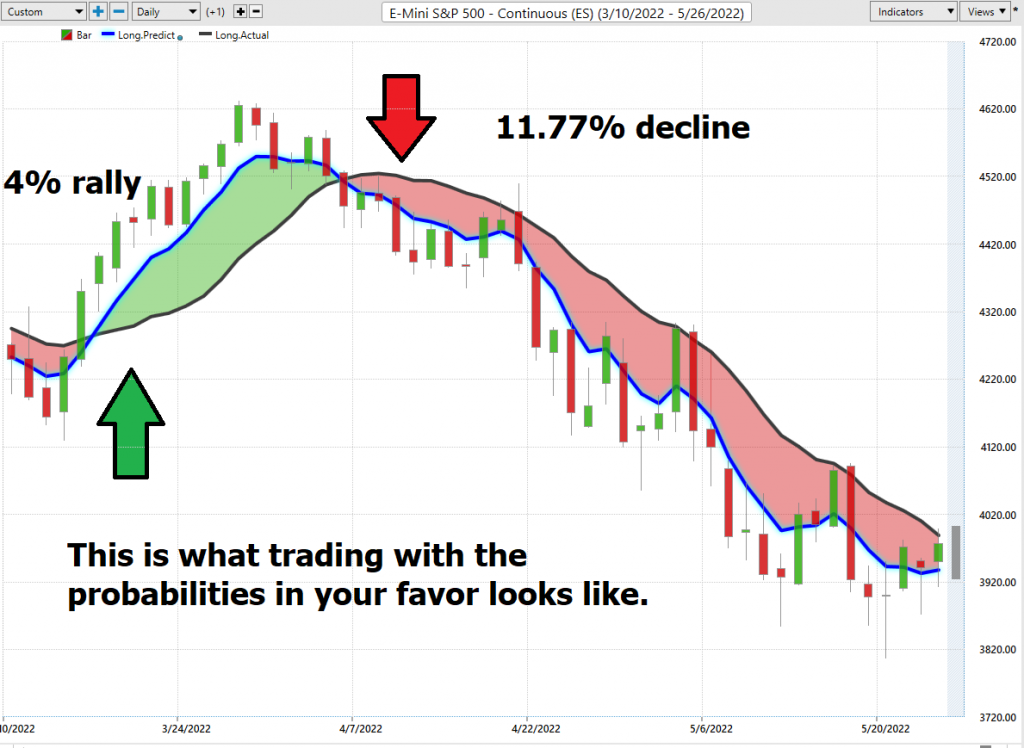
In trading, there are a lot of distinct factors to consider. But one of the most important things to think about is probability. Probability is the likelihood that something will happen. And in trading, you want to make sure that you’re always trading with the probabilities in your favor. That means understanding the market conditions and making trades that have a higher likelihood of success. It can take a lot of practice and experience to be able to do this consistently. But if you can learn how to trade with the probabilities in your favor, it will give you a big advantage in the market.
Here is a graphic which is my attempt to simplify this topic. The picture below is a statistical analysis of the SPY Index covering the weekly % change.
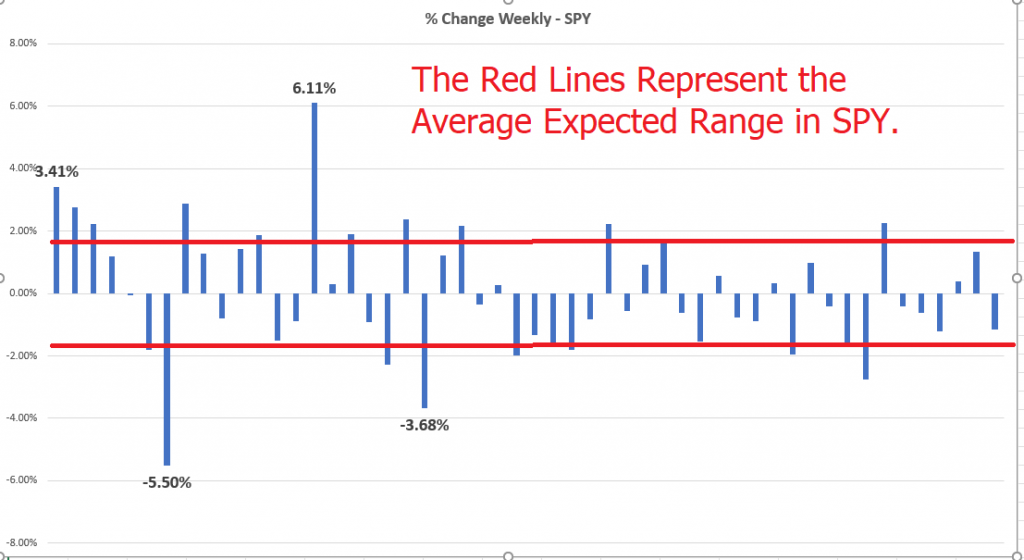
This is how “NORMAL” is defined in the SPY Index.
Better than two thirds of the time the prices stayed between + or – 1.75% of the previous weekly close.
Of course, there are outliers. Look at what happens at the extremes when breakouts occur. The tendency is for a return to normal.
But just being aware of how “normal” is defined in a market is the fastest and simplest way to minimize risk. If you know that the average weekly range in SPY is 1.75%, you can use this fact to define profit objectives, as well as entry and stop-loss targets.
This is very similar to how quant traders trade. Quantitative traders use mathematical models to analyze financial markets and make trades. They typically have a strong background in risk management and calculus, as well as linear algebra and statistics. Quantitative trading is a relatively new field, and it is becoming increasingly popular due to the increasing complexity of financial markets. It is all about building and exploiting a mathematical edge in the markets by always weighing the probabilities and the potential reward.
Simply being aware of these metrics will improve your trading decisions as it provides historic proof of what the realities of the marketplace are.
Creating this framework is very time-consuming in the absence of software. But today, this kind of heavy living and quantitative analysis is done for traders by artificial intelligence. You don’t need to have a background in statistics, math or linear algebra!
Perhaps, best of all, a.i. is always improving, meaning that its benefits accrue over time.
Artificial Intelligence is always analyzing, comparing, and quantifying to determine what the best move forward is.
How? By looking at all of the previous history in the data set and comparing outcomes.
Today it is by far, the most effective way to trade.
A picture is worth a thousand words.
By analyzing large data sets, a.i. can identify patterns that would be impossible to spot with the human eye. This is how traders trade with the probabilities consistently in their favor.
A.i. also helps decision-makers by providing recommendations on how to avoid risks altogether. As a result, traders are flocking to a.i. to help them manage risk more effectively by focusing your time, energy, and resources on those markets with the highest probability of trend continuations occurring.
How have you done in your trading so far in 2022?
Do you have the tools to find the best high probability trades?
The purpose of artificial intelligence is to keep traders on the right side of the right trend at the right time. That is what makes it so valuable.
In the present trading environment, only 18% of stocks are trading above their 200-day moving average.
Success in these markets is all about who has the best tools.
Let’s get candid here:
The market is brutally honest – there are winners and losers.
It’s very black and white.
If you need a friend, get a dog.
If you are going to win, someone else must lose.
If survival of the fittest makes you uneasy, stay out of the financial markets.
We live in unique times. The Printing Press is diluting the value of your money.
Artificial intelligence is so powerful because it learns what doesn’t work, remembers it, and then focuses on other paths to find a solution. This is the Feedback Loop that is responsible for building the fortunes of every successful trader I know.
If you think about this question, you will begin to appreciate that AI applies mistake prevention to discover what is true and workable. Artificial Intelligence applies the mistake prevention as a continual process 24 hours a day, 365 days a year towards whatever problem it is looking to solve.
That should get you pretty excited because it is a game-changer.
It sounds very elementary and obvious. But overlooking the obvious things often hurt a traders’ portfolio.
The basics are regularly overlooked by inexperienced traders.
It is incredibly sad, and unnecessary in today’s day and age of machine learning and artificial intelligence.
Bad Traders Obsess on the SHOULD. Every other word out of their mouths’ is SHOULD.
I can’t recall how many times a trader has told me all the reasons why his portfolio is heavily invested in a stock because of a great story, despite the stock being in a firm downtrend. It is horribly painful to listen to.
The beauty of neural networks, artificial intelligence and machine learning is that it is fundamentally focused on pattern recognition to determine the best move forward. When these technologies flash a change in forecast it is newsworthy. We often do not understand why something is occurring but that does not mean that we cannot take advantage of it.
Most humans have a really tough time learning from bad experiences. The ego gets in the way, each and every time.
Since artificial intelligence has beaten humans in Poker, Chess, Jeopardy and Go, do you really think trading is any different?
Knowledge. Useful knowledge. And its application is what A.I. delivers.
You should find out. Join us for a FREE Live Training.
We’ll show you at least three stocks that have been identified by the A.I. that are poised for big movement… and remember, movement of any kind is an opportunity!
Visit with us and check out the A.I. at our Next Live Training and learn how traders use statistics to improve their trading results.
Discover why Vantagepoint’s artificial intelligence is the solution professional traders go-to for less risk, more rewards, and guaranteed peace of mind.
It’s not magic. It’s machine learning.
Make it count.

IMPORTANT NOTICE!
THERE IS SUBSTANTIAL RISK OF LOSS ASSOCIATED WITH TRADING. ONLY RISK CAPITAL SHOULD BE USED TO TRADE. TRADING STOCKS, FUTURES, OPTIONS, FOREX, AND ETFs IS NOT SUITABLE FOR EVERYONE.
DISCLAIMER: STOCKS, FUTURES, OPTIONS, ETFs AND CURRENCY TRADING ALL HAVE LARGE POTENTIAL REWARDS, BUT THEY ALSO HAVE LARGE POTENTIAL RISK. YOU MUST BE AWARE OF THE RISKS AND BE WILLING TO ACCEPT THEM IN ORDER TO INVEST IN THESE MARKETS. DON’T TRADE WITH MONEY YOU CAN’T AFFORD TO LOSE. THIS ARTICLE AND WEBSITE IS NEITHER A SOLICITATION NOR AN OFFER TO BUY/SELL FUTURES, OPTIONS, STOCKS, OR CURRENCIES. NO REPRESENTATION IS BEING MADE THAT ANY ACCOUNT WILL OR IS LIKELY TO ACHIEVE PROFITS OR LOSSES SIMILAR TO THOSE DISCUSSED ON THIS ARTICLE OR WEBSITE. THE PAST PERFORMANCE OF ANY TRADING SYSTEM OR METHODOLOGY IS NOT NECESSARILY INDICATIVE OF FUTURE RESULTS. CFTC RULE 4.41 – HYPOTHETICAL OR SIMULATED PERFORMANCE RESULTS HAVE CERTAIN LIMITATIONS. UNLIKE AN ACTUAL PERFORMANCE RECORD, SIMULATED RESULTS DO NOT REPRESENT ACTUAL TRADING. ALSO, SINCE THE TRADES HAVE NOT BEEN EXECUTED, THE RESULTS MAY HAVE UNDER-OR-OVER COMPENSATED FOR THE IMPACT, IF ANY, OF CERTAIN MARKET FACTORS, SUCH AS LACK OF LIQUIDITY. SIMULATED TRADING PROGRAMS IN GENERAL ARE ALSO SUBJECT TO THE FACT THAT THEY ARE DESIGNED WITH THE BENEFIT OF HINDSIGHT. NO REPRESENTATION IS BEING MADE THAT ANY ACCOUNT WILL OR IS LIKELY TO ACHIEVE PROFIT OR LOSSES SIMILAR TO THOSE SHOWN.

