

Last October we featured Callon Petroleum in our Weekly Stock Study. In that analysis which you can find here, we concluded:
“We think that on any pullbacks traders should use the a.i. daily price range forecast to get long CPE. While we anticipate some resistance at the 52-week highs at 61 we think this is a massive bull market that is underway.”
It has been almost 8 months since that analysis, and we think it is time to revisit this trading opportunity based upon the strong bullish trend in Crude Oil and the strong consolidation that has occurred in $CPE over the past year. What is most impressive about $CPE is that it has traded inversely to the broader stock market. Everybody is looking for a safe haven since the stock market has been in decline.
At Vantagepoint A.I. we pride ourselves on being data-driven. The artificial intelligence, machine learning and neural networks is constantly looking to make the best move forward based upon thousands of computations.
When you combine a.i. with good old common sense you can harness opportunities that others are oblivious to.
Here is a chart of Crude Oil over the last 10 years. Simply observe what is most obvious.
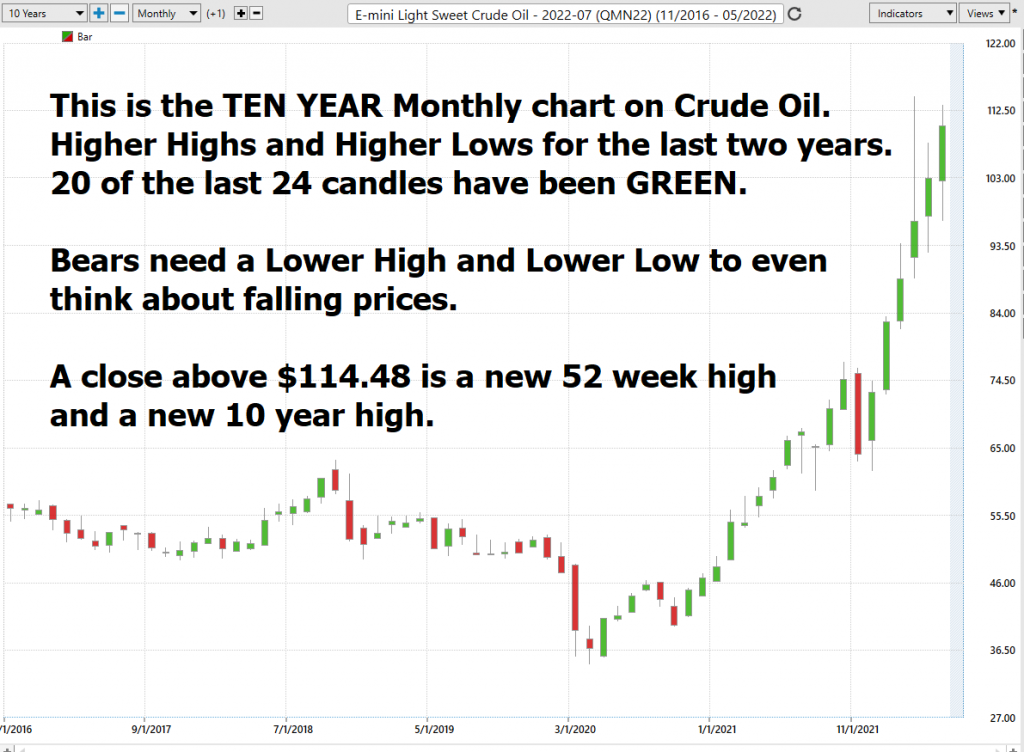
When I simply eyeball a Crude Oil Chart, I see that the TREND is UP.
Crude Oil prices are UP 82% year over year.
Common sense would tell us that since the broader stock market is down 20% year to date. So, we would want to look to trends that are heavily correlated to Crude Oil prices.
Stated another way, if you want to WIN you simply need to discover which companies and sectors of the market are winning.
$CPE is currently 54% correlated to Crude Oil. That means that 54% of the time when Crude Oil rises $CPE will also increase in price.
In the last 12 months, Crude Oil is up 82% while $CPE is up 36%.
Over the last year the top performing sectors have been petroleum and oil exploration stocks. All these factors confirm that a global energy crunch is underway, and we should anticipate more supply chain disruptions.
In this weekly stock study, we will look at and analyze the following indicators and metrics which are our guidelines which dictate our behavior in deciding whether to look for opportunities to buy, sell, or stand aside on a particular stock.
- Wall Street Analysts’ Estimates
- 52-week high and low boundaries
- Vantagepoint A.I. Forecast (Predictive Blue Line)
- The Best Case – Worst Case Scenarios
- Neural Network Forecast
- Daily Range Forecast
- Intermarket Analysis
- Our trading suggestion
We don’t base our trading decisions on things like earnings or fundamental cash flow valuations. However, we do look at them to better understand the financial landscape that a company is operating under.
Wall Street Analysts’ Estimates
In October 2021, 13 Wall Street Analysts were offering 12-month price forecasts on $CPE ranging in price from $37 on the low side to as high as $75 with a median price of $50.
With the benefit of 20/20 hindsight buying breaks down to the media’s estimated forecast at $50 was a winning strategy.
Over the past several months these same analysts are now upgrading their forecasts. The stock closed yesterday at $50.50. The average price target is $88.00 with a high forecast of $140.00 and a low forecast of $71.00. The average price target represents a 74.26% change from the last price of $50.50.
Wall Street is telling us that the smartest minds who track $CPE 24/7 think that the lowest price target for the next 12 months is $71. To say we are undervalued is an understatement.
52-Week High and Low Boundaries
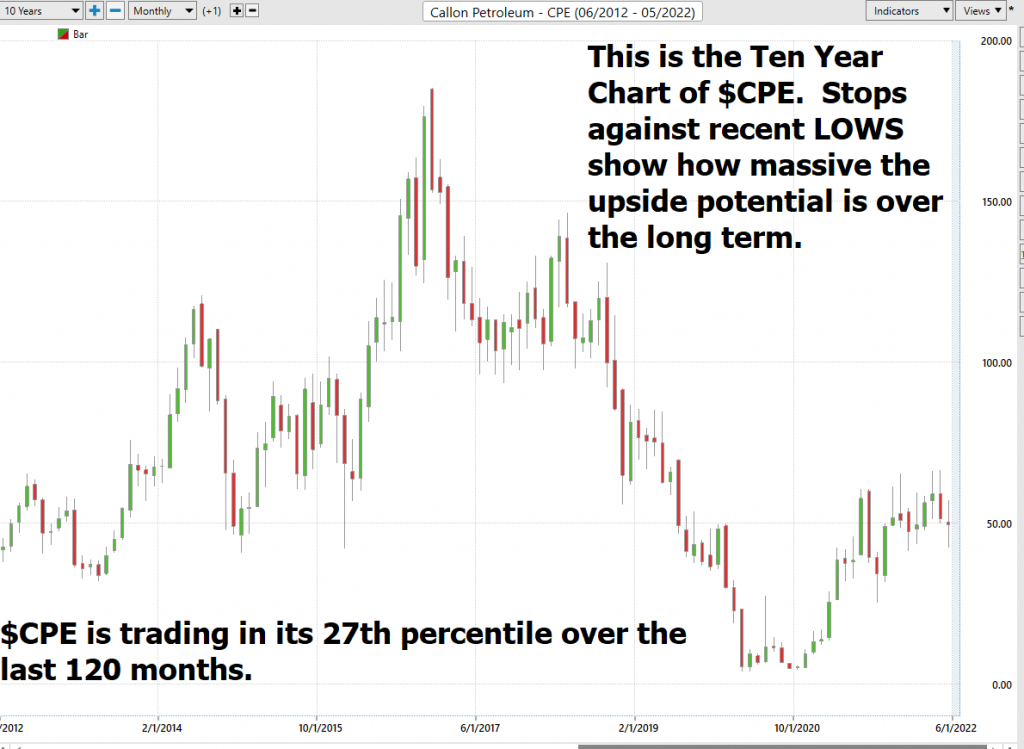
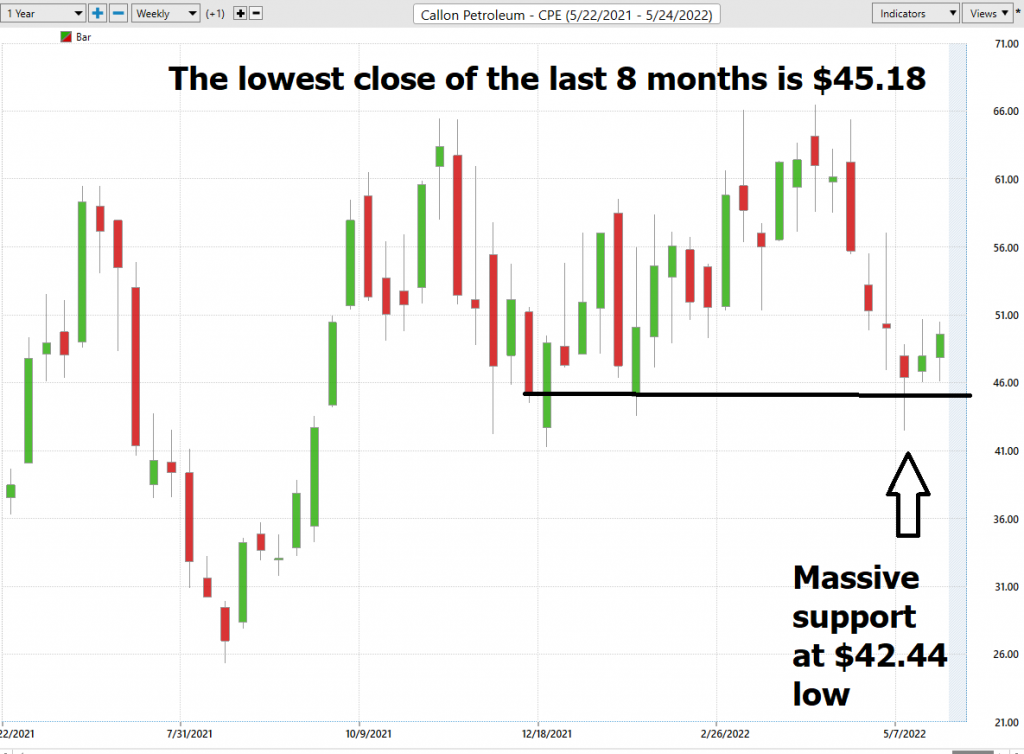
Looking at the Long-Term chart of CPE provides us with the 52-week high and low boundaries.
Over the past year we have seen CPE trade as low as $25.32 and as high as $66.48. This tells us that the average weekly trading range for CPE is $.79. This represents an annualized volatility of 81.5%, which is exceedingly high. But it is these high volatility markets where the a.i. excels in both keeping traders on the right side of the trend.
Over the past eight months we have seen heavy selling occur at any price over $63.38 which is the highest weekly close and we have seen heavy buying occur at $45 and under.
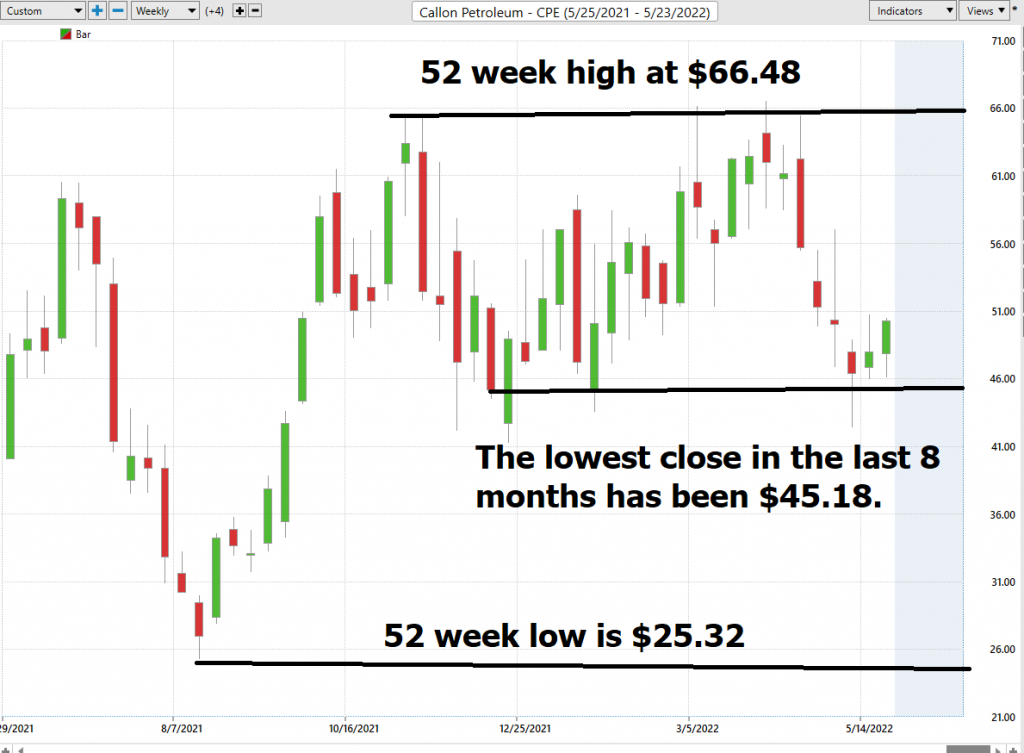
We like to study the 52-week chart before doing anything else just so that we can get a feel for how the company has performed over the past year and compare that to other opportunities and the broader market indexes.
Based only upon this information and the current market structure, I assume that huge buy orders are in the market slightly above the 52-week high price of $66.48.
Place these boundaries on your radar and pay attention.
Best Case – Worst Case Scenario $CPE
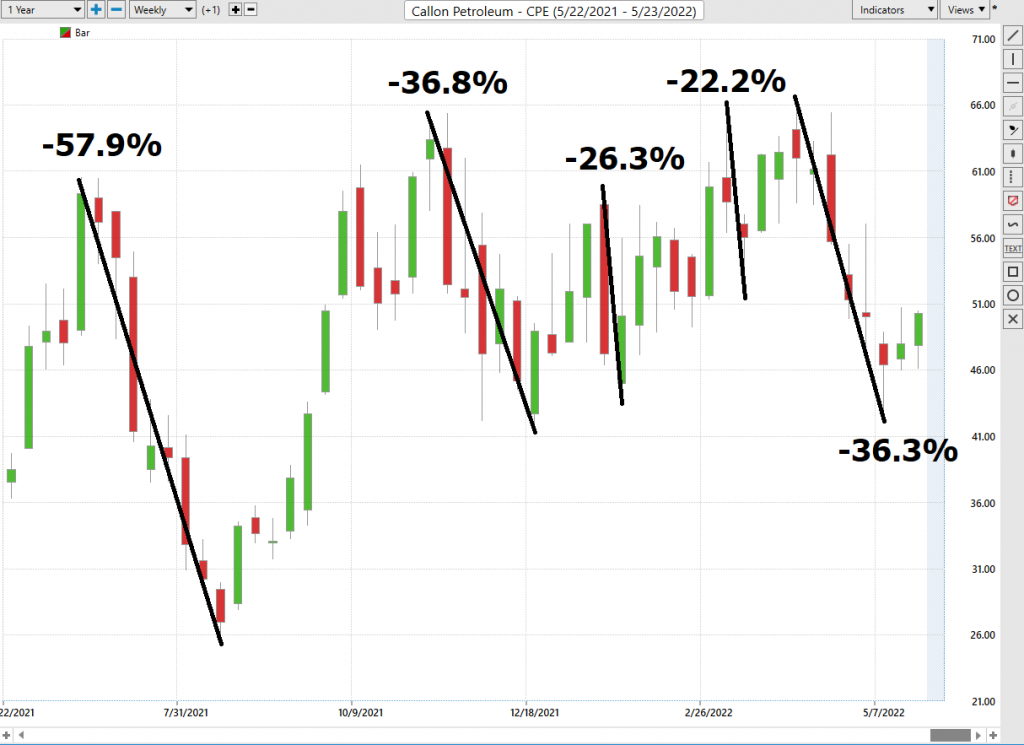
The chart below shows the numerous sharp declines that CPE had over the past year.
Earlier we mentioned that the annualized volatility in $CPE is 81%. That is calculated by taking the annual range 41.16 and dividing by the most recent closing price of $50.50.
You can use the method to calculate the volatility zone on the weekly and monthly time frames. Simply look at the trading range for the time frame in question and divide it by the current closing price.
This is extremely high volatility, and we would advise traders who are unfamiliar with volatile markets to steer clear. However, Power Traders will use these sudden sharp declines and monitor the a.i. and forecasted daily trading ranges for short-term swing trading opportunities.
The declines ranged from 22% and as much as 57.9%. The stock falls much faster than it rises.
Market rallies ranged from 20% to 132%.
What we can learn from this basic worst-case analysis is that CPE could EASILY fall 30% to 57% in a period of weeks. Should this occur, this asset should immediately go on your trading radar, and you should wait for the A.I. forecast to signal an UPTREND. Each time this occurred the up moves were swift and dramatic.
Study the chart and you can see this recently occurred and has created great opportunities for Power Traders.
This price volatility is ideal for SWING traders who can exploit the upside without having to experience the steep decline.
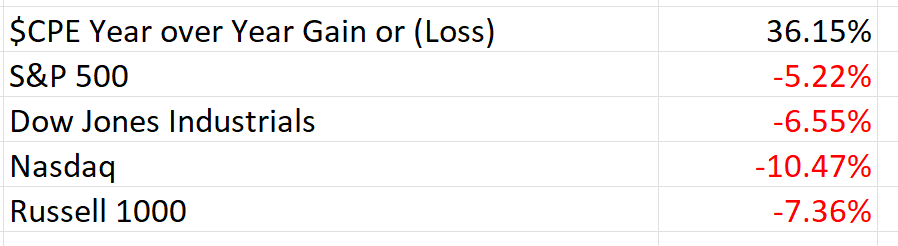
Next, we compare $CPE to the performance of the broader stock market indexes.
What we can learn from this basic worst-case analysis is that CPE could EASILY fall 30% to 57% in a period of weeks. Should this occur, this asset should immediately go on your trading radar, and you should wait for the A.I. forecast to signal an UPTREND. Each time this occurred the up moves were swift and dramatic.
Study the chart and you can see this recently occurred and has created great opportunities for Power Traders.
This price volatility is ideal for SWING traders who can exploit the upside without having to experience the steep decline.
Next, we compare $CPE to the performance of the broader stock market indexes.

You can see that in spite of all of its consolidation over the past 8 months is has massively outperformed the broader stock market indexes. As the broader stock market has moved south the petroleum stocks have moved higher.
The Vantagepoint A.I. Analysis
The guidelines we abide by are as follows:
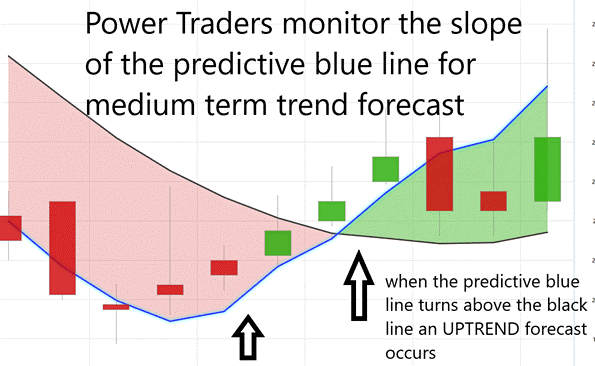
- The slope of the predictive blue line determines the trend and general direction of CPE
- Ideally, the VALUE ZONE is determined to try and buy the asset at or below the predictive blue line.
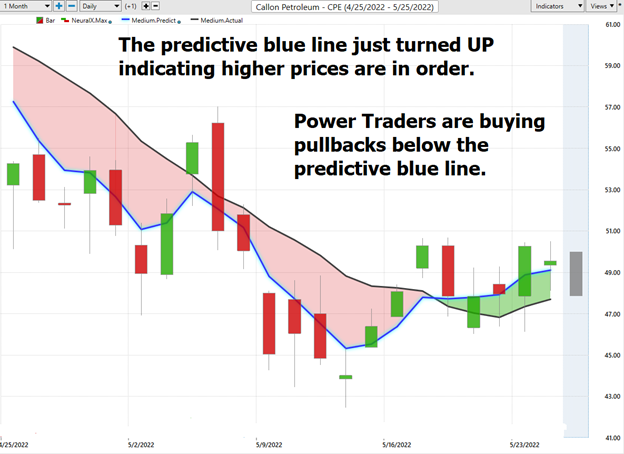
Here is a snapshot of last year’s price action.
Let’s zoom in on the last three months of price action in Callon Petroleum.
The lowest close of the last 8 months is $45.18. The lowest price over this same period is $42.44. This area has created 2 previous spike lows, both which have created 20% to 30% rallies.
Neural Network Indicator (Machine Learning)
At the bottom of the chart is the Neural Network Indicator which predicts future short-term strength and/or weakness in the market. When the Neural Net Indicator is green it communicates strength. When the Neural Net is red it is forecasting short term weakness in the market.
A Neural Net is a computational learning system that uses a network of functions to understand and translate massive amounts of data into a desired output, consistently monitoring itself and improving its performance.
Whenever Power Traders are looking for statistically valid trading setups, they look for a DOUBLE confirmation signal. This signal occurs whenever the blue predictive line and the Neural Net at the bottom of the chart suggest the same future expected outcome.
We advocate that Power Traders cross reference the chart with the predictive blue line and neural network indicator to create optimal entry and exit points.
Traders look for confirmation on the Neural Net to position themselves LONG or SHORT in the market. In other words, when the A.I. forecast is green, and The Neural Net is green, that presents a buying opportunity.
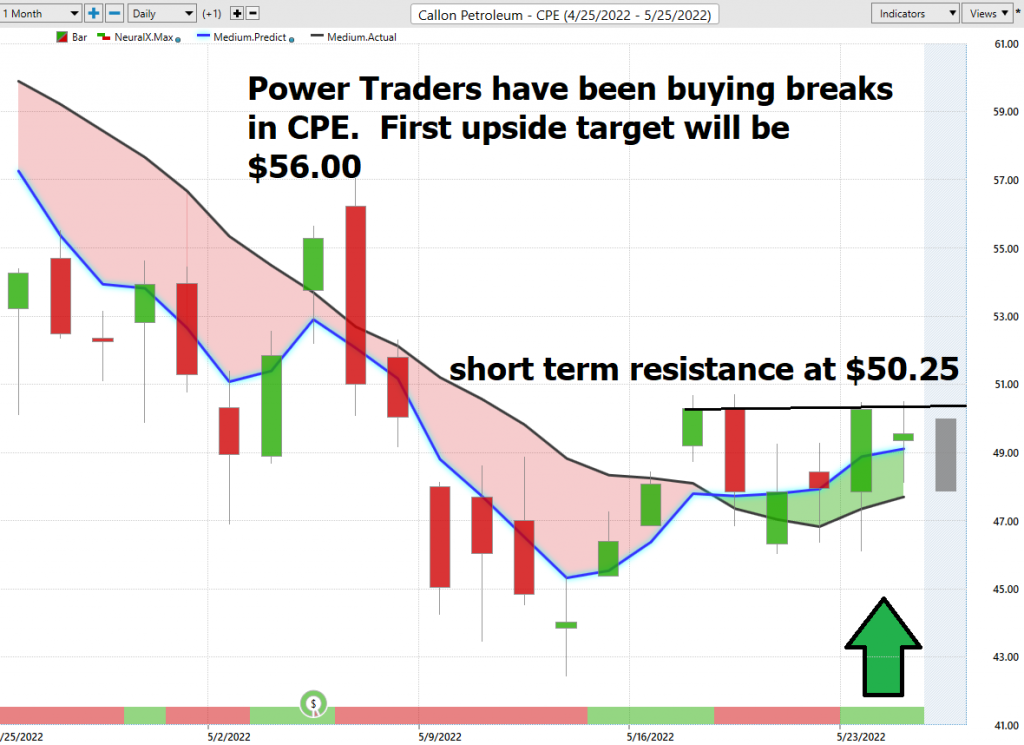
The inverse is also true, when the A.I. forecast is red and the Neural Net is red, that is a SELLING opportunity. The arrows on the chart below highlight the trading zones where Power Traders would’ve been using double confirmation to find a BUYING opportunity in cross referencing the A.I. forecast with the Neural Net.
Power Traders are always looking to apply both the Neural Network and A.I. to the markets to find statistically sound trading opportunities.
A solid close above the short term resistance bodes very well for $CPE.
VantagePoint Software Daily Price Range Prediction
One of the powerful features in the VantagePoint Software which Power Traders use daily is the Price Range prediction forecast.
This forecast is what permits Power Traders to truly fine tune their entries and exits into the market.
Every day traders are faced with the anxiety and frustration of wondering where they should be looking to buy and sell the market. VantagePoint’s A.I. makes this decision super easy with the Daily Price Range Forecast.
For short term traders the important question that they have to confront every day is where should I buy? Where should I place my stop? Where should I sell? The VantagePoint Daily Price Range forecast can help them answer this question.
Here is the price chart of CPE during the most recent two months.
Observe how the channel is very clearly delineated and it is very easy to observe where anticipated support and resistance over the short terms are. Traders look to buy near the bottom of the channel and sell at or above the top of the channel.
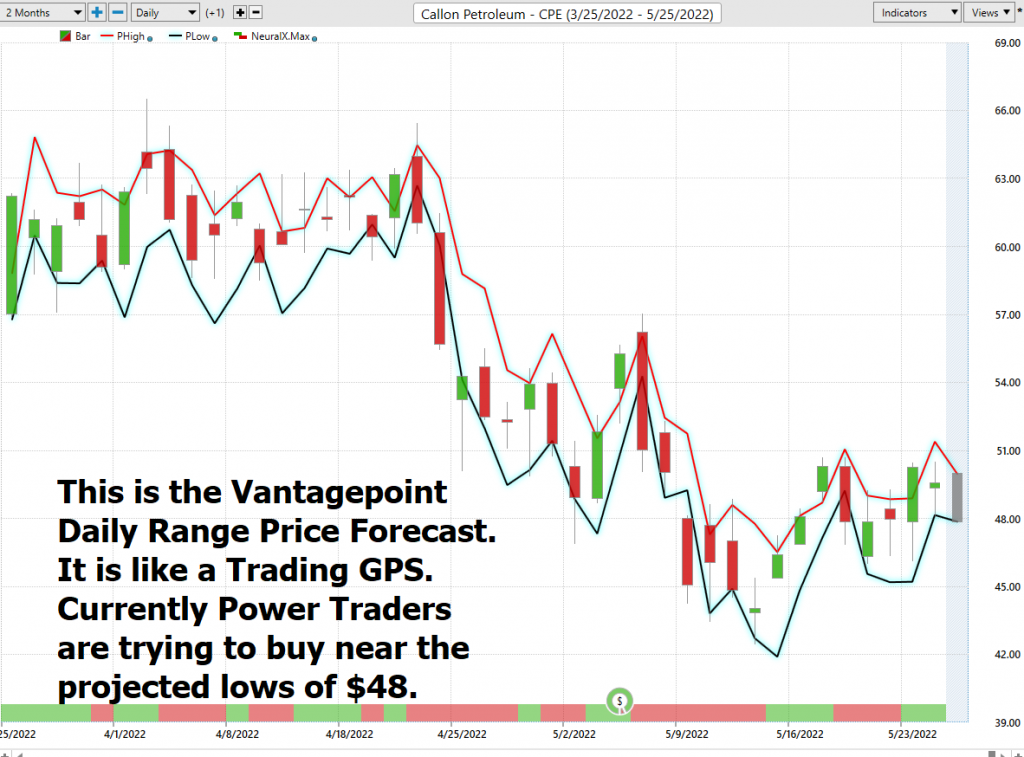
See how the upper and lower bands of the price range forecast form a noticeably clear channel of trading activity as well. Swing traders are always looking for opportunities to buy towards the bottom of the predicted channel and selling opportunities above the top band.
Intermarket Analysis
Power lies in the way we respond to the truth we understand.
Callon Petroleum has a great narrative. It has solid earnings, great financials.
Management has made the company more financially flexible by restructuring its debt obligations.
One of the supremely important questions in trading is what is driving the price? Headlines often create interesting narratives. But these “stories” only capture the imagination. Traders want and need to understand the cause and effect of price movement.
The only way to get an answer to this important question is through intermarket analysis which looks at statistical price correlations of assets.
We live in a global marketplace.
Everything is interconnected.
Intermarket analysis is a trading analysis technique that looks at the correlation between different asset classes in order to make better-informed trading decisions. By taking into account the relationships between different markets, intermarket analysis can give traders a more complete picture of the overall market environment. For example, by analyzing the relationship between $CPE and other markets, traders can get a better sense of whether the market is bullish or bearish. By looking at the correlation between $CPE and crude oil, traders can get a better sense of which way prices are likely to move. By considering these and other relationships, intermarket analysis can help traders to make more informed trading decisions.
Interest rates, Crude Oil Prices, and the volatility of the Dollar amongst thousands of other variables affect the decisions companies must make to flourish and prosper in these very challenging times. Trying to determine what these factors are is one of the huge problems facing investors and traders.
You always have a choice. You can tune in to the talking heads in the media who spin talking points which promote fear. Or you can rely on facts to base your decision making on.
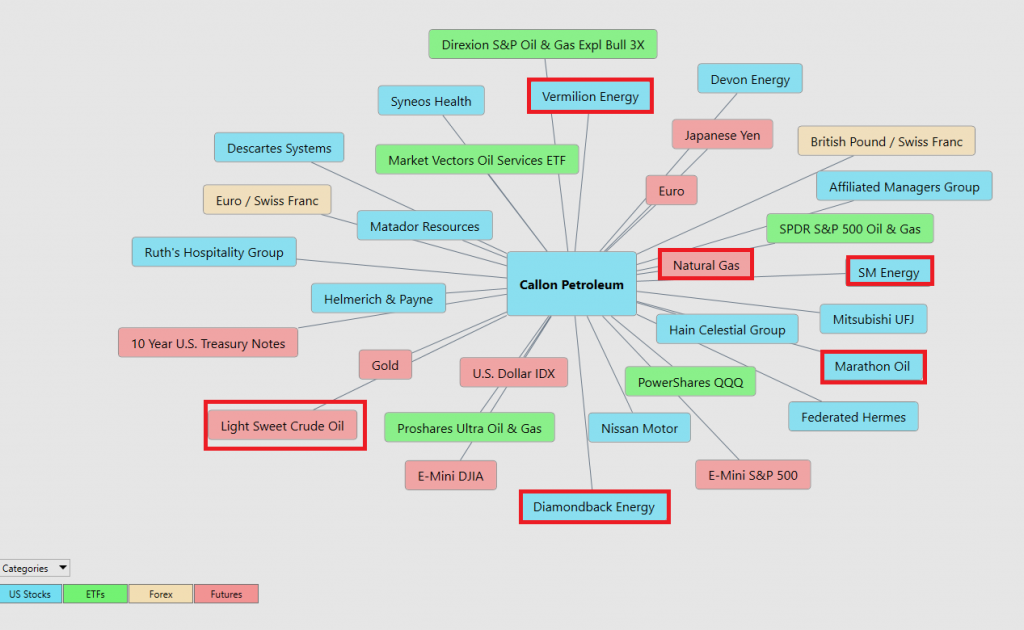
There is immense value to be had in studying and understanding the key drivers of CPE’s price action. This graphic provides a microcosmic view of what factors have been driving CPE’s price higher.
I have taken the liberty of highlighting in RED the other markets that $CPE is highly correlated with.
Our Suggestion
What caused us to take another look at $CPE was the reality that Wall Street Analysts had massively re-evaluated their 12-month forecasts over the previous few weeks. The lowest average target is $71, and the highest target is $140 with an average target of $88.
To put it lightly this is MASSIVE UPSIDE potential. While we never trade only on one indicator, that certainly caused us to review all of the indicators to see how they aligned with Wall Street.
$CPE is trading inversely to the broader stock market, and we think this also bodes well over the medium term. But most importantly is the reality that when we apply this same analysis to Crude Oil, we are on the verge of making 10-year highs. With the summer driving season upon us, all indications are that we will see significantly higher prices in gasoline and petroleum products.
Lastly, we might be premature, but the risk versus reward on this asset, at present time is massive. The downside risk is about $7, and the lowest Wall Street Analysts estimate put the potential at $21. That is a solid $3 to $1 risk/reward ratio. For this reason, this asset is worthy of being on your radar.
Pay close attention to the recent lows which is where stops will congregate.
Also pay attention to the 52-week high.
Our recommendation is to follow the A.I. trend analysis as outlined in this stock study and practice good money management on all trades.
We will re-evaluate based upon:
- New Wall Street Analysts’ Estimates
- New 52-week high and low boundaries
- Vantagepoint A.I. Forecast (Predictive Blue Line)
- Neural Network Forecast
- Daily Range Forecast
Let’s Be Careful Out There!
Remember, It’s Not Magic.
It’s Machine Learning.

IMPORTANT NOTICE!
THERE IS SUBSTANTIAL RISK OF LOSS ASSOCIATED WITH TRADING. ONLY RISK CAPITAL SHOULD BE USED TO TRADE. TRADING STOCKS, FUTURES, OPTIONS, FOREX, AND ETFs IS NOT SUITABLE FOR EVERYONE.
DISCLAIMER: STOCKS, FUTURES, OPTIONS, ETFs AND CURRENCY TRADING ALL HAVE LARGE POTENTIAL REWARDS, BUT THEY ALSO HAVE LARGE POTENTIAL RISK. YOU MUST BE AWARE OF THE RISKS AND BE WILLING TO ACCEPT THEM IN ORDER TO INVEST IN THESE MARKETS. DON’T TRADE WITH MONEY YOU CAN’T AFFORD TO LOSE. THIS ARTICLE AND WEBSITE IS NEITHER A SOLICITATION NOR AN OFFER TO BUY/SELL FUTURES, OPTIONS, STOCKS, OR CURRENCIES. NO REPRESENTATION IS BEING MADE THAT ANY ACCOUNT WILL OR IS LIKELY TO ACHIEVE PROFITS OR LOSSES SIMILAR TO THOSE DISCUSSED ON THIS ARTICLE OR WEBSITE. THE PAST PERFORMANCE OF ANY TRADING SYSTEM OR METHODOLOGY IS NOT NECESSARILY INDICATIVE OF FUTURE RESULTS. CFTC RULE 4.41 – HYPOTHETICAL OR SIMULATED PERFORMANCE RESULTS HAVE CERTAIN LIMITATIONS. UNLIKE AN ACTUAL PERFORMANCE RECORD, SIMULATED RESULTS DO NOT REPRESENT ACTUAL TRADING. ALSO, SINCE THE TRADES HAVE NOT BEEN EXECUTED, THE RESULTS MAY HAVE UNDER-OR-OVER COMPENSATED FOR THE IMPACT, IF ANY, OF CERTAIN MARKET FACTORS, SUCH AS LACK OF LIQUIDITY. SIMULATED TRADING PROGRAMS IN GENERAL ARE ALSO SUBJECT TO THE FACT THAT THEY ARE DESIGNED WITH THE BENEFIT OF HINDSIGHT. NO REPRESENTATION IS BEING MADE THAT ANY ACCOUNT WILL OR IS LIKELY TO ACHIEVE PROFIT OR LOSSES SIMILAR TO THOSE SHOWN.

