

[Editor’s note: For energy market newbies, the crack spread is simply the spread between crude oil and one of its products, in this case RBOB gasoline futures traded on the Nymex.]
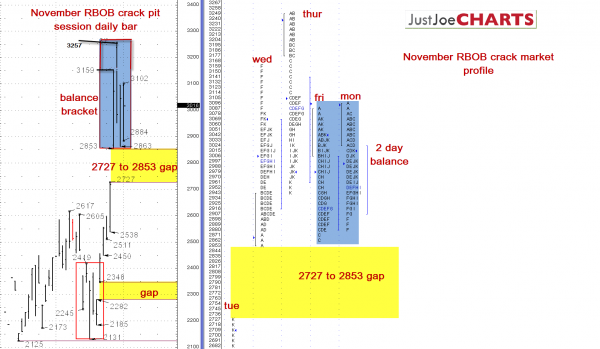
The November RBOB crack spread has been trending upward over the last couple months. However, over the last four days, the spread has come into a 28.53 to 32.57 balance.
Additionally, Fridays and Mondays ranges are nearly identical. There is a 27.27 to 28.53 gap between last Tuesdays and Wednesdays range directly below the four day balance bracket.
BE READY FOR A BREAKOUT
When a volatile market such as the RBOB crack is contained within such a tight balance for a period of time, a significant move usually follows the breakout from balance.
FIRST STEP
If the market breaks from the two-day balance to the upside, it may test Thursdays 32.57 high. If the market breaks from the two-day balance to the downside, it may attempt to fill the 27.27 to 28.53 gap.
SECOND STEP
It is possible that the market continues to rotate within the four day balance for the near future. However, we need to be prepared for a break from that balance. If the market gains acceptance above the 32.57 four day balance high, 32.95 and 33.50 are the next upside references on the weekly bar chart. If the market gains acceptance below that 27.27 to 28.53 gap, 26.17 and 25.38 are the downside references.

