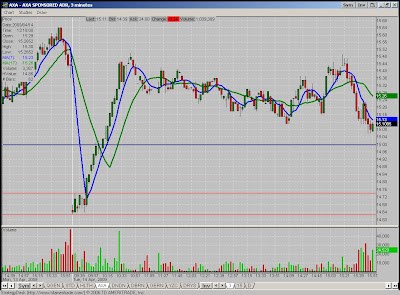
Alright, I know picking a chart post-facto is like ancient history but it’s helping me look at repeatable patterns on stocks that gap up or down – they tend to repeat themselves in certain ways.
Today, I also started playing with my chart and moving average intervals. I have used a five-minute candlestick with 10 and 60 SMAs (ala Muddy) almost exclusively. Today I tinkered around with 7 and 17 SMAs (like Fear and Greed Daytrader but he uses exponential averages) on a three-minute chart – which most traders find too busy. But I kept switching between 1 and 5 minute charts and maybe this will be a nice melding of the two time frames for me.
AXA – ORH Breakout
Nice narrow opening range and then a clear busting through of ORH with a tall green candle. I missed the initial move and when it approached $15, I was leery to go long but it broke through that as well to climb to $15.50 as HOD.


