

Like some other patterns, a head-and-shoulders formation may be part of a larger continuation pattern, but it often indicates a change in market direction when the neckline of the pattern is penetrated. This pattern involves several highs and lows, forms over a period of time and may be used to make price projections after a breakout.
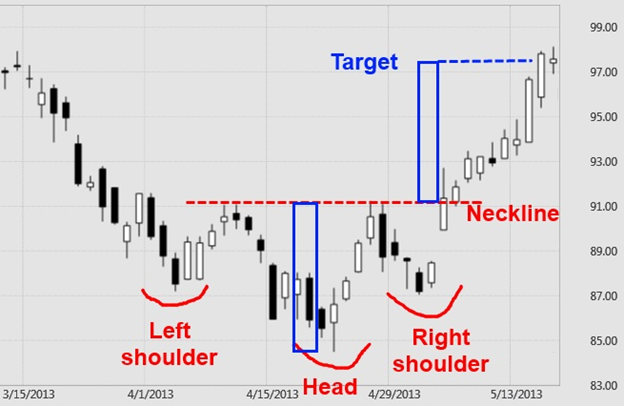
In the head-and-shoulders bottom shown, prices descend to a low marked by the left shoulder, rally to an interim high, then dip again to a lower low that forms the head. Then prices rally a second time to the vicinity of the first interim high and slip back again but not as far as the head, forming the right shoulder. Drawing a line across the interim highs produces the neckline.
Penetrating the neckline is the key to the reversal pattern prices move above the neckline (often with a little back-and-forth price action along the line), traditional chart analysis suggests the market will move the same distance above the neckline as the distance between the neckline and the peak of the head. In this chart example, the distance between the neckline at around 91 and the peak of the head was about 6 points. Adding 6 points above the neckline makes 97 at least an initial target projected by this formation. It doesn’t mean that’s the upside limit but can be useful in planning trades.
Just reverse the image for a head-and-shoulders top.
. If

