

In this weekly stock study, we will look at an analyze the following indicators and metrics which are our guidelines which dictate our behavior in deciding whether to buy, sell or stand aside on a particular stock.
- Broad based 50-year fundamental perspective
- 52 week high and low boundaries
- Vantagepoint A.I. Forecast (Predictive Blue Line)
- Neural Network Forecast (Machine Learning)
- Daily Range Forecast
- Intermarket Analysis
- Our trading suggestion
While we make all our trading decisions based upon the artificial intelligence forecasts, we do look at the fundamentals briefly, just to understand the financial landscape that the U.S. Dollar is operating in.
On August 15, 1971, President Richard Nixon closed the gold convertibility window and in so doing initiated the age of fiat currency. We are approaching the 50-year anniversary of this event and now have a huge stockpile of data that we can analyze to evaluate how this change from a semi gold standard to fiat has worked and changed the world.
As a result of the Bretton Woods Agreement, the U.S dollar was officially crowned the world’s reserve currency and was backed by the world’s largest gold reserves. Instead of gold reserves, other countries accumulated reserves of U.S. dollars to settle their obligation with other countries.
During World War II, the U.S. supplied the Allies and got paid in gold propelling the U.S. to the largest holder of gold. Historians Will and Ariel Durant aptly stated, that “he who has the gold, makes the rules.” After World War II countries linked their currencies to the dollar, which was linked to gold. Because of this the U.S. Dollar was considered to be “as good as gold.” However, during the 1960’s, the United States took on the Great Society Programs of Lyndon Johnson while simultaneously waging a very expensive war in Vietnam and spending billions with NASA to explore Space. Nations around the world began to concern themselves with their paper dollar holdings and requested to settle their obligations with the United States in Gold.
At the time Gold was priced at $35 per ounce. President Nixon decided that if all of the United States obligations would be settled in Gold that the United States would lose its Leading reserve currency status in the world, so he opted to simply close the gold convertibility window and all debts were settled with paper dollars. This act ushered in the age of paper currencies where all nations were now not backing their currency with anything other than political promises.
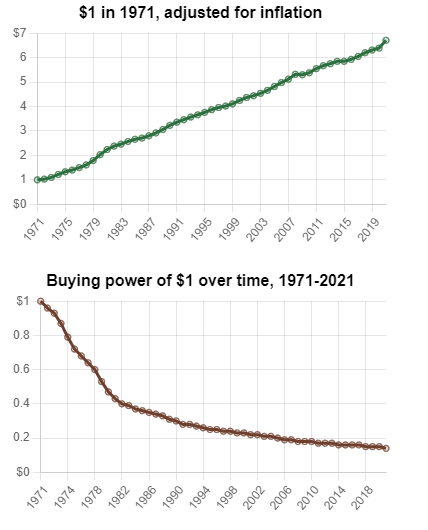
Value of $1 from 1971 to 2021
$1 in 1971 is equivalent in purchasing power to about $6.71 today, an increase of $5.71 over 50 years. The dollar had an average inflation rate of 3.88% per year between 1971 and today, producing a cumulative price increase of 570.85%.
This means that today’s prices are 6.71 times higher than average prices since 1971, according to the Bureau of Labor Statistics consumer price index. A dollar today only buys 14.90% of what it could buy back then.
The 1971 inflation rate was 4.38%. The current year-over-year inflation rate (2020 to 2021) is now 5.39%1. If this number holds, $1 today will be equivalent in buying power to $1.05 next year.
While these numbers are dismal, they are better than with our chief trading partners who have experienced even greater currency debasement than the United States.
Let’s briefly take a look at some important financial benchmarks just to get a half century perspective of how the financial markets have responded to this massive shift in monetary policy.
On August 15, 1971, Gold was priced at $35 an ounce. Today it is $1800 per ounce. A gain of $1765 or $5,043%.
The Dow Jones Industrial Average was trading at 856.02.
Today it is trading at 35,000. This represents an impressive gain of 3,989%.
So, and think about that difference. Gold has increased in price by 5,043% in comparison to the Dow which even in its massive bull market status has only increased 3,989%.
Looked at another way, if you had invested $35 into the Dow Jones Industrial Average the day after Nixon closed the Gold convertibility window your investment would be worth $1390 today. However, had you just invested in Gold that same $35 ounce of Gold would be worth $1800 today.
Gold, also known as the barbaric relic, clearly outperformed as a better store of value the index of the finest companies in the United States.
Half a century of data is quite informative!
In the early 1970’ at the Chicago Mercantile Exchange, the International Monetary Market was formed to trade Foreign currency futures contracts. The primary customers then were banks trying to hedge their foreign exchange risk.
Fast forward 20 years and in the 1990’s the Forex market evolved into the online decentralized market that it is today.
Everyone tends to price assets in the U.S. Dollar because of its reserve currency status. While that is important to do, what the last 50 years has taught us is that we should also price things in other currencies and asset classes to better understand what has occurred in the financial landscape.
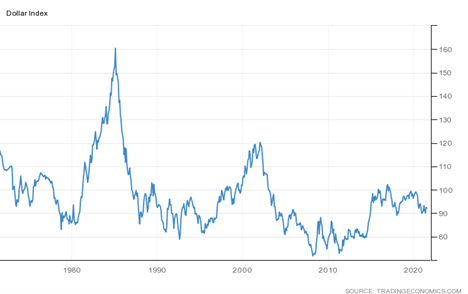
Below is a 50-year chart of the US Dollar Index to provide a very broad perspective.
Commonsense Metrics
Let’s start our analysis with the commonsense metrics. Over the last 52 weeks the US. Dollar Index has traded as high 93.42 and as low as $89.11. This tells us that the annual trading range has been $4.31.
When we study the charts, we start by analyzing where the market is in relationship to its 52-week high and low.
Experience tells us that assets which successfully breach their 52-week highs on strong momentum tend to move higher, and vice-versa. The following U.S. Dollar chart shows the most recent 52-week high and low boundaries, as well as the 2-year high.
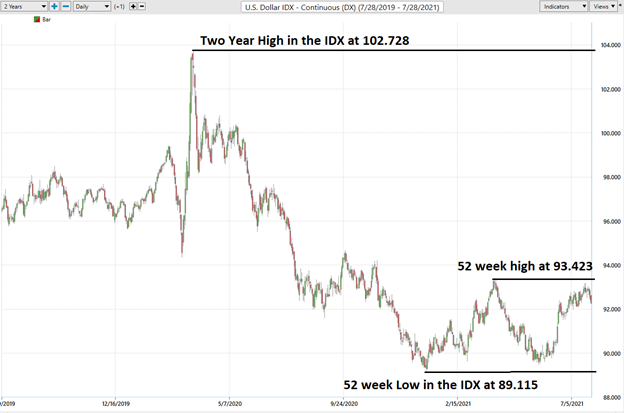
We urge all traders to pay very close attention to the 52-week boundaries as they provide important benchmarks. These areas often create support and resistance in the market, however, when they are breached the tendency is for the market to go substantially higher or lower.
Over the past year the dollar has traded in a 556-basis point range.
The Vantagepoint A.I. Analysis
Whenever we look at an asset forecast, we always are comparing what the asset has done, to the artificial intelligence, which is computing its forecast based upon a proprietary intermarket analysis of the most closely correlated assets as well as a neural network computation.
The key to the Vantagepoint analysis is the predictive blue line. The slope and general direction of the blue line determines the trend forecast for the market.
The Vantagepoint Software has three separate modules which create a forecast for a Power Trader. They are the predictive blue line, the Neural Net, and the Intermarket Analysis.
An analogy is in order. Think of the underlying trend of the market as a river. A river is supported by smaller tributaries and streams. To navigate the river effectively and to avoid danger as much as possible we want to know the direction of the flow. Ideally, we want to be involved with a trend when all flows are pointing in the same direction.
To accomplish this objective, we need to rely upon a:
- Short Term forecast
- Medium Term forecast
- Long Term forecast.
The predictive blue line also acts as value zone where in uptrends traders try to purchase the asset at or below the blue line. Power Traders use the predictive blue line in helping to determine both the value zone as well as the trend direction.
VantagePoint traders can analyze the predictive blue line one a short term, medium term, or longer-term horizon to establish a trend forecast. They can also use these forecasts to acquire single and/or double confirmation which will be discussed shortly.
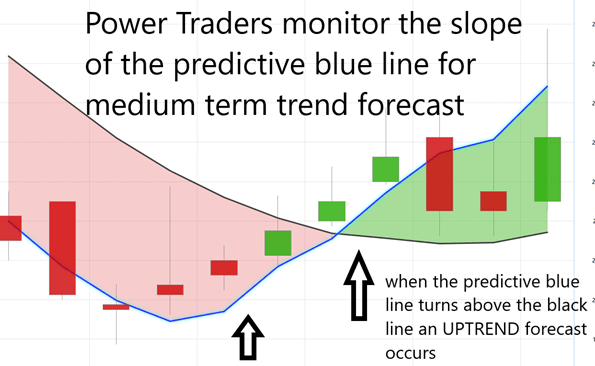
To understand and appreciate how powerful this indicator is, let me show it to you without any of the daily price bars on the chart.
- The slope of the predictive blue line determines the very short-term trend.
On the following graphic, monitor that you would want to buy when the slope of the blue line is going up.
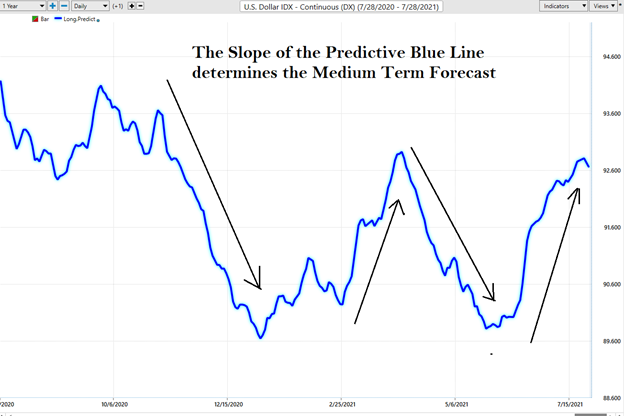
The predictive blue line above is used by medium-term traders. It is calculated every day and its slope and overall direction determines the short-term trend forecast of the market. Power Traders learn to trust that when the blue line is going up those higher prices are expected, and when the blue line is going down, lower prices are expected.
Here is the complete chart with the daily price bars so that you see the entirety of the trend that the artificial intelligence captured over the last 6 months.
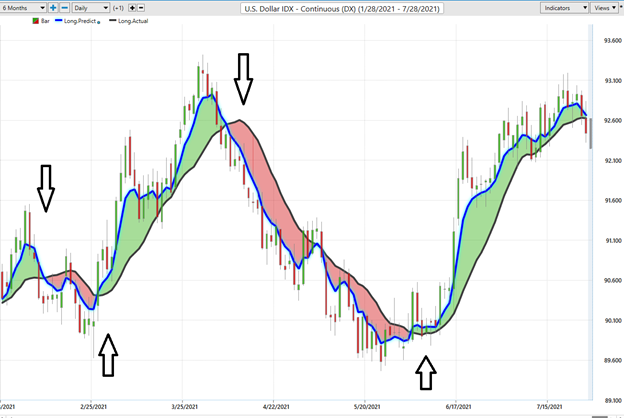
Observe “when” the SLOPE of the predictive blue line started moving lower and how price behaved.
- Power Traders always look for opportunities to SELL the asset at or above the predictive blue line, as that is considered to be the IDEAL VALUE zone for traders.
- Power Traders always look for opportunities to BUY the asset at or below the predictive blue line, as that is considered to be the IDEAL VALUE zone for traders.
At the bottom of the chart is the Neural Network Indicator which predicts future short-term strength and/or weakness in the market. When the Neural Net Indicator is green it communicates strength. When the Neural Net is Red it is forecasting short term weakness in the market.
A Neural Net a computational learning system that uses a network of functions to understand and translate massive amounts of data into a desired output, consistently monitoring itself and improving its performance.
Traders look for confirmation on the NeuralNet to position themselves LONG or SHORT in the market.
We advocate that Power Traders cross reference the chart with the predictive blue line and neural network indicator to create optimal entry and exit points.
Power Traders are always looking to apply both the neural network and A.I. to the markets to find statistically sound trading opportunities.
Fine Tuning Entries and Exits
One of the powerful features in the Vantagepoint A.I. Software which Power Traders use daily is the Price Range prediction forecast.
This forecast is what permits Power Traders to truly fine tune their entries and exits into the market because of the very precise forecasts for the daily high and low price. Swing traders are always trying to buy close to the bottom of the channel and sell at the upper boundary a few days later.
At 6:30pm after the market close the software updates and all the price predictions change based upon what the machine learning, A.I., neural networks, and intermarket analysis anticipate moving forward.
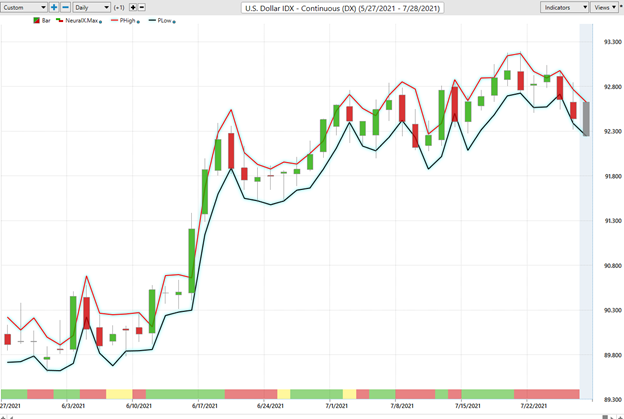
Observe how during a RED Neural Net reading at the bottom of the chart traders can very often enter at or near the exact bottom of the market for that day.
By utilizing both tools simultaneously, Power Traders can locate precision entries and exits with high probabilities of success and are capable of exploiting short term swing trading opportunities.
This is the power at your fingertips when you use artificial intelligence to do your trend analysis. The slopes of the price channels above clearly delineate the trends.
Intermarket Analysis of the U.S. Dollar
We live in a global marketplace. Everything is interconnected. The billion-dollar question for traders is always what are the key drivers of price for the underlying asset that I am trading?
Power lies in the way we respond to the truth we understand.
Sometimes the only way we can understand the truth of the financial marketplace is by simply looking at the most statistically correlated markets to the price of an asset we are trading or investing in.
What makes VantagePoint unique and distinct when compared to all other analytical tools is its patented and proprietary intermarket analysis.
Intermarket analysis is a method of analyzing markets by examining the correlations between different asset classes. In other words, what happens in one market could, and probably does, affect other markets, so a study of the relationship(s) is often very helpful to a trader.
How correlated is the asset you are trading to the S&P 500 Index? Or the U.S. Treasury Bond Market? Or Gold?
There is great value to be had in studying and understanding the key drivers of the U.S. Dollar’s price action.
Intermarket analysis immunizes you from fake news reports in the media that offer scholastic opinions disguised as facts.
When you see the key drivers of price you know that these statistical correlations put the probabilities overwhelmingly in your favor with the trading decisions you make.
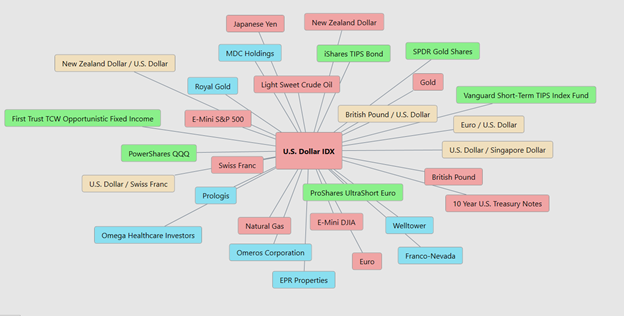
Instead of looking at financial markets or asset classes on an individual basis, intermarket analysis looks at several strongly correlated markets, or asset classes, such as other stocks, currencies, ETFs, and commodities. This type of analysis expands on simply looking at each individual market or asset in isolation by also looking at other markets or assets that have a strong relationship to the market or asset being considered. The Vantagepoint software analyzes the top 31 drivers of an assets price. This analysis will often show ETF’s which are big owners of the underlying asset, but it will also uncover other markets which are statistically correlated to the trend you are analyzing. Traders often find other blossoming opportunities when engaging in Intermarket Analysis.
Our Trading Suggestion on the U.S. Dollar
Many traders refer to the U.S. Dollar as the “cleanest dirty shirt on the rack.” What they mean by this statement is that the U.S. Dollar remains the worlds reserve currency. It is a better store of value than other fiat currencies, but it is still highly problematic as an investment vehicle.
From a geopolitical point of view, the U.S. Dollar remains the instrument that citizens in foreign countries rush to when a crisis occurs.
By applying each of the elements in the Vantagepoint A.I. forecast and assembling them together you put the probabilities of success in your favor.
The current uptrend in the U.S. Dollar over the last several weeks is concluding and the software is advising traders to exit with healthy profits. This last trend resulted in 202 basis points of profit over a period of 39 days.
Here is a quick snapshot of the daily U.S. Dollar price chart with the Vantagepoint A.I. forecast at the present time:
It is premature for us to get overtly bearish on the U.S. Dollar at the present time.
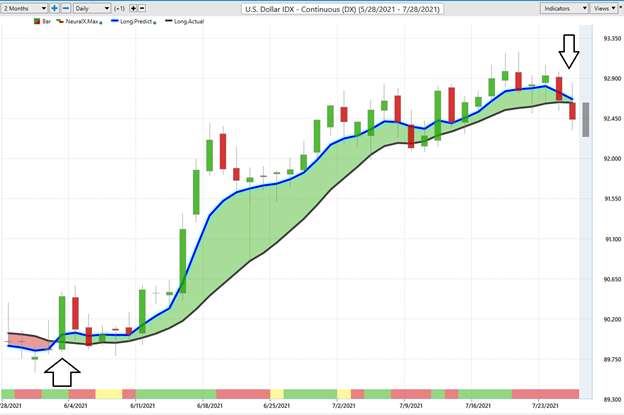
The chart above appears that the uptrend is completing.
The artificial intelligence is confirming that aspect of the analysis.
We anticipate short-term choppy price action before an UPTREND forecast occurs again in a few weeks. Ideally, we will get an opportunity to buy back in at much lower prices.
Sometimes the best trade you can make in an asset is to stand aside and not take any position until the elements which make up the trade line up correctly. We are waiting for the artificial intelligence to signal when that time occurs.
We have The U.S. Dollar on our radar and are awaiting the next UPTREND opportunity.
When that occurs, you can rest assured that the artificial intelligence will alert the Vantagepoint family of this development.
Let’s Be Careful Out There!
It’s Not Magic. It’s Machine Learning.

IMPORTANT NOTICE!
THERE IS SUBSTANTIAL RISK OF LOSS ASSOCIATED WITH TRADING. ONLY RISK CAPITAL SHOULD BE USED TO TRADE. TRADING STOCKS, FUTURES, OPTIONS, FOREX, AND ETFs IS NOT SUITABLE FOR EVERYONE.
DISCLAIMER: STOCKS, FUTURES, OPTIONS, ETFs AND CURRENCY TRADING ALL HAVE LARGE POTENTIAL REWARDS, BUT THEY ALSO HAVE LARGE POTENTIAL RISK. YOU MUST BE AWARE OF THE RISKS AND BE WILLING TO ACCEPT THEM IN ORDER TO INVEST IN THESE MARKETS. DON’T TRADE WITH MONEY YOU CAN’T AFFORD TO LOSE. THIS ARTICLE AND WEBSITE IS NEITHER A SOLICITATION NOR AN OFFER TO BUY/SELL FUTURES, OPTIONS, STOCKS, OR CURRENCIES. NO REPRESENTATION IS BEING MADE THAT ANY ACCOUNT WILL OR IS LIKELY TO ACHIEVE PROFITS OR LOSSES SIMILAR TO THOSE DISCUSSED ON THIS ARTICLE OR WEBSITE. THE PAST PERFORMANCE OF ANY TRADING SYSTEM OR METHODOLOGY IS NOT NECESSARILY INDICATIVE OF FUTURE RESULTS. CFTC RULE 4.41 – HYPOTHETICAL OR SIMULATED PERFORMANCE RESULTS HAVE CERTAIN LIMITATIONS. UNLIKE AN ACTUAL PERFORMANCE RECORD, SIMULATED RESULTS DO NOT REPRESENT ACTUAL TRADING. ALSO, SINCE THE TRADES HAVE NOT BEEN EXECUTED, THE RESULTS MAY HAVE UNDER-OR-OVER COMPENSATED FOR THE IMPACT, IF ANY, OF CERTAIN MARKET FACTORS, SUCH AS LACK OF LIQUIDITY. SIMULATED TRADING PROGRAMS IN GENERAL ARE ALSO SUBJECT TO THE FACT THAT THEY ARE DESIGNED WITH THE BENEFIT OF HINDSIGHT. NO REPRESENTATION IS BEING MADE THAT ANY ACCOUNT WILL OR IS LIKELY TO ACHIEVE PROFIT OR LOSSES SIMILAR TO THOSE SHOWN.

