

On July 13, 2021, the CPI numbers came in at 5.4% for June, which was 10% higher than the mainstream economists had forecasted. What makes this noteworthy is that a miss by 10% is an impressive feat given they spend all day creating econometric models to understand what is happening in the economy. Next week we will see the Consumer Price Index and Producer Price Index numbers for July. The financial markets are very nervous about this release.
In last month’s numbers, when you remove the food and energy from the mix, core inflation rose to 4.5% for the month of June. That makes the June CPI is the highest it has been in 13 years and core inflation is as high as it has been since 1991. Based upon these figures and all the money printing which has been going on, let’s do a deep dive into inflation hedges and see how they have performed over the last several years.
One of the recurring themes of the articles that we write is that massive financial pricing distortions in asset classes occur when the money printer is unleashed. This is the epic tale of currency debasement throughout history.
The biggest challenge today is that SAVINGS are under attack. Anyone who has excess cash does not have a safe haven to put their money in to protect it against the ravages of inflation and declining purchasing power. Whether you are aware of it or not, regardless of how you behave with your money you are speculating today.
If you stay in cash, you are losing purchasing power due to inflation.
When you are guaranteed a loss of purchasing power by playing it safe you know that something is not right with current economic and monetary policies. The question that all traders, investors, and retirees need to be asking themselves is:
Where does scared money run to when the safety net has been decimated?
Why is this of concern? There are several reasons, but one of the main factors is the real rate of return. This metric is calculated by looking at the yield of the Ten-Year Bond and Subtracting the Core Inflation rate.
The 10 Year Bond is yielding 1.20%
Core Inflation was 4.5%
That makes the Real Return on 10 Year U.S. Treasuries -3.3%
How many people do you know that like losing a minimum of 3.3% of their hard-earned savings every year by investing in the full faith and credit of U.S. Treasuries? These assets were once considered to be the bedrock of guaranteed safety and risk avoidance. Not so much anymore!
During times of inflation, history shows that people move out of paper money and towards real assets. Historically those assets have been commodities, precious metals, real estate, fine art, and collectibles. This occurs to protect purchasing power.
What investors and traders traditionally have done is that they analyze the growth of the money supply to determine how much new money has been added into the economy and then they compare asset classes to that growth of the money supply. Essentially this is paying homage to Nobel Laureate, Milton Friedman the leading economist from the University of Chicago who postulated that inflation is always a monetary phenomenon. Friedman throughout his career warned that money supply was what affected inflationary price pressures.
While this process is straightforward, we live in very interesting times. The Federal Reserve in their wisdom decided several months ago that they would discontinue the publishing of some of the broad-based money supply figures. We wrote about that phenomenon here.
Today, if you click on the following link, you go to the St. Louis Fed website to track the m2 Money supply and receive the following announcement.
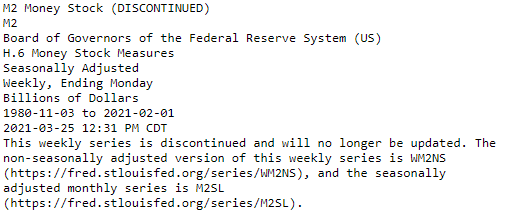
Because of this development, we cannot have 100% accuracy in the figures for the past year, but we can draw some interesting insights by studying relationships over the past five years.
Here is the chart of the most current M2 Money Stock chart for the last 5 years.
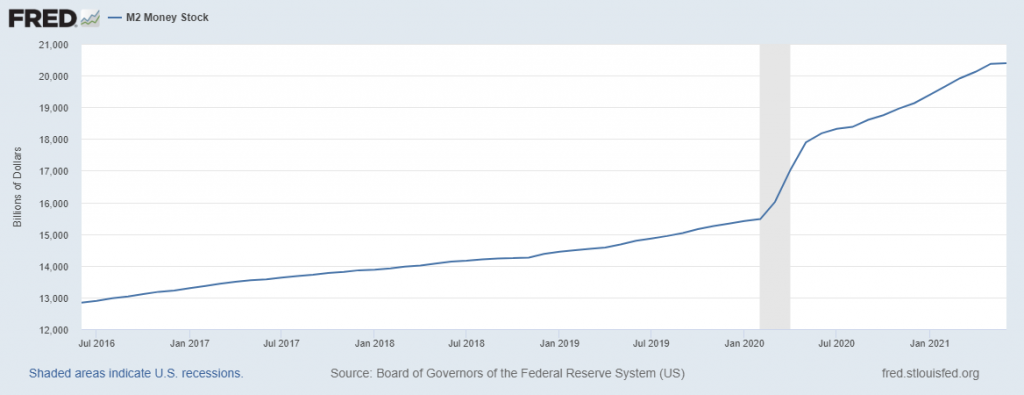
From here we can look at different asset classes and see how they have performed based upon this current financial landscape. Traditional economic theory states that when new money is created it takes anywhere from 12 to 18 months for it to be priced into the economy. In other words, it is a gradual process for people to see price increases.
The numbers are quite fascinating.
Over the past 5 years, M2 Money Supply has grown by 57%.
What do you think have been the best hedges against that amount of new currency entering into the economy?
What have been the worst inflation hedges of the last 5 years?
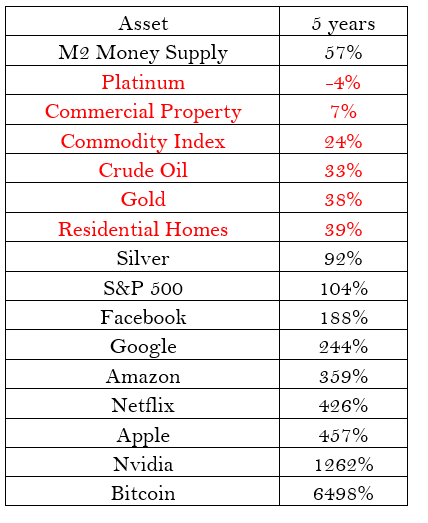
Can you make sense of this? It truly is unusual and highlights how theories might make financial sense, but you still need more than a theory to embrace when you navigate the financial landscape.
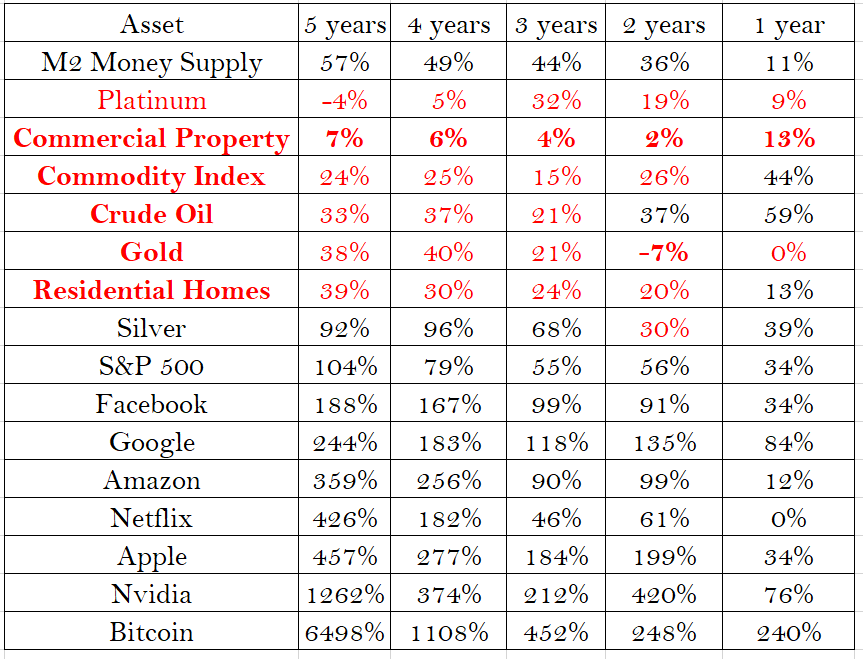
Money Supply increases by 57% and 6 traditional inflation hedges (in RED) did not increase in value by as much as money supply growth.
Hmmmmmm!
If you are scratching your head trying to make sense of this performance, you certainly have my sympathies. This is exactly the type of price distortions that occur that defy logic.
How is it that Commercial Property as measured by the Green Street Commercial Property Index only increased 7%?
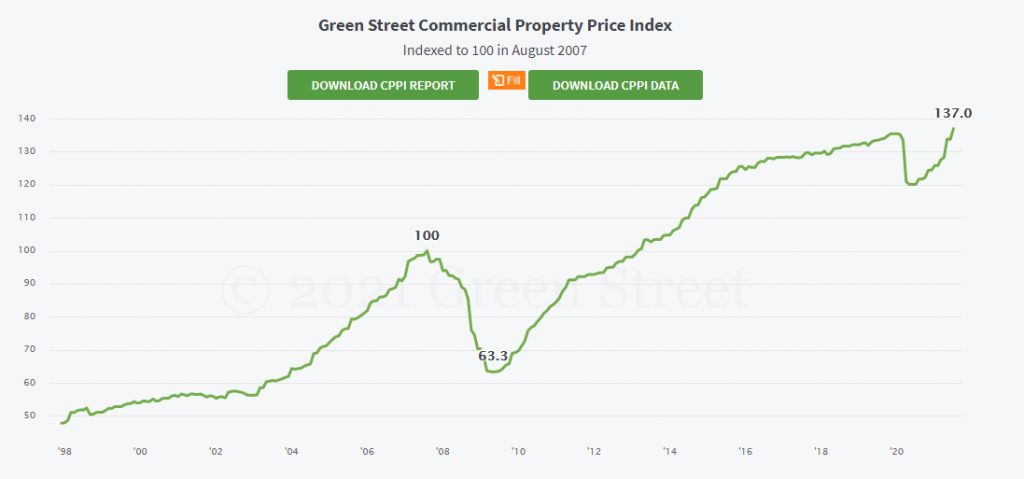
Historically Commercial Property has been a top inflation hedge.
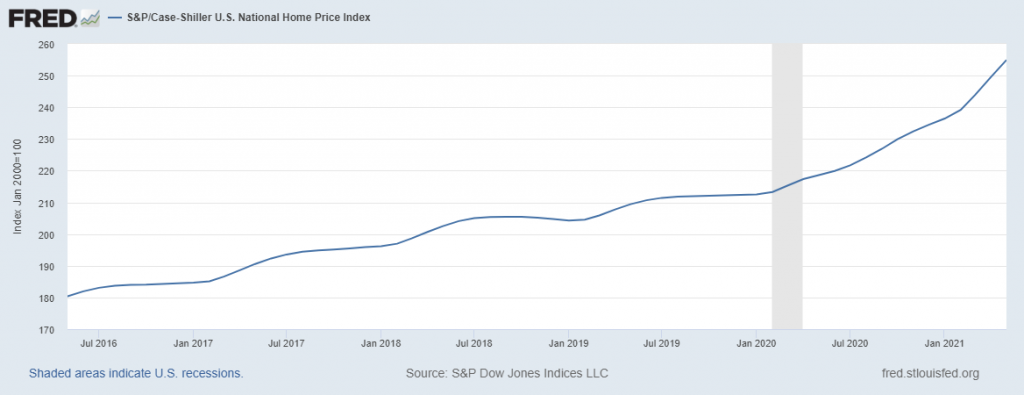
But look at the following chart of National Home prices created by the St. Louis Federal Reserve and how is it that it has underperformed Money Supply Growth for 4 of the last 5 years?
Or Gold the traditional hedge against inflation only increased by 38% which is 19% less than Money Supply growth!
Platinum, which is rarer than Gold, decreased by 4% in value? Against a 57% increase in Money Supply growth. How does that happen?
Welcome to the Brave New World of Money Printing.
Better yet, look at the big inflation hedge winners of the last 5 years. Most of them would never have been inflation hedges.
Look at how the S&P 500 and the FAANG stocks grew by many multiples’ times the growth of Money Supply! Traditionally, inflation has always been troublesome for large companies as they would slowly pass price increases on to their customers.
And Bitcoin, despite its massive volatility exponentially outperformed its next nearest competitor with a 5-year return of 6,498%
How does that happen?
The point to all of this is that you cannot rest the financial security of your portfolio on a theory! We are living in a Brave New World. I do not know where these markets will be in 5 years. That is impossible to forecast. But I do know that our artificial intelligence software is 87.4% accurate at keeping traders on the right side of the right market at the right time.
The challenge every investor and trader faces are differentiating between what SHOULD happen and what IS happening. When SHOULD and IS meet some explosive things can occur, and that is where we want to be as traders? The only way we can accomplish that objective is by focusing on TRENDS not opinions.
The macroeconomic problem that has been unfolding in our country for the past thirty years is that since savings are under attack if you are going to be in the financial markets, in today’s brave new world – it is all about finding the strongest trends that can be exploited.
Here is a year-by-year heat map of Money Supply Growth matched by performance of the underlying asset. The RED figures are the assets and time frames where that market underperformed what occurred in the money supply.
This is worth studying, but don’t expect to make sense of it.
Money Supply has exploded with the pandemic and economic lockdown and yet GOLD the one asset with thousands of years of history as an inflation hedge has not moved at all.
High levels of inflation are problematic. They create immense pain and loss for people in an economy. Citizens must learn how to protect themselves.
While we make all our trading decisions based upon the artificial intelligence forecasts, we do look at the fundamentals briefly, just to understand the financial landscape that the underlying market is operating in.
The reason this type of analysis is important is that in the current economic environment you are rewarded or penalized through your decision-making process.
The world is changing rapidly. Don’t get caught without the right technology on your side.
How good are you at making decisions?
What has your performance been over the past 5 years? Past 4 years? Past 1 year?
Are you outperforming the Money Supply Growth and retaining the purchasing power of your savings?
How many of those inflation hedge trends did you successfully catch or read correctly?
Markets are very humbling mechanisms.
To be successful in the markets TODAY you need to make good decisions, and you can only do that if you are focused on the strongest trends.
The only way that I know how to make sense of the madness that is our current economic environment is through the power of artificial intelligence, neural networks, and machine learning. In trading, the only thing that matters is price. It is what creates wealth or devastates your trading account.
My reality is always formed by what I see, hear, feel, and understand. Therefore, I use artificial intelligence, neural networks, and machine learning to guide my trading decisions.
Trying to protect your purchasing power must become your primary mission as you navigate the financial world. I challenge you to try and make sense of the 2500-page Infrastructure Bill which is currently being evaluated by Congress. There are educated opinions disguised as facts on how all that will affect markets. Those stories will not serve you well.
Artificial intelligence is so powerful because it learns what doesn’t work, remembers it, and then focuses on other paths to find a solution. This is the Feedback Loop that is responsible for building the fortunes of every successful trader I know.
It’s not hard to appreciate that A.I. applies mistake-prevention to discover what is true and workable. Artificial Intelligence applies this as a continual process 24 hours a day, 365 days a year towards whatever problem it is looking to solve.
That should get you excited because it is a game-changer.
However, most traders love drama, and there is no shortage of that when it comes to making money. Braggarts are everywhere trying to proclaim their dominance and insider knowledge.
There is only one fact in the world of markets and that is PRICE. What the price of an asset does is the only thing that matters to a trader.
Price is the only thing that can create wealth. As experienced traders have learned, the market is never wrong, but opinions often are!
This is painfully obvious in hindsight, but traders often get trapped in the story and it forces them to behave quite irrationally.
Stories capture the imagination and make us all think about possibilities, but stories are where risk lives.
Traders must concern themselves only with how the price of an asset responds to news and stories. This is exactly why artificial intelligence is invaluable in helping traders focus on solid trends.
There is only one fact in the world of markets and that is PRICE.
Stories pull on our heartstrings and can make traders make decisions irrationally. Trading success comes from making decisions based only on cold, hard facts!
We live in very exciting times.
What hurts others can instruct us.
A.I. is the framework where risk and opportunity are very clearly defined.
Remember, artificial intelligence has decimated humans at Poker, Jeopardy, Go! and Chess. Why should trading be any different?
Visit with us and check out the A.I. at our Next Live Training.
Discover why Vantagepoint’s artificial intelligence is the solution professional traders go to for less risk, more rewards, and guaranteed peace of mind.
It’s not magic. It’s machine learning.
Make it count.

IMPORTANT NOTICE!
THERE IS SUBSTANTIAL RISK OF LOSS ASSOCIATED WITH TRADING. ONLY RISK CAPITAL SHOULD BE USED TO TRADE. TRADING STOCKS, FUTURES, OPTIONS, FOREX, AND ETFs IS NOT SUITABLE FOR EVERYONE.
DISCLAIMER: STOCKS, FUTURES, OPTIONS, ETFs AND CURRENCY TRADING ALL HAVE LARGE POTENTIAL REWARDS, BUT THEY ALSO HAVE LARGE POTENTIAL RISK. YOU MUST BE AWARE OF THE RISKS AND BE WILLING TO ACCEPT THEM IN ORDER TO INVEST IN THESE MARKETS. DON’T TRADE WITH MONEY YOU CAN’T AFFORD TO LOSE. THIS ARTICLE AND WEBSITE IS NEITHER A SOLICITATION NOR AN OFFER TO BUY/SELL FUTURES, OPTIONS, STOCKS, OR CURRENCIES. NO REPRESENTATION IS BEING MADE THAT ANY ACCOUNT WILL OR IS LIKELY TO ACHIEVE PROFITS OR LOSSES SIMILAR TO THOSE DISCUSSED ON THIS ARTICLE OR WEBSITE. THE PAST PERFORMANCE OF ANY TRADING SYSTEM OR METHODOLOGY IS NOT NECESSARILY INDICATIVE OF FUTURE RESULTS. CFTC RULE 4.41 – HYPOTHETICAL OR SIMULATED PERFORMANCE RESULTS HAVE CERTAIN LIMITATIONS. UNLIKE AN ACTUAL PERFORMANCE RECORD, SIMULATED RESULTS DO NOT REPRESENT ACTUAL TRADING. ALSO, SINCE THE TRADES HAVE NOT BEEN EXECUTED, THE RESULTS MAY HAVE UNDER-OR-OVER COMPENSATED FOR THE IMPACT, IF ANY, OF CERTAIN MARKET FACTORS, SUCH AS LACK OF LIQUIDITY. SIMULATED TRADING PROGRAMS IN GENERAL ARE ALSO SUBJECT TO THE FACT THAT THEY ARE DESIGNED WITH THE BENEFIT OF HINDSIGHT. NO REPRESENTATION IS BEING MADE THAT ANY ACCOUNT WILL OR IS LIKELY TO ACHIEVE PROFIT OR LOSSES SIMILAR TO THOSE SHOWN.

