

This week’s stock analysis is COSTCO (COST).
Costco Wholesale Corporation is an American multinational corporation which operates a chain of membership-only big-box retail stores. As of 2020, Costco was the fifth largest retailer in the world, and the world’s largest retailer of choice and prime beef, organic foods, rotisserie chicken, and wine as of 2016. In 2021, Costco was ranked #10 on the Fortune 500 rankings of the largest United States corporations by total revenue. The company has 812 stores, 275,00 employees, and a market cap of $192 billion.
Costco has been a great stock to own over the past decade, but it is also trading at all-time highs.
Is Costco stock worth buying now? Will Costco be able to keep up its impressive growth rate as online retailing continues to grow? Or will the company face tough competition from Amazon and other retailers that are also competing on price?
Here’s what we know – The company is doing very well. It has a recession proof business model. Its memberships drive repeat business and it has a very powerful competitive advantage for consumers who do bulk buying at significant savings.
The pandemic created a huge sales surge for the retailing giant. Sales remain very strong for Costco. Even after the economy has opened back up, the year over year comparisons indicate that demand is still very vibrant. In May 2021 the company had a 14.7% year over year sales increase. June 2021 sales were 7.9% better than the same time frame last year.
Analysts who recognized Costco would benefit from the pandemic and lockdown correctly anticipated much loftier valuations in the stock.
At the present time, year-over-year comparisons will become a bit tougher over the next few months. Earnings will be the key drivers of the stock price moving forward.
From a purely fundamental point of view Costco stock is pricey at nearly 36 times forward earnings. However, between the company’s strong sales growth, its substantial long-term expansion based upon its huge competitive advantage, Costco clearly deserves to be on your trading radar.
In this weekly stock study, we will look at an analyze the following indicators and metrics which are our guidelines which dictate our behavior in deciding whether to buy, sell or stand aside on a particular stock.
- Analysts Ratings
- 52 week high and low boundaries
- Vantagepoint A.I. Forecast (Predictive Blue Line)
- Neural Network Forecast (Machine Learning)
- Daily Range Forecast
- Intermarket Analysis
- Our trading suggestion
While we make all of our trading decisions based upon the artificial intelligence forecasts, we do look at the fundamentals briefly, just to understand the financial landscape that Costco is operating in.
Analysts Ratings
Based on 23 Wall Street analysts offering 12-month price targets for Costco in the last 3 months. The average price target is $421.05 with a high forecast of $455.00 and a low forecast of $350.00. The average price target represents a -3.15% change from the last price of $434.73.
Commonsense Metrics
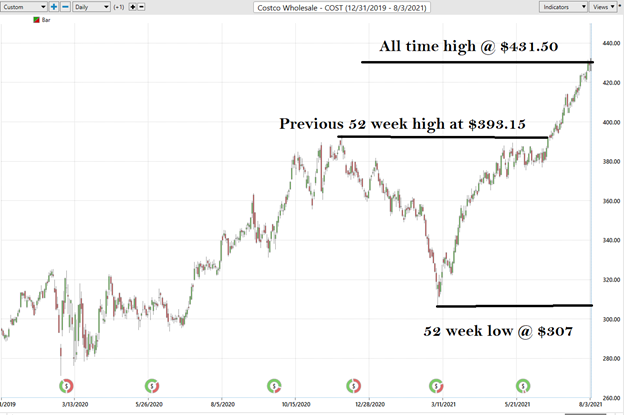
Let’s start our analysis with the commonsense metrics. Over the last 52 weeks it has traded as high as $431.50 and as low as $307. This tells us that the annual trading range is $124.5. The average weekly trading range is $2.39. These baseline numbers provide us with a very broad landscape of what the averages have been in the past. We look to amplify these numbers greatly when trading with artificial intelligence.
Here is a chart of Costco over the past two years. We advise all traders when starting to analyze a trade to look at the longer-term time frames to understand where the asset is trading in comparison to its recent 52-week highs and lows. These boundaries are vitally important for traders to be aware of.
Whenever a stock breaches its 52-week low or high values the tendency is for its recent momentum to often continue.
Here is the two-year chart of Costco which highlights these important boundaries.
The Vantagepoint A.I. Analysis
The VantagePoint predictive blue line is the first metric that Power Traders use to define trend direction and potential entries and exits.
On the following chart you will see the power of the VantagePoint predictive blue line which determines the medium term trend price forecast for COST. The long black vertical lines are the dates of the earnings announcements. Costco is clearly sensitive to earnings.
By simply eyeballing the chart you can quickly conclude that one of the most successful trading actions in Costco, over the past year has been to wait until after EARNINGS are announced and then when the predictive blue line turns higher it announces a BUYING opportunity for you to position yourself on the LONG side of the market. When the predictive blue line turns lower you would look to close out your long positions or wait to get stopped at your protective stop-loss point.
The biggest challenge for traders is being on the right side, of the right market at the right time. Long term historical studies show that markets only tend to trend about 30% of the time. By simply following the PREDICTIVE BLUE LINE, Power Traders did extremely well trading Costco trend over the past year.
- The slope of the predictive blue line determines the very short-term trend. On the graphic above, monitor that you would want to buy when the slope of the blue line is going up.
- When the slope of the blue line is going sideways you would be anticipating sideways prices.
- Likewise, when the slope of the blue line is going down you would be anticipating lower prices.
NeuralNet Indicator (Machine Learning)
At the bottom of the chart is the Neural Network Indicator which predicts future short-term strength and/or weakness in the market. When the Neural Net Indicator is green it communicates strength. When the Neural Net is Red it is forecasting short term weakness in the market.
![]()
A Neural Net is a computational learning system that uses a network of functions to understand and translate massive amounts of data into a desired output, consistently monitoring itself and improving its performance.
Traders look for double confirmation on the NeuralNet to position themselves LONG or SHORT in the market. Meaning they wait for the predictive blue line and the NeuralNet to be pointing in the same direction to confirm trend direction.
We advocate that Power Traders cross reference the chart with the predictive blue line and neural network indicator to create optimal entry and exit points.
Power Traders are always looking to apply both the neural network and A.I. to the markets to find statistically sound trading opportunities.
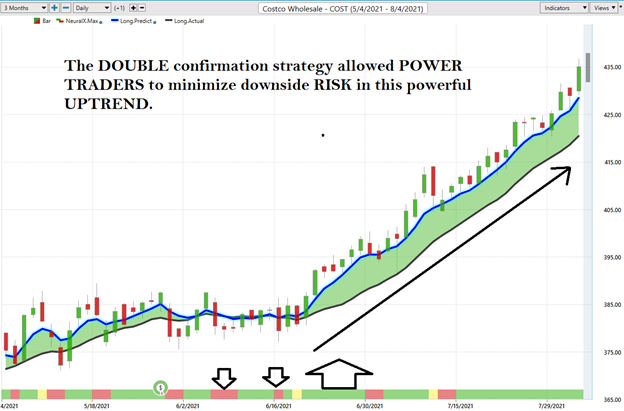
We will zoom in on the price action on Costco for the last 3 months so that you can see how Power Traders harness this trend confirmation signal. Simply look at the following chart and when the BLUE LINE is UP, and The Neural Network is GREEN is when you would want to position yourself on the LONG SIDE of the market. Anytime you see the NeuralNet as Red you would be anticipating lower prices.
Fine Tuning Entries and Exits of Costco (COST)
One of the powerful features in the Vantagepoint A.I. Software which Power Traders use daily is the Price Range prediction forecast.
This forecast is what permits Power Traders to truly fine tune their entries and exits into the market because of the very precise forecasts for the daily high and low price. Swing traders are always trying to buy close to the bottom of the channel and sell at the upper boundary a few days later.
At 6:30pm after the market close the software updates and all the price predictions change based upon what the machine learning, A.I., neural networks, and intermarket analysis anticipate moving forward.
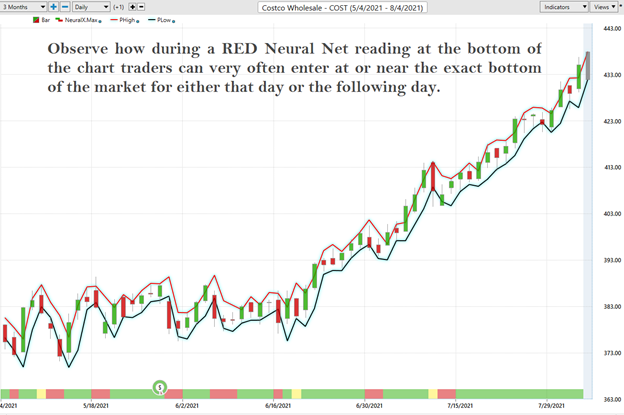
Here is the price chart of Costco during the most recent runup featuring the Daily Price Range forecast with the NeuralNet Index at the bottom of the chart. By utilizing both tools simultaneously Power Traders can locate precision entries and exits with high probabilities of success and are capable of exploiting short term swing trading opportunities.
Observe how during a RED Neural Net reading at the bottom of the chart traders can very often enter at or near the exact bottom of the market for that day.
By utilizing both tools simultaneously Power Traders can locate precision entries and exits with high probabilities of success and are capable of exploiting short term swing trading opportunities.
This is the power at your fingertips when you use artificial intelligence to do your trend analysis. The slopes of the price channels above clearly delineate the trends.
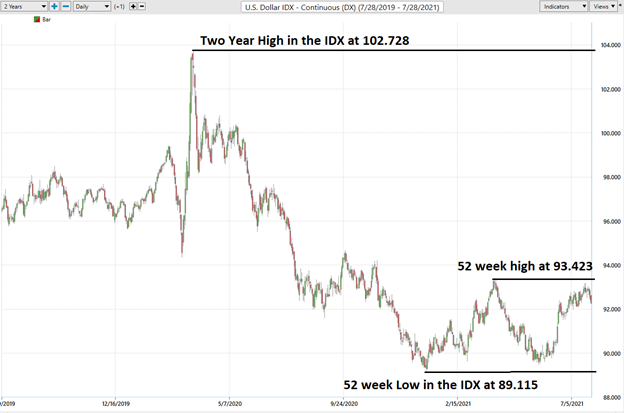
Intermarket Analysis of Costco (COST)
We live in a global marketplace. Everything is interconnected. The billion-dollar question for traders is always what are the key drivers of price for the underlying asset that I am trading?
Small changes in Interest rates, Crude Oil Prices, and the Volatility of the dollar amongst thousands of other variables affect the decisions companies must make to survive in these very challenging times. Trying to determine what these factors are is one of the huge problems facing investors and traders.
There is great value to be had in studying and understanding the key drivers of Costco’s price action. universe and the most statistically correlated assets. These factors are all displayed from a standpoint of statistical correlations which show the strongest interconnectedness of prices.
What makes Vantagepoint unique and distinct when compared to all other analytical tools is its patented and proprietary intermarket analysis.
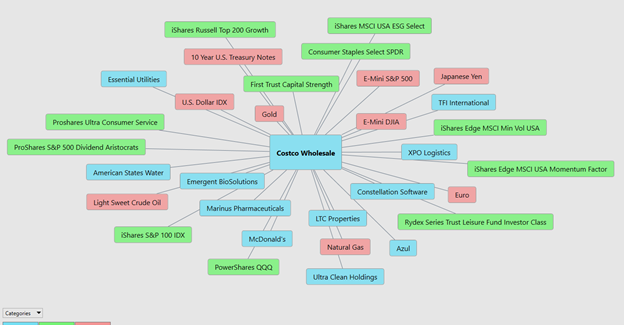
Intermarket analysis is a method of analyzing markets by examining the correlations between different asset classes. In other words, what happens in one market could, and probably does, affect other markets, so a study of the relationship(s) is often very helpful to a trader.
How correlated is Costco to the S&P 500 Index? Or the U.S. Treasury Bond Market? Or Gold?
There is great value to be had in studying and understanding the key drivers of Costco’s price action.
Intermarket analysis immunizes you from fake news reports in the media that offer scholastic opinions disguised as facts.
When you see the key drivers of price you know that these statistical correlations put the probabilities overwhelmingly in your favor with the trading decisions you make.
Our Trading Suggestion of Costco
Context is very important whenever doing an analysis or looking to take a trade.
We like Costco very much as a trading vehicle, it is volatile, liquid, and trends very well. We also need to recognize that it is trading at new all-time highs. Sometimes the best trade is the one you don’t take. At current price levels and trading at 36 times forward earnings we can only suggest that savvy swing traders with very short-term time frame horizons position themselves in (COST) on pullbacks.
The stock is clearly in a huge uptrend. Over the last 5 years, it is up 235%. We have no reason to think that the massive growth that Costco has experienced due to the pandemic will slow down.
Earnings will continue to be the key driver in Costco longer-term analysis and the next earnings call and announcement is slated for September 23, 2021.
Our suggestion – Follow the A.I. trend analysis and practice good money management on all your trades. (COST) has proven repeatedly to be a good candidate for short-term swing trading opportunities. We anticipate that price will begin to level off going into the next earnings call. Should that occur, we will be focused on the A.I. to provide our guidance on where we should position ourselves in this market.
Let’s Be Careful Out There!
Remember, It’s Not Magic.
It’s Machine Learning.

IMPORTANT NOTICE!
THERE IS SUBSTANTIAL RISK OF LOSS ASSOCIATED WITH TRADING. ONLY RISK CAPITAL SHOULD BE USED TO TRADE. TRADING STOCKS, FUTURES, OPTIONS, FOREX, AND ETFs IS NOT SUITABLE FOR EVERYONE.
DISCLAIMER: STOCKS, FUTURES, OPTIONS, ETFs AND CURRENCY TRADING ALL HAVE LARGE POTENTIAL REWARDS, BUT THEY ALSO HAVE LARGE POTENTIAL RISK. YOU MUST BE AWARE OF THE RISKS AND BE WILLING TO ACCEPT THEM IN ORDER TO INVEST IN THESE MARKETS. DON’T TRADE WITH MONEY YOU CAN’T AFFORD TO LOSE. THIS ARTICLE AND WEBSITE IS NEITHER A SOLICITATION NOR AN OFFER TO BUY/SELL FUTURES, OPTIONS, STOCKS, OR CURRENCIES. NO REPRESENTATION IS BEING MADE THAT ANY ACCOUNT WILL OR IS LIKELY TO ACHIEVE PROFITS OR LOSSES SIMILAR TO THOSE DISCUSSED ON THIS ARTICLE OR WEBSITE. THE PAST PERFORMANCE OF ANY TRADING SYSTEM OR METHODOLOGY IS NOT NECESSARILY INDICATIVE OF FUTURE RESULTS. CFTC RULE 4.41 – HYPOTHETICAL OR SIMULATED PERFORMANCE RESULTS HAVE CERTAIN LIMITATIONS. UNLIKE AN ACTUAL PERFORMANCE RECORD, SIMULATED RESULTS DO NOT REPRESENT ACTUAL TRADING. ALSO, SINCE THE TRADES HAVE NOT BEEN EXECUTED, THE RESULTS MAY HAVE UNDER-OR-OVER COMPENSATED FOR THE IMPACT, IF ANY, OF CERTAIN MARKET FACTORS, SUCH AS LACK OF LIQUIDITY. SIMULATED TRADING PROGRAMS IN GENERAL ARE ALSO SUBJECT TO THE FACT THAT THEY ARE DESIGNED WITH THE BENEFIT OF HINDSIGHT. NO REPRESENTATION IS BEING MADE THAT ANY ACCOUNT WILL OR IS LIKELY TO ACHIEVE PROFIT OR LOSSES SIMILAR TO THOSE SHOWN.

