By: Scott Redler
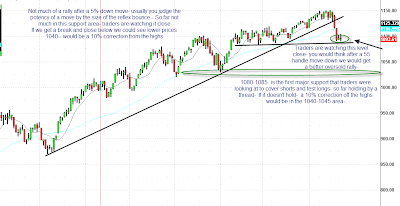
Many traders are trying to figure out if this 1,080-1,085 area is “BUYABLE.” As of now, we are holding it, but there has not been much conviction on the bounce. Combine that with some technical damage in some of the market’s leaders and it looks like we might have our first 10% correction since “The Rally” started last March. Below are two charts that basically sum up the latest action in the S&P.
This first chart displays the area in the 1,080-1,085 area that was worth a try long.

This next chart shows where we stand after today’s close:

As you can see, this market is holding on by a thread.


