

“Ask Kase” and your question may be chosen as the subject of a future column (askkase@kaseco.com).
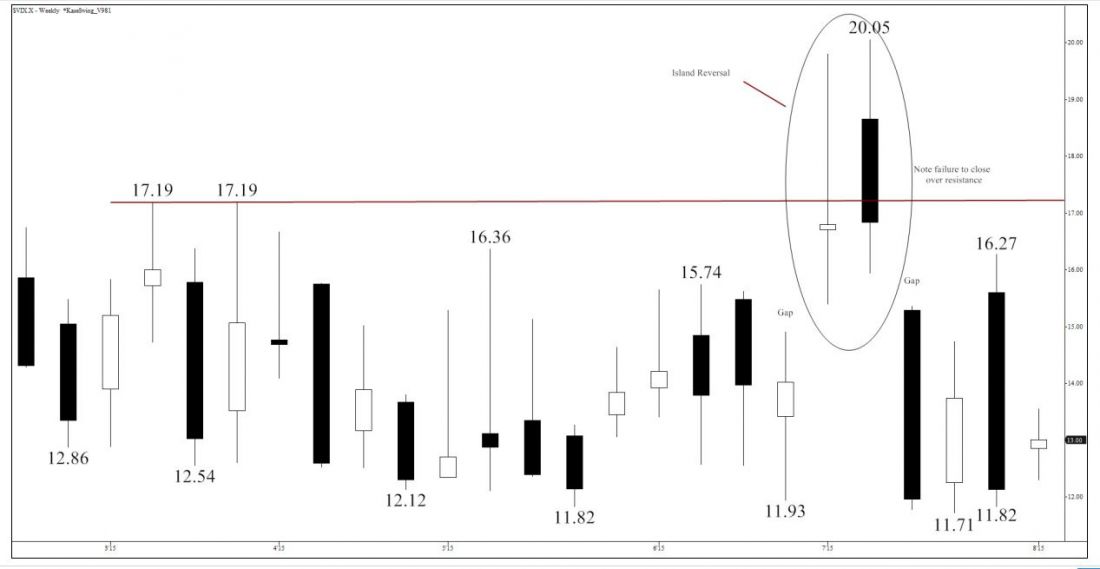
The VIX has been chopping around erratically, oscillating between lows in the 11.4 to 11.8 range and testing highs generally in the mid to upper teens, but occasionally spiking fitfully into the low 20s. Resistance at 17.19 was tested twice earlier this year, and from late June to early July there was a two week spike that formed an island reversal, leaving first an up gap into the first week, and then a down gap following the second. The jump seems to have been due to market hysteria, as opposed to real, supportive factors. Neither week closed over 17.19 resistance. Since then swing lows at 11.71 and 11.82 were made, with an intervening 16.27 high. This high failed to meet the top of the daily gap at 16.60.
Charts created using TradeStation. ©TradeStation Technologies, Inc. 2001-2015. All rights reserved. No investment or trading advice, recommendation or opinions are being given or intended.
The VIX has oscillated up and down, sustaining a direction for no more than a couple of weeks or so, and failing to establish a trend or even a clear corrective pattern. On the very short-term charts, the activity since July 29 looks like a bearish correction, but that could mean little more than a retest of the lows.
The downside target ranges from 11.3 to 11.8 with a median of 11.5. If the small correction plays out in a standard manner, the swing low of 11.82 will be broken at least to some degree, with a slight bias towards hitting the lower end of the range. The reason is that earlier waves from 25.2 and 16.7 have extensions that calculate to 11.8. More recent waves from 13.55 and 13.22 drop that to about 11.4, which is probably the most likely outcome, but only marginally.
If the VIX were to surprise us by cleanly breaking and remaining below 11.3, then a retest of the historical 2006 low, around 9.3 would be called for, with interim support at 10.8. Given the irregular wave patterns, there’s nothing intrinsic in the structures calling for this to happen.
On the upside the crucial level is 14.4, the 62 percent retracement of the aforementioned decline, and July’s monthly open. 14.4 is highly confluent for the waves up from both 11.71 and 11.82. These also show targets at 17.5, just above the earlier 17.19 resistance. A sustained close over 14.4 if not contained by 17.5; would probably mean that more extreme values in the 24.5 area, become likely.
If I were looking to get long the VIX, I would not allow myself to become overly “vexed” by a retest of the lows, and only would be concerned if there were sustained closes below 11.3. I’d look for a bounce from that retest, or if that doesn’t happen, a close over 14.4, to time in. Optionally, I might sell a put below 11.3 and buy a call above 14.4, or use those values as a base from which to set my range. Given the levels at which the VIX has traded historically, it has much more upside to vex the bears, than the reverse.
Send questions for next week to askkase@kaseco.com, and learn more about Kase’s services at http://bit.ly/1IUNhb3.

