

Honestly, I’ve never been too impressed with the results I’ve had using volume in my technical analysis but an e-mail exchange I had with Ralph Vince (author, Risk Probability Analysis) last week provided what appears to be a ‘rich-vein’ and probably deserves more attention than I am able to give in a format such as this. Ralph’s comment was that when equity volume touches a 13-day high or low, a turn in direction is due (within a bar or two). I should be clear the analysis below is my own.
SHORT TERM TREND CHANGE
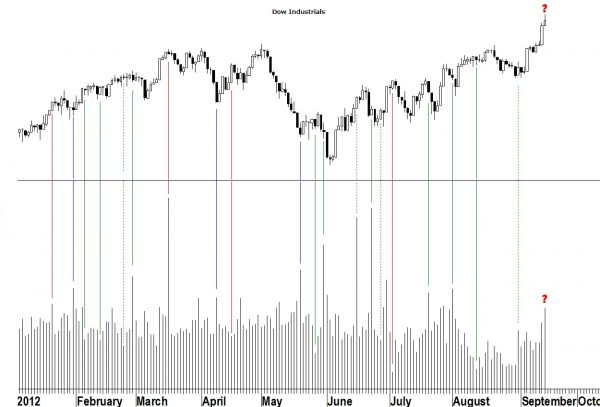
Looking at a daily chart of the Dow Industrials (Figure 1) and, admittedly, a very small sample (since the beginning of the year), the reader can see three different colored markings; red, blue, and green. The red (sell) and blue (buy) are those bars which are printed at 13-day highs or lows in volume and price closed in the direction of a trend which had been in existence for at least two previous days. Pretty good results, I think, if one is trying to identify short-term changes in trend. But what about all those green lines?
AN ANOMALY
The first anomaly I can see is a volume extreme on the first day of a price reversal rather than at the end of a trend. When that has occurred, typically what we see is the previous trend (before the reversal) has reasserted itself, at the most, within two days.
The first two dashed lines appear to have failed but were followed by the expected tops within two days. The third dashed line marks a volume extreme (low) but the trend had not been in effect for two days previous to the signal. And the final dashed line on 8/31/12? It was followed by a new (intra-day) low on the next trading day but even for a short-term indicator that would have been hard to profit from.
BOTTOM LINE
Regardless, last Friday’s new high on a volume spike looks interesting. The advancing trend into Friday’s volume spike forecasts at least a temporary end to last week’s run-up.
Looking for more trading ideas? Read our daily Markets section here.

