
Advanced Micro Devices, Inc. (AMD) was founded on May 1, 1969. They are primarily known for designing and manufacturing microprocessors and graphics processing units (GPUs) for personal computers, servers, and other devices. In addition to CPUs and GPUs, AMD also produces chipsets, embedded processors, and semi-custom System-on-Chip (SoC) products. The company’s biggest profit center is its Computing and Graphics segment, which includes CPUs and GPUs for desktop, laptop, workstation, and gaming graphics cards. $AMD’s main competitors are Intel, NVIDIA, and Qualcomm. The company has a strong history of innovation that has introduced new technologies and architectures that have helped it gain market share. They have approximately 25,000 employees. Their stock trades on the NASDAQ and generates 57.3 million shares per day.
In 2011 $AMD reported annual revenues of $6.56 billion. For the quarter just ending, they reported annual revenues of $23.07 billion, which represents a cumulative 250% revenue growth over the last 11 years.
From a purely fundamental perspective, one story which has grabbed traders’ attention is that $AMD and Microsoft are partnering on creating new chipsets to offer an alternative to NVDIA processing units. $MSFT has denied the story but $AMD has continued to move higher on the news.
In this weekly stock study, we will look at and analyze the following indicators and metrics as are our guidelines which dictate our behavior in deciding whether to buy, sell, or stand aside on a particular stock.
- Wall Street Analysts’ Estimates
- 52-week high and low boundaries
- Best Case – Worst Case Analysis
- Vantagepoint A.I. Forecast (Predictive Blue Line)
- Neural Network Forecast
- Daily Range Forecast
- Intermarket Analysis
- Our Suggestion
We don’t base our decisions on things like earnings or fundamental cash flow valuations. However, we do look at them to better understand the financial landscape that a company is operating under.
Analysts Ratings
The first set of boundaries which we explore in our stock study is what do the professionals think who monitor the stock for a living. We can acquire this information by simply looking at the boundaries that the top Wall Street Analysts set for $AMD. This initial set of boundaries provides us with an idea of what is expensive, fairly valued, and cheap.
Based on 35 Best Performing Wall Street analysts offering 12-month price targets for Advanced Micro Devices in the last 3 months. The average price target is $98.00 with a high forecast of $200 and a low forecast of $77. The average price target represents a +2.61% change from the last price of $95.51.
From this simple analysis we can see that $AMD is approaching fair value at present time but some on Wall Street think that it has the potential to more than double from current price levels.
Seven Wall Street brokerage firms raised their forecasts based upon their most recent earnings report.
52-week High-Low Chart
To assess a stock’s performance, one effective method is to analyze its long-term monthly and weekly charts. Examining the big picture of a trend from a broader perspective allows for a clearer evaluation. Many highly successful traders rely on long-term monthly charts for trend analysis.
In the last 52 weeks, $AMD has experienced a trading range of $55.00, with its highest point at $109.57 and lowest at $54.57. These metrics serve as a baseline for understanding the stock’s normal value. When employing artificial intelligence, we leverage these metrics to maximize our returns.
Additionally, I like to determine the stock’s volatility by dividing the annual range of $55 into the current price. By dividing $55 by $95.06, we arrive at a metric of 57.9%. This estimation indicates that if $AMD behaves similarly to the recent past, it would be perfectly normal to expect the next year’s trading range to 57.9% higher and/or lower than the current price.
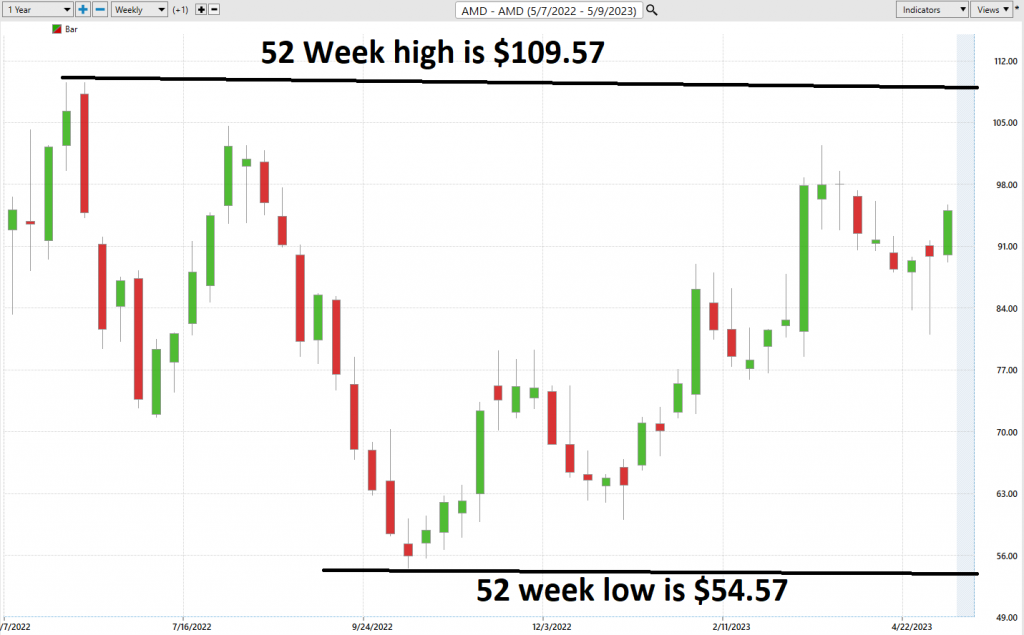
Whenever we trade, we always pay attention to where we are in relation to the 52-week trading range. It is very common to see the 52-week high provide very strong resistance to the market until it is breached. Often when the 52-week high is breached we will see the stock price explode higher very quickly over a very short period. Currently $AMD is trading at the 19th percentile of its 52-week range.
We can get context with regards to the long-term trend by zooming out to the 10-year monthly chart.
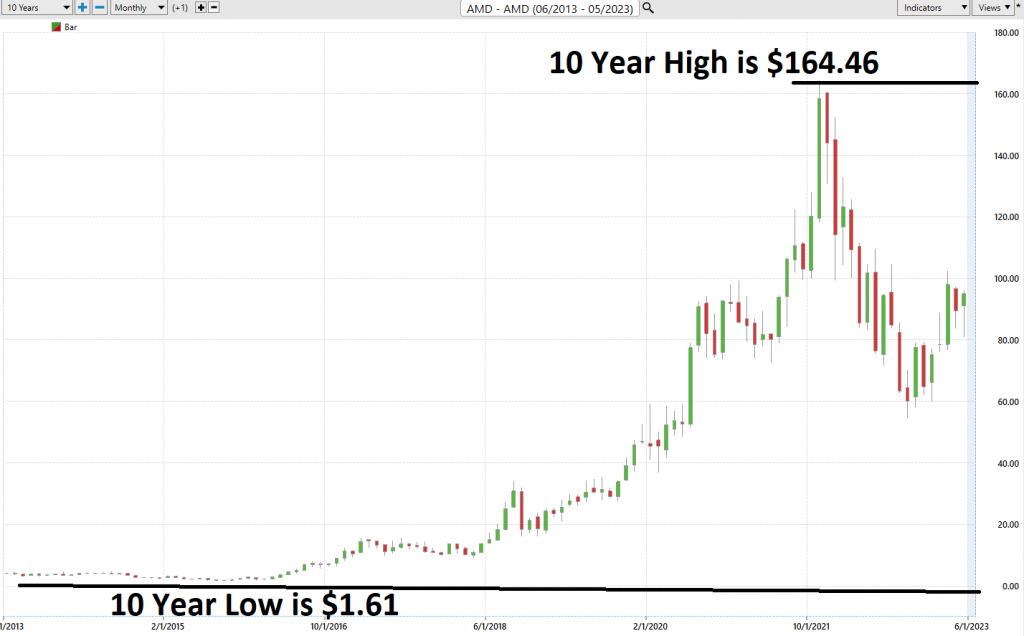
You can see in the chart above that $AMD is down 42% from its all-time highs. Yet when we study the 52-week chart we can calculate that $AMD is about 13% from its 52-week highs.
Best Case – Worst Case Analysis
Next, we like to get a real-world flavor of volatility by measuring the ideal uptrends and ideal downtrends. These measurements spell out real world volatility and allow us to compare the assets rallies in comparison to its declines.
Here is the best-case analysis:
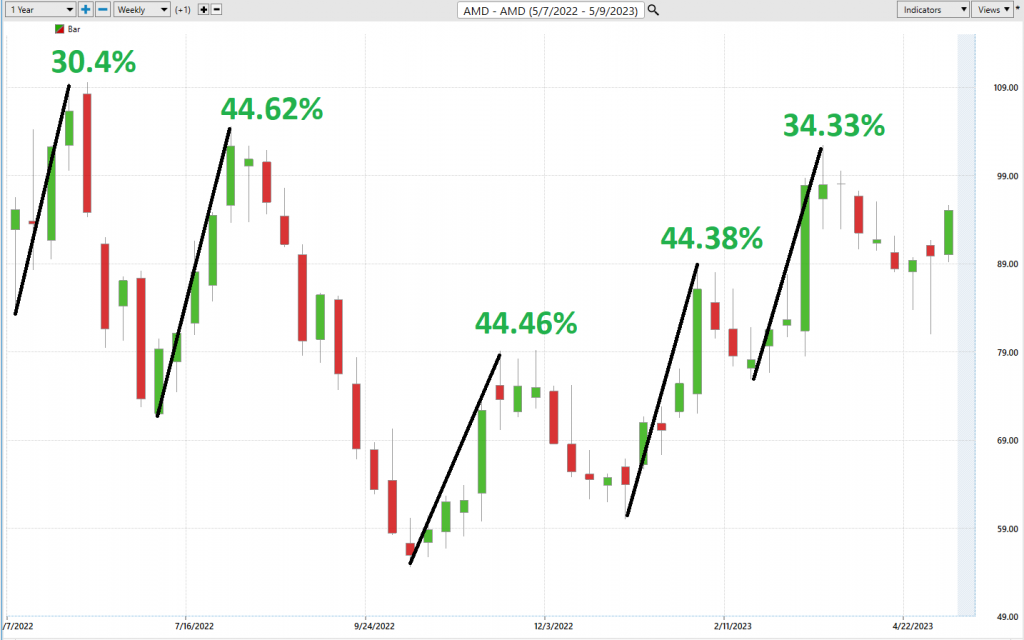
Followed by the worst-case analysis:
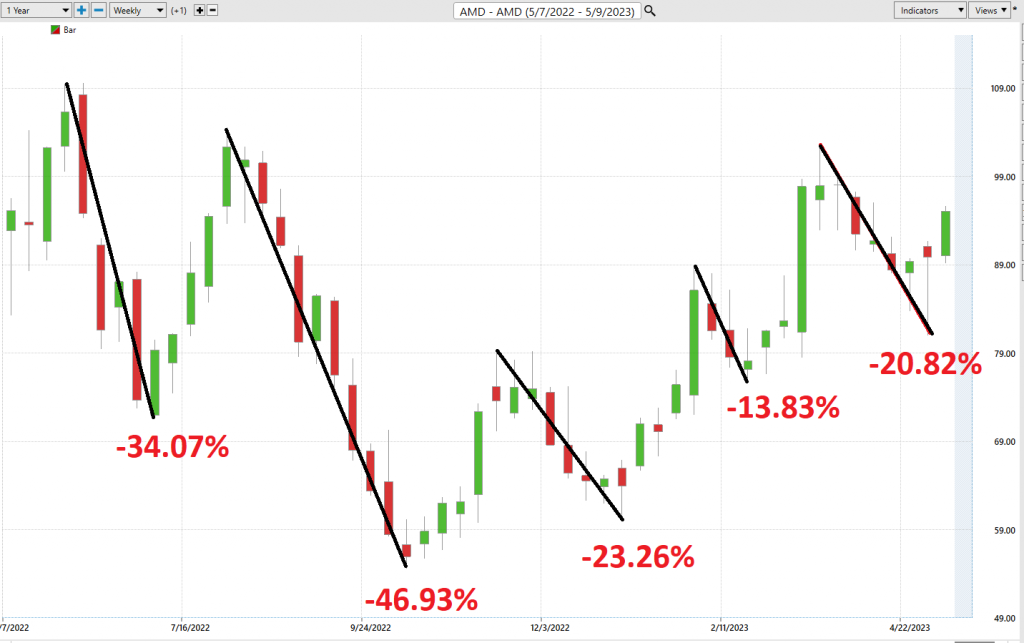
In the previous section we noted that statistical volatility is 57.9%. Observe how all of the rallies and declines were contained by this large value.
Finally, we want to evaluate $AMD is in comparison to the performance of the major stock market indexes which we have greater familiarity with and then look at the drawdowns of the stock over the past year to get a worst-case scenario idea for any conclusions that we might reach when we trade this asset.
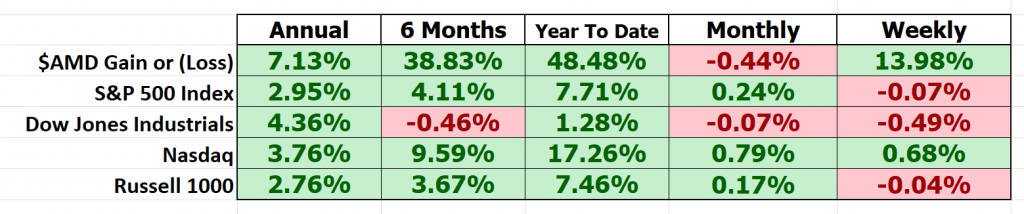
This simple analysis allows us to see that $AMD has outperformed the broader market. However, $AMD has also exhibited significantly more volatility. In instances like this the best case and worst-case analysis show us the magnitude of the rallies and declines which offer a realistic perspective of potential price action moving forward.
The Vantagepoint A.I. Analysis
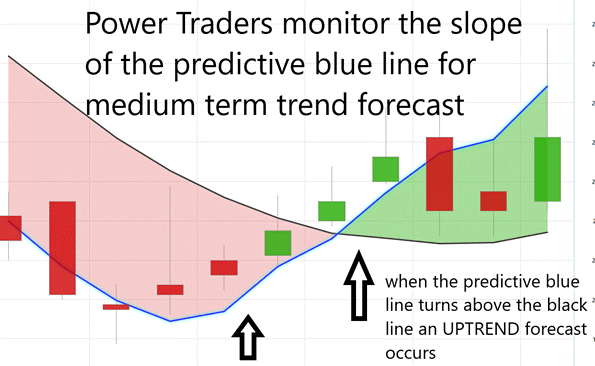
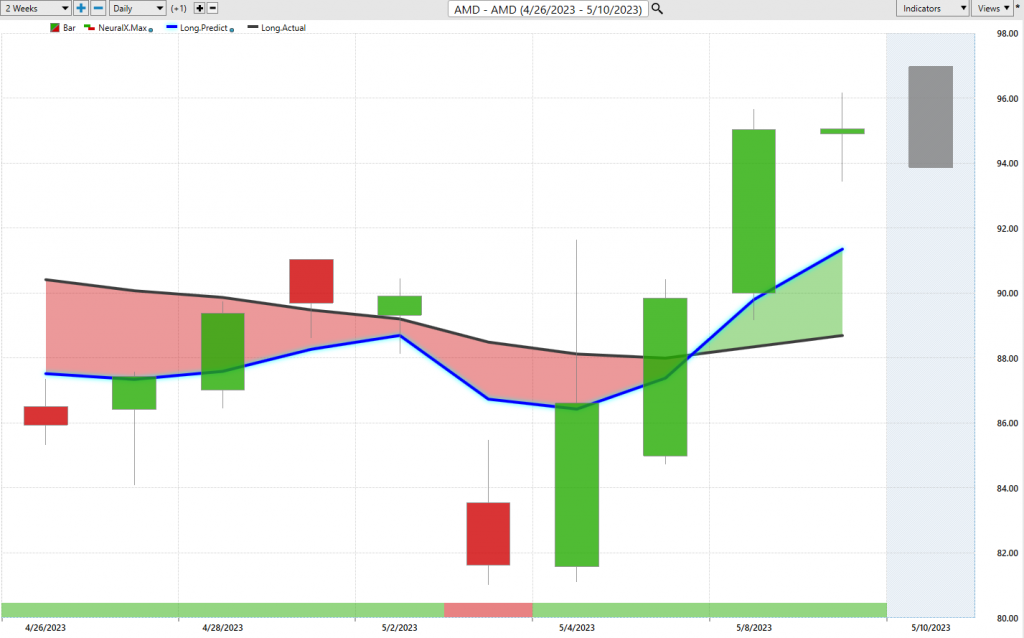
Traders can utilize VantagePoint Software and its artificial intelligence to monitor trend forecasts by observing the slope of the predictive blue line. In contrast, the black line merely indicates past market movements and is a simple 10-day moving average of price.
During uptrends, the predictive blue line serves as a value zone where traders attempt to buy the asset at or below the blue line. Therefore, it is essential to pay attention to the relationship between the black and predictive blue lines when studying the chart.
The predictive blue line, which uses Vantagepoint’s patented Neural Network and Intermarket Analysis, determines an asset’s value by analyzing its strongest price drivers through artificial intelligence and statistical correlations.
For instance, when the predictive blue line moves above the black line, traders are presented with an UP-forecast entry opportunity, indicated by UP arrows on the chart. Conversely, when the predictive blue line falls below the black line, traders can seize a DOWN-forecast entry opportunity. There is no guesswork involved, and traders can always be aware of the trend and value zone. To illustrate the effectiveness of artificial intelligence in a real-time trading scenario, we will analyze the last six months of $AMD stock.
Fine Tuning Entries with The Neural Net Indicator
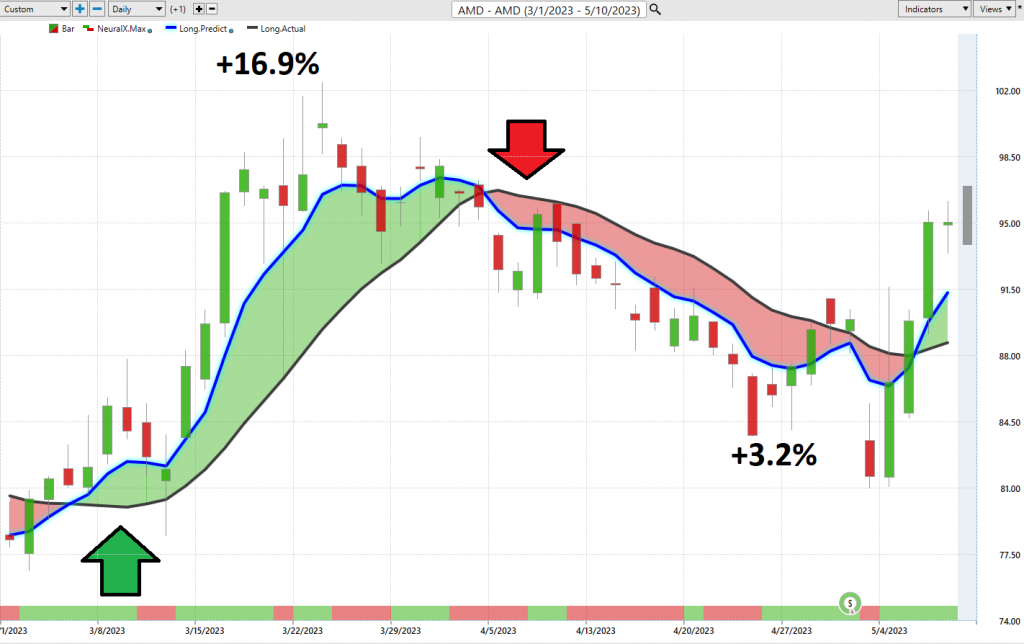
The Neural Network Indicator is located at the bottom of the chart and forecasts future short-term market strength or weakness. A green Neural Net Indicator represents strength, while a red Neural Net Indicator signals short-term weakness.
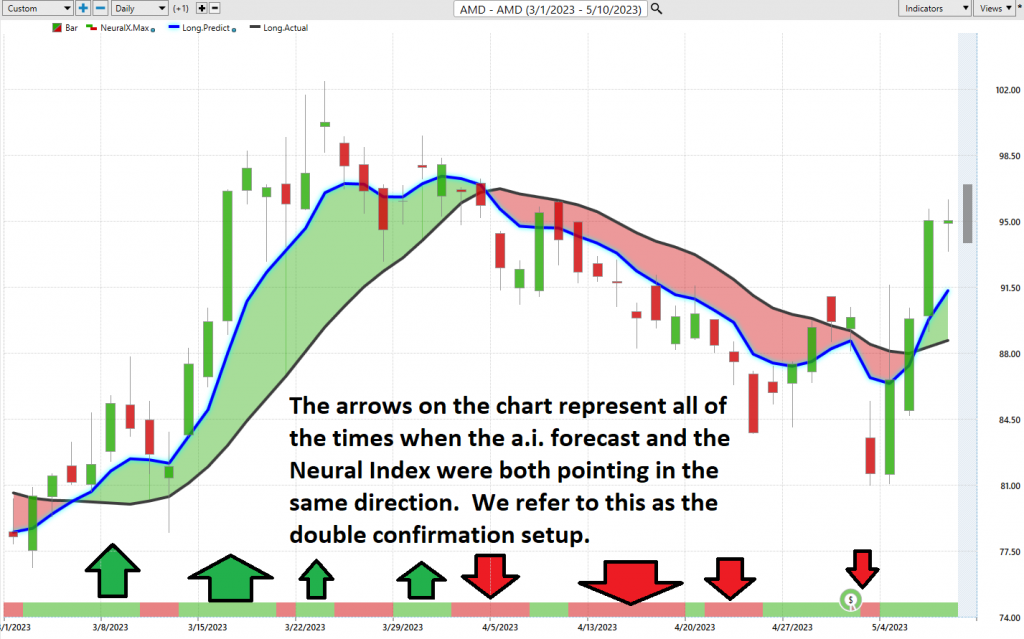
Neural networks are a type of artificial intelligence that imitates the way the human brain learns. They are commonly used in quantitative analysis to make investment decisions based on mathematical and statistical models. By analyzing past data, neural networks can calculate probabilities and predict future market trends. This type of big data analysis is helpful for traders seeking informed investment decisions.
Power Traders seek statistically valid trading setups and look for a DOUBLE confirmation signal. This occurs when both the blue predictive line and Neural Net indicate the same expected future outcome. By cross-referencing the chart with the predictive blue line and Neural Network Indicator, Power Traders can identify optimal entry and exit points.
Traders utilize the Neural Net to confirm their market positions, either LONG or SHORT. For instance, when the A.I. forecast and Neural Net are green, it indicates a buying opportunity. Conversely, when both the A.I. forecast and Neural Net are red, it is a selling opportunity. The arrows on the chart highlight the zones where Power Traders would’ve used double confirmation to find a buying opportunity.
Power Traders continuously utilize both the Neural Network and A.I. to identify statistically sound trading opportunities.
You can see in the chart above how the Neural Net offered several opportunities of double confirmation to Power Traders, when the predictive blue line and the Neural Net aligned with the same forecast. These instances provide very high probability trading opportunities to exploit the trend.
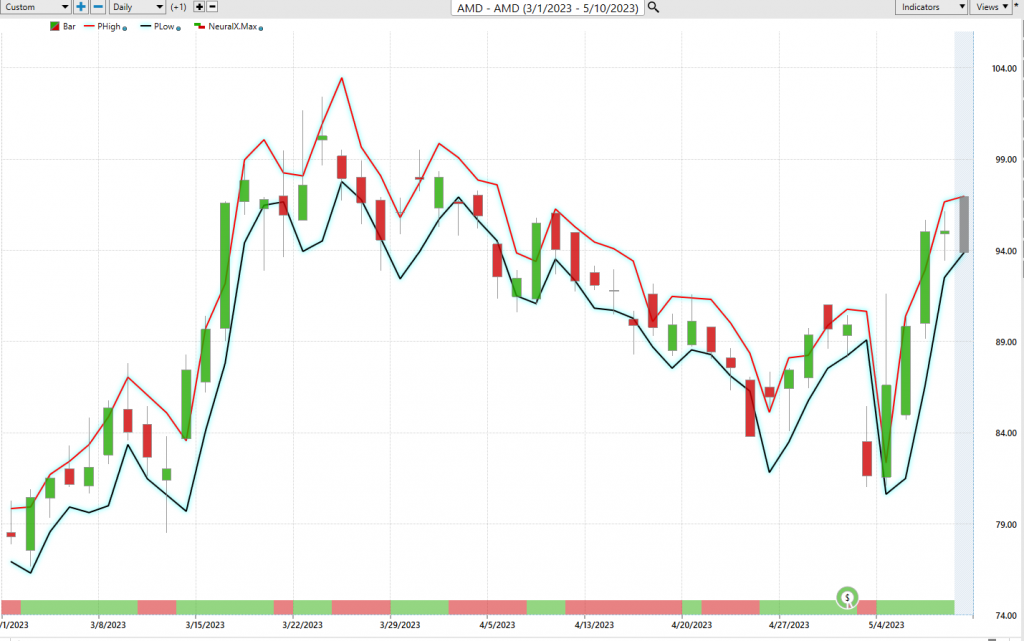
VantagePoint Software Daily Price Range Prediction
One of the powerful features in the VantagePoint Software which Power Traders use daily is the Price Range prediction forecast.
This forecast is what permits Power Traders to truly fine tune their entries and exits into the market.
Every day traders are faced with the anxiety and frustration of wondering where they should be looking to buy and sell the market. VantagePoint’s A.I. makes this decision super easy with the Daily Price Range Forecast.
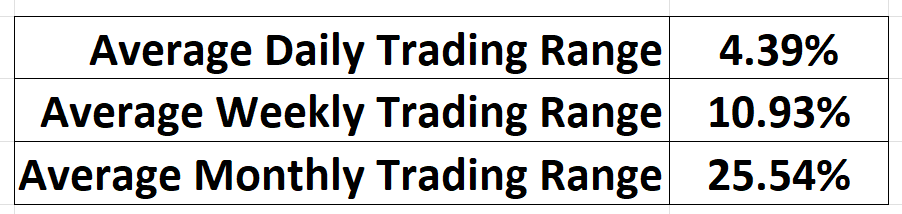
Here are the average trading ranges for the daily, weekly, and monthly times frames for $AMD over the past year.

For short term traders the important question that they have to confront every day is where should I buy? Where should I place my stop? Where should I sell it? The VantagePoint Daily Price Range forecast can help them answer this question.
Study the Vantagepoint Daily Range Forecast chart below to see how with exacting precision the software provides very reliable guidance to short term traders in answering this very important trading question.
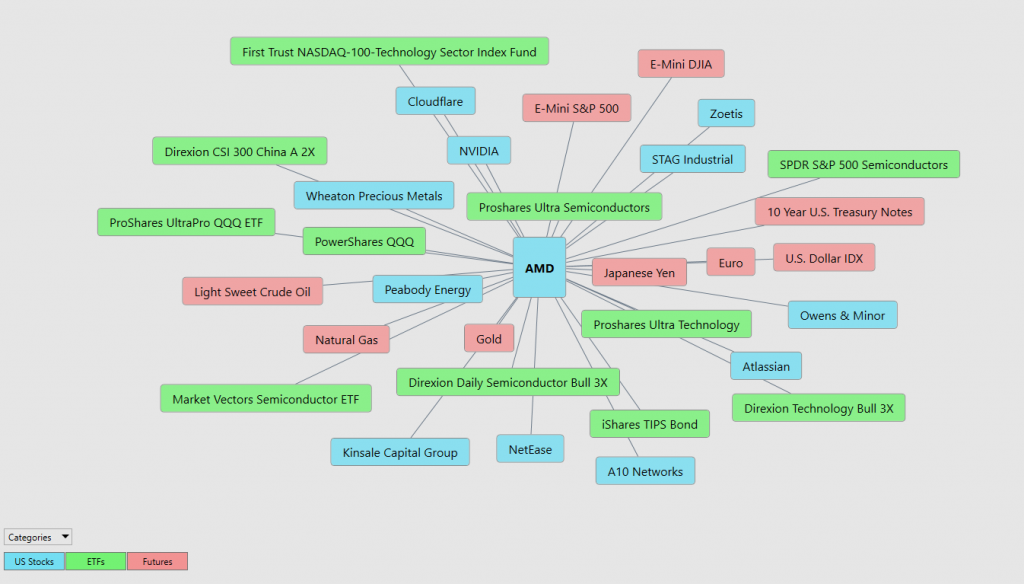
Intermarket Analysis
Vantagepoint Software’s unique ability to perform Intermarket analysis and identify statistically interconnected assets that are the primary driver of price sets it apart in the market.
While chart analysis offers objective insights into support and resistance levels, the interconnectedness of the global marketplace raises the question of what drives prices for underlying assets.
Intermarket analysis recognizes that the financial markets are interconnected, and events in one market can impact prices in other markets.
By studying the relationships between various markets, traders can gain a deeper understanding of how different assets are interconnected, and how market developments in one asset class can affect prices in another. For example, fluctuations in interest rates, commodity prices, or currency values can have a significant impact on stock prices.
The top proponents and developers of intermarket analysis in trading are John Murphy and Louis Mendelsohn. John Murphy’s book “Intermarket Technical Analysis” is widely regarded as a definitive guide to the subject. Louis Mendelsohn is the founder of VantagePoint Software.
These critical price relationships, which are not readily visible, demonstrate extremely high statistical correlations. Factors such as fluctuations in interest rates, crude oil prices, and dollar volatility among thousands of other variables affect companies’ decisions to survive in these challenging times.
Determining these factors is a significant challenge for investors and traders.
Studying and comprehending the key drivers of $AMD’s price action is of great value, as it enables traders to identify the ETFs most likely to acquire $AMD and uncover other industries that impact $AMD’s price movements.
This invaluable knowledge allows traders to locate emerging trading opportunities and view a list of ETFs that are also buyers of $AMD, thus providing a competitive edge in the market.
Suggestion
The trend is UP.
Momentum is UP.
When we compare the performance of $AMD to its main rivals we see that it has outperformed everyone but NVIDIA ($NVDA).
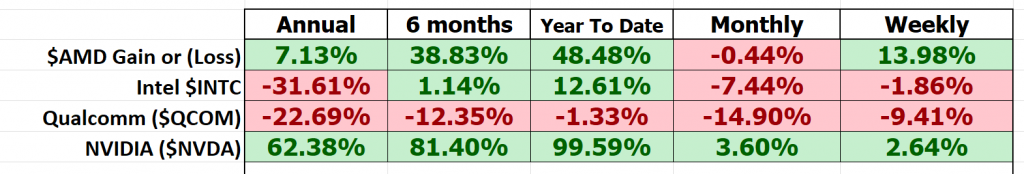
This explains to a very large degree why the story of Microsoft and $AMD partnering together to compete with $NVDA has been so bullishly received by traders and investors.
The predictive blue line is the guidance that we will be following. Wall Street Analysts are slowly revising their estimates upward. We think that pullbacks below the predictive blue lines will create great swing trading opportunities.
Our advice: Follow the a.i. trend analysis and practice good money management on all your trades. The opportunities for short term swing trades abound on $AMD.
With very large average daily, weekly, and monthly trading ranges the A.I. can assist greatly in fine tuning entries and exits for short term trades.
We will re-evaluate this analysis based upon:
- Wall Street Analysts’ Estimates
- 52-week high and low boundaries
- Vantagepoint A.I. Forecast (Predictive Blue Line)
- Neural Network Forecast
- Daily Range Forecast
- Intermarket Analysis
Let’s Be Careful Out There!
Remember, It’s Not Magic.
It’s Machine Learning.

IMPORTANT NOTICE!
THERE IS SUBSTANTIAL RISK OF LOSS ASSOCIATED WITH TRADING. ONLY RISK CAPITAL SHOULD BE USED TO TRADE. TRADING STOCKS, FUTURES, OPTIONS, FOREX, AND ETFs IS NOT SUITABLE FOR EVERYONE.
DISCLAIMER: STOCKS, FUTURES, OPTIONS, ETFs AND CURRENCY TRADING ALL HAVE LARGE POTENTIAL REWARDS, BUT THEY ALSO HAVE LARGE POTENTIAL RISK. YOU MUST BE AWARE OF THE RISKS AND BE WILLING TO ACCEPT THEM IN ORDER TO INVEST IN THESE MARKETS. DON’T TRADE WITH MONEY YOU CAN’T AFFORD TO LOSE. THIS ARTICLE AND WEBSITE IS NEITHER A SOLICITATION NOR AN OFFER TO BUY/SELL FUTURES, OPTIONS, STOCKS, OR CURRENCIES. NO REPRESENTATION IS BEING MADE THAT ANY ACCOUNT WILL OR IS LIKELY TO ACHIEVE PROFITS OR LOSSES SIMILAR TO THOSE DISCUSSED ON THIS ARTICLE OR WEBSITE. THE PAST PERFORMANCE OF ANY TRADING SYSTEM OR METHODOLOGY IS NOT NECESSARILY INDICATIVE OF FUTURE RESULTS. CFTC RULE 4.41 – HYPOTHETICAL OR SIMULATED PERFORMANCE RESULTS HAVE CERTAIN LIMITATIONS. UNLIKE AN ACTUAL PERFORMANCE RECORD, SIMULATED RESULTS DO NOT REPRESENT ACTUAL TRADING. ALSO, SINCE THE TRADES HAVE NOT BEEN EXECUTED, THE RESULTS MAY HAVE UNDER-OR-OVER COMPENSATED FOR THE IMPACT, IF ANY, OF CERTAIN MARKET FACTORS, SUCH AS LACK OF LIQUIDITY. SIMULATED TRADING PROGRAMS IN GENERAL ARE ALSO SUBJECT TO THE FACT THAT THEY ARE DESIGNED WITH THE BENEFIT OF HINDSIGHT. NO REPRESENTATION IS BEING MADE THAT ANY ACCOUNT WILL OR IS LIKELY TO ACHIEVE PROFIT OR LOSSES SIMILAR TO THOSE SHOWN.

