
Despite the popular image of hedge fund managers as financial masterminds who leave no basis point unturned in their relentless pursuit of returns, the reality is investing in the S&P 500 index often outperforms over 90% of hedge funds. Yes, you read that right: the most basic index ETF, one that is often taught to beginners, has been beating out the vast majority of hedge funds and investment managers. The primary reason for this is what is referred to in the industry as the 2/20 barrier.
This 2/20 refers to a 2% fee for assets under management and an additional 20% fee on all returns passing a certain hurdle or threshold. So, if the broader market is up 8.2% like today the average hedge fund would have to be up 10%+ after fees to perform better than the broader market.
With some hedge funds managing money for hundreds, even thousands of investors, it’s becoming increasingly clear that their strategies may not be worth the hefty price tag. But we can learn a lot by studying the data and looking at what has beaten the broader market consistently.
One of the most important questions for investors and traders is, what is winning? Using that question we can look at the problem and understand the data and the tools that top funds are using to consistently win.
The statistics tell a gruesome story for Hedge Funds and Investment Manager’s performance. Only one out of 13 years did the average hedge fund beat the broader market. That represents only 7.6% of the time.
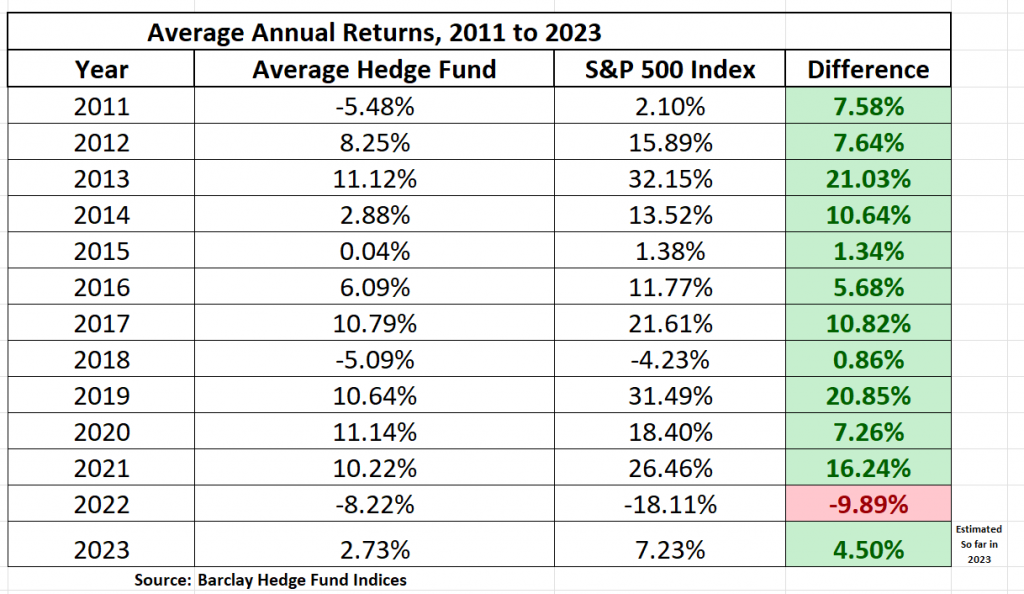
Stated another way, Hedge funds over the last 13 years trailed the performance of the S&P 500 Index by an average of 8.04% per year.
If we look at 2022, which was an “outperform year” for hedge funds, the average hedge fund actually lost -8.22% on the year while the S&P 500 lost -18.11%.
Who were some of the big winners in 2022?
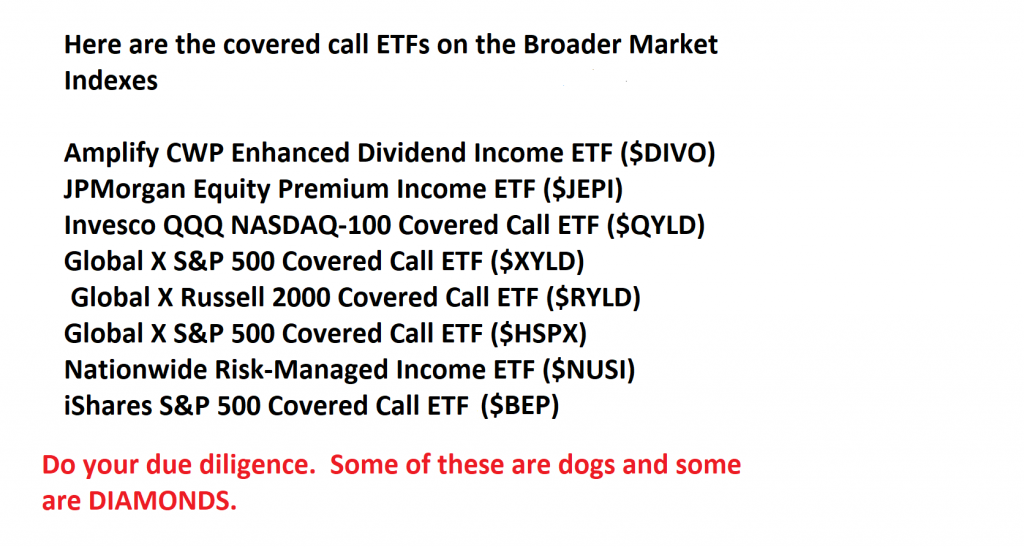
We can learn a lot by looking at the results. One of the performance outliers in 2022 was $DIVO. They lost only –1.48% while the S&P 500 Index lost a whopping -18.85%. Who is $DIVO and how did they accomplish these extraordinary results?
$DIVO is one of the innovative ETF products to outperform the broader market as a Covered Call ETF.
A covered call ETF is a type of exchange-traded fund that generates income by selling call options on the stocks held in its portfolio. The ETF buys a basket of stocks and then sells call options to other investors, giving them the right to purchase the underlying stocks at a predetermined price. This strategy limits the potential gains from the stocks but generates income from the premiums received from the call options. Covered call ETFs are popular among income-seeking investors as they provide steady income with lower volatility than pure equity investments. The $DIVO ETF is 100% always implementing a covered call strategy across its portfolio in all market environments.
I found this quite interesting for many reasons.
First $DIVO is an outlier. (Wisdom always comes from the periphery.) But this tactic very much aligns with the numerous stock studies which we publish on our blog regularly.
Risk is defined as the threat of loss. The simplest way that you can quantify risk is to look at the worst consecutive drawdowns of an asset over the past year. Then a wise investor should plan for those to occur again.
Here is a chart of the drawdowns on the SPY during 2022. You can see that the drawdowns varied from 8.3% to as much as 19.09%.
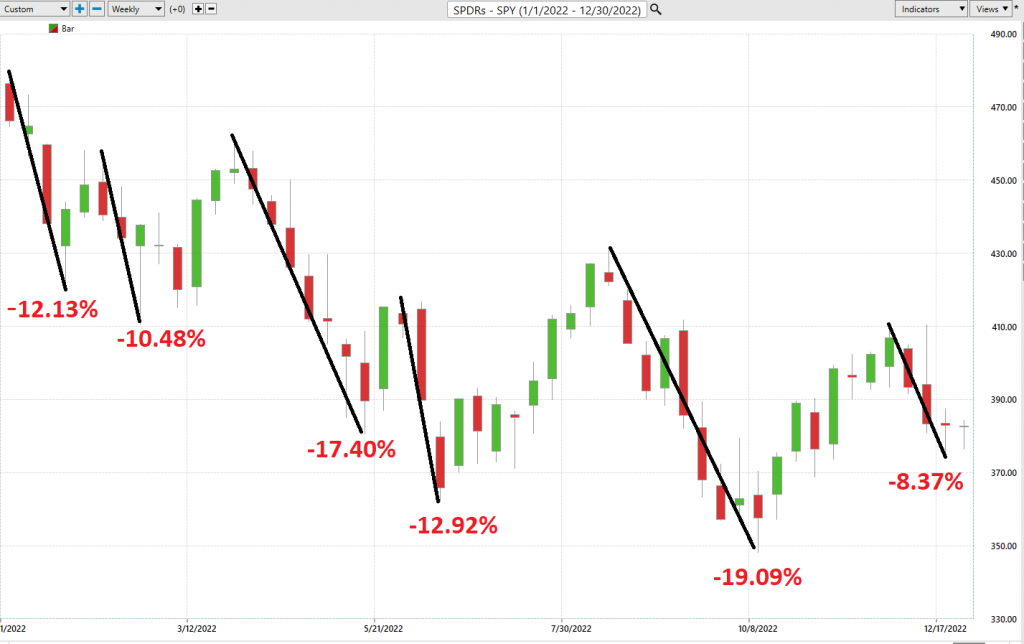
For a buy and hold strategy that can be gruesome. No one wants to repeat those types of drawdowns.
Imagine though if you could use artificial intelligence, machine learning, and neural networks to minimize the downside risk by selling call options when a down forecast occurred. This would allow you to generate income during the downtrend, but this would only act as a partial hedge against price deterioration.
Imagine also if you could use artificial intelligence, machine learning and neural networks to lift the covered call and gain all the upside potential back when an uptrend reasserted itself.
What is needed is a kick-butt trend analysis tool.
Check out the Vantagepoint A.I. TripleCross indicator on the SPDR ETF ($SPY). This indicator combines three predictive moving averages with artificial intelligence and predictive analytics to generate UP and DOWN forecasts for trading. The TripleCross Indicator is designed to identify trends and changes in trend direction and is used by successful traders all over the world.
The indicator uses a proprietary neural network to analyze data from various markets and timeframes and generate forecasts which are proven to be up to 87.4% accurate.
When the short-term predictive moving average crosses above the medium-term predictive moving average, it generates a bullish signal, while a bearish signal is generated when the short-term moving average crosses below the medium-term moving average. The long-term moving average provides additional confirmation of the trend.
Seeing is believing. Check out the trend analysis on the $SPY.
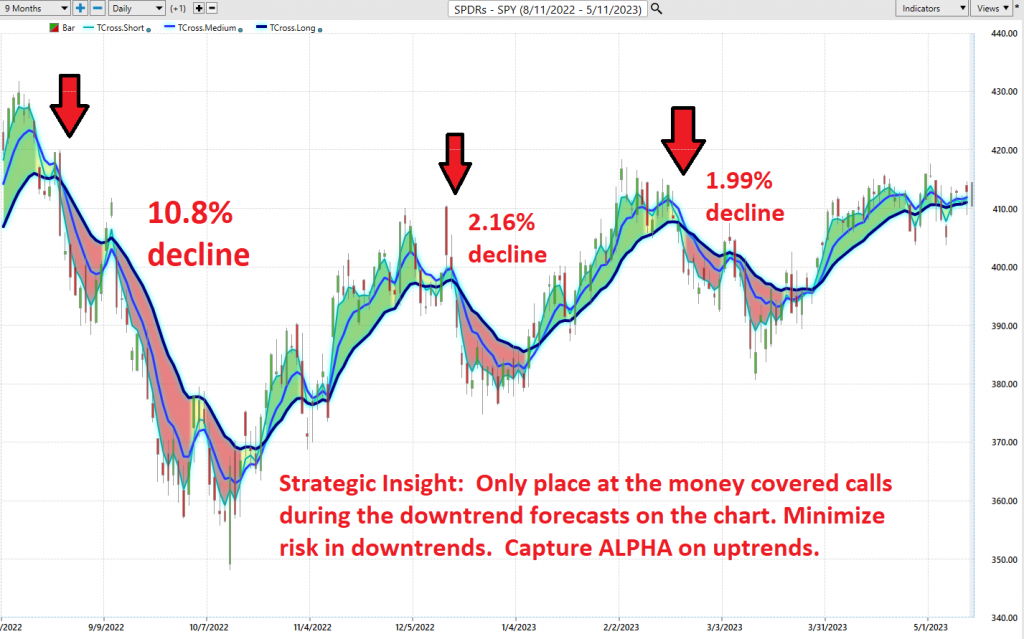
TripleCross keeps traders on the right side of the right trend at the right time. Over the last 9 months the $SPY is down -2.2%. Observe how the TripleCross managed risk.
Overall, the VantagePoint A.I. Triple Cross Indicator is a powerful tool that can help traders identify trends and potential trading opportunities in a wide range of markets.
Years ago, Amazon CEO, Jeff Bezos met Warren Buffett. He recalled asking the investing legend, “Your thesis is so simple. Why don’t more people just copy you?”
Buffett’s reply is worth remembering because it has made Buffett billions: “Nobody wants to get rich slowly.”
It doesn’t have to be complex.
After all, it’s always about the bottom line.
Manage your risk, or it will manage you.
I invite you to explore the possibilities of A.I., machine learning, and neural networks in your trading.
I’d like to invite you to attend one of our Free Live Trainings so that you can see the power of trading with artificial intelligence in real time.
This is how VantagePoint artificial intelligence simplifies and empowers traders daily!
Visit With US and check out the a.i. at our Next Live Training.
It’s not magic. It’s machine learning.
Make it count.

IMPORTANT NOTICE!
THERE IS SUBSTANTIAL RISK OF LOSS ASSOCIATED WITH TRADING. ONLY RISK CAPITAL SHOULD BE USED TO TRADE. TRADING STOCKS, FUTURES, OPTIONS, FOREX, AND ETFs IS NOT SUITABLE FOR EVERYONE.
DISCLAIMER: STOCKS, FUTURES, OPTIONS, ETFs AND CURRENCY TRADING ALL HAVE LARGE POTENTIAL REWARDS, BUT THEY ALSO HAVE LARGE POTENTIAL RISK. YOU MUST BE AWARE OF THE RISKS AND BE WILLING TO ACCEPT THEM IN ORDER TO INVEST IN THESE MARKETS. DON’T TRADE WITH MONEY YOU CAN’T AFFORD TO LOSE. THIS ARTICLE AND WEBSITE IS NEITHER A SOLICITATION NOR AN OFFER TO BUY/SELL FUTURES, OPTIONS, STOCKS, OR CURRENCIES. NO REPRESENTATION IS BEING MADE THAT ANY ACCOUNT WILL OR IS LIKELY TO ACHIEVE PROFITS OR LOSSES SIMILAR TO THOSE DISCUSSED ON THIS ARTICLE OR WEBSITE. THE PAST PERFORMANCE OF ANY TRADING SYSTEM OR METHODOLOGY IS NOT NECESSARILY INDICATIVE OF FUTURE RESULTS. CFTC RULE 4.41 – HYPOTHETICAL OR SIMULATED PERFORMANCE RESULTS HAVE CERTAIN LIMITATIONS. UNLIKE AN ACTUAL PERFORMANCE RECORD, SIMULATED RESULTS DO NOT REPRESENT ACTUAL TRADING. ALSO, SINCE THE TRADES HAVE NOT BEEN EXECUTED, THE RESULTS MAY HAVE UNDER-OR-OVER COMPENSATED FOR THE IMPACT, IF ANY, OF CERTAIN MARKET FACTORS, SUCH AS LACK OF LIQUIDITY. SIMULATED TRADING PROGRAMS IN GENERAL ARE ALSO SUBJECT TO THE FACT THAT THEY ARE DESIGNED WITH THE BENEFIT OF HINDSIGHT. NO REPRESENTATION IS BEING MADE THAT ANY ACCOUNT WILL OR IS LIKELY TO ACHIEVE PROFIT OR LOSSES SIMILAR TO THOSE SHOWN.

