

Molson Coors is a multinational drink and brewing company based in Chicago, USA, and commonly known as Molson Coors. It was formed in 2005 by merging Molson from Canada and Coors from the United States. In 2016, Molson Coors acquired Miller Brewing Company’s full global brand portfolio for approximately $12 billion, making it the world’s third-largest brewer at the time.
Molson Coors was founded in 1786, making it almost 236 years old. The company was founded by John Molson in Montreal, Canada. They have approximately 17,000 employees. Their main competitors are Anheuser-Bush InBev, Heineken, Carlsberg, and Constellation Brands. Molson Coors produces numerous beers and beverages including Coors Light, Miller Lite, Blue Moon, Carling, Molson Canadian, and Keystone Light.
It has a market cap of $13.2 billion, and a trades average volume of 2.6 million shares per day.
In this weekly stock study, we will look at and analyze the following indicators and metrics as our guidelines:
- Wall Street Analysts’ Estimates
- 52-week High and Low Boundaries
- Vantagepoint A.I. Forecast (Predictive Blue Line)
- Neural Network Forecast
- Daily Range Forecast
- Intermarket Analysis
- Our Suggestion
We only look at things like earnings or fundamental cash flow valuations to better understand the financial landscape that a company is operating under. Our approach and only loyalty is to the trend as dictated by the artificial intelligence, neural networks, and intermarket analysis.
Analysts Ratings
The 16 analysts offering 12-month price forecasts for Molson Coors Beverage Co have a median target of $58.50, with a high estimate of $68.00 and a low estimate of $50.00. The median estimate represents a -10.14% decrease from the last price of 65.10.
This means that according to top Wall Street analysts $TAP is slightly overvalued at the present time.
52-week High-Low Chart
Over the last 52 weeks $TAP has traded as high as $66.67 and as low as $46.69. This provides us with an annual trading range of $19.98.
What we do next is divide the annual trading range ($19.98) by the current price ($65.08) to provide us with a very basic and generic calculation of the annualized volatility for $TAP, which is currently 30.7%. This metric tells us that should the following year by like the past 12 months, that it would be considered normal to see $TAP trade within a range that could be 30.2% higher and/or lower than its current price level.
We refer to these as the commonsense metrics which we use as baseline measurements of understanding normal value. When using artificial intelligence, we look to amplify our returns based upon these baseline measurements.
We like to publish these boundaries on the chart simply to see how price responded at these different levels.
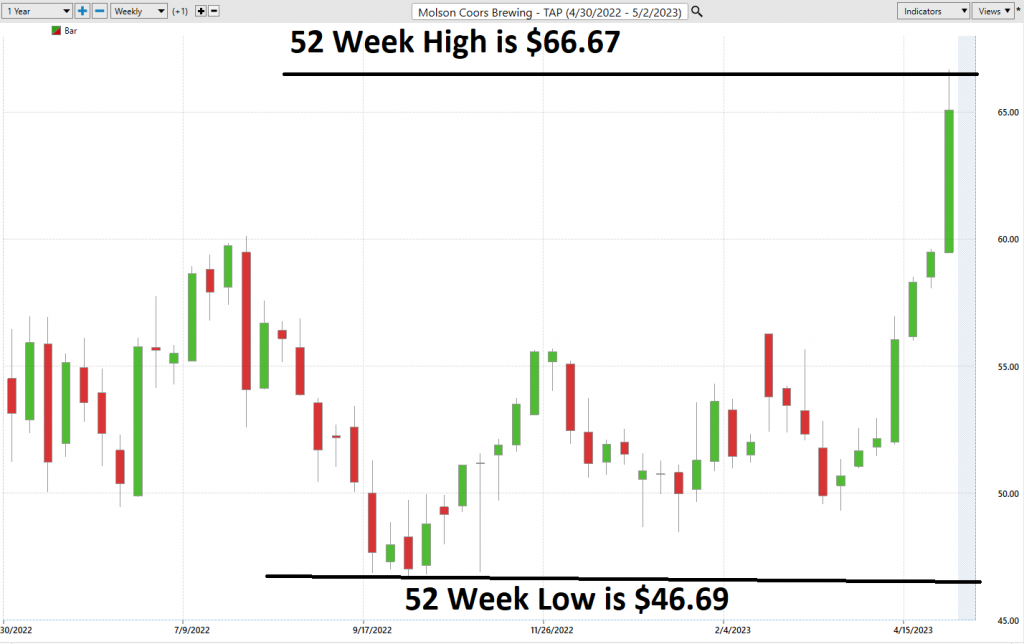
We always pay attention to where we are in relation to the 52-week trading range. It’s very common to see the 52-week high provide strong resistance to the market until it is breached. Often when the 52-week high is breached we will see the stock price explode higher very quickly over a very short period.
Paying attention to the 52-week high and low boundaries paid off for Power Traders. Monitoring this metric and cross-referencing it with the A.I. allowed traders to carefully position themselves three weeks ago when the 52-week high was first being breached.
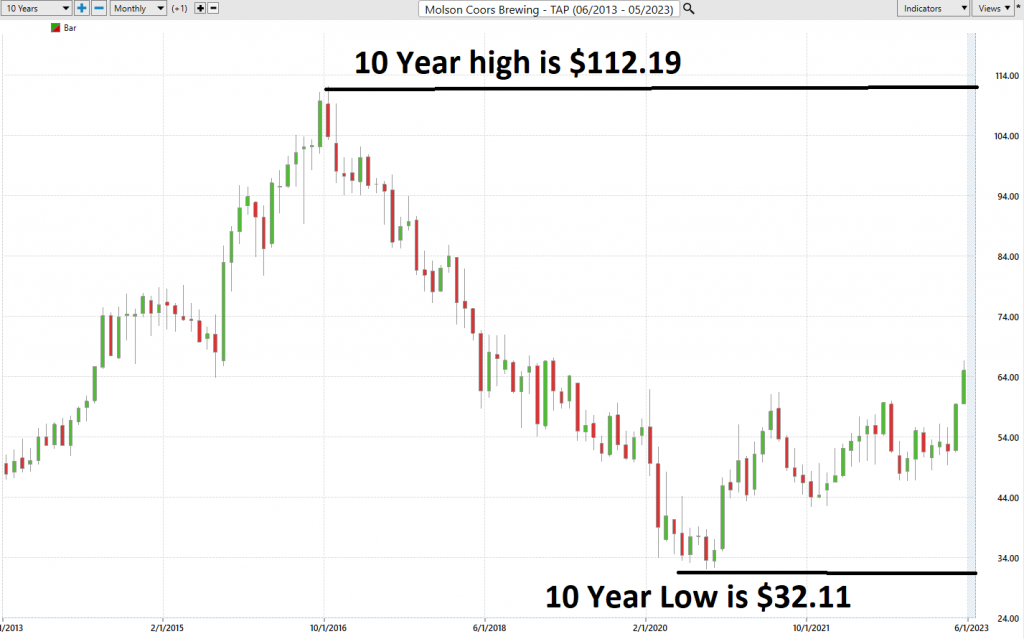
When we zoom out and look at the price action in relation to the 10-year monthly price chart we can see that $TAP has huge upside potential if it continues to build on its recent technical successes.
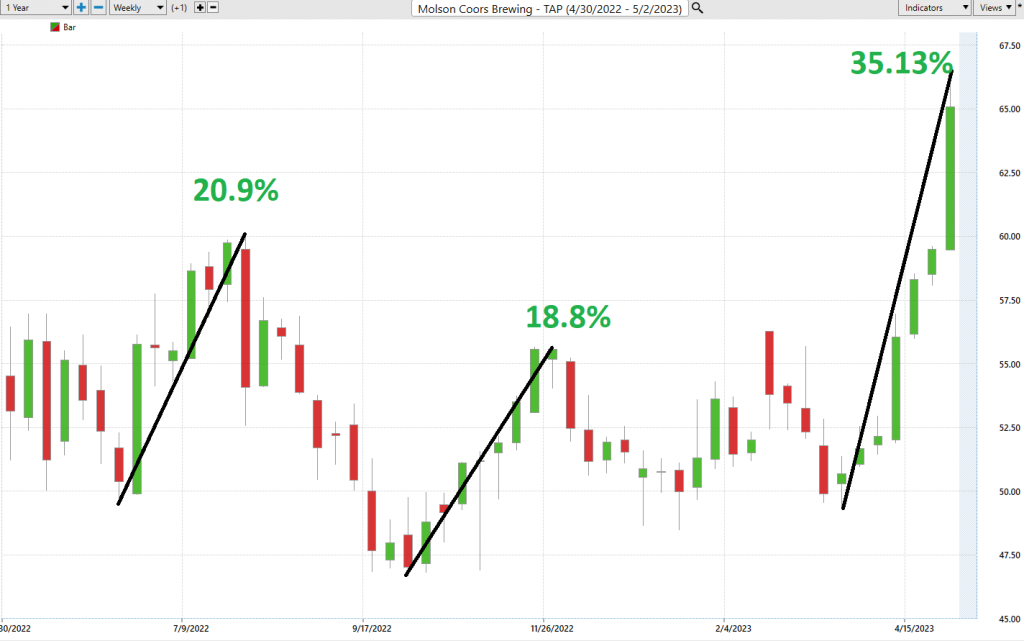
Best Case – Worst Case Scenarios
By examining the long-term 52-week chart, we can assess the best and worst-case scenarios for an asset and gain an understanding of its risk and volatility. This analysis is valuable for investors and traders as it reveals the potential risks and rewards over the past year, providing a real-world, real-time perspective. It is a practical way to understand the volatility of the asset by displaying corresponding gains and losses over time. This information is plotted on the chart, allows for a clear visualization of the asset’s historical performance.
First off, the best-case scenario:
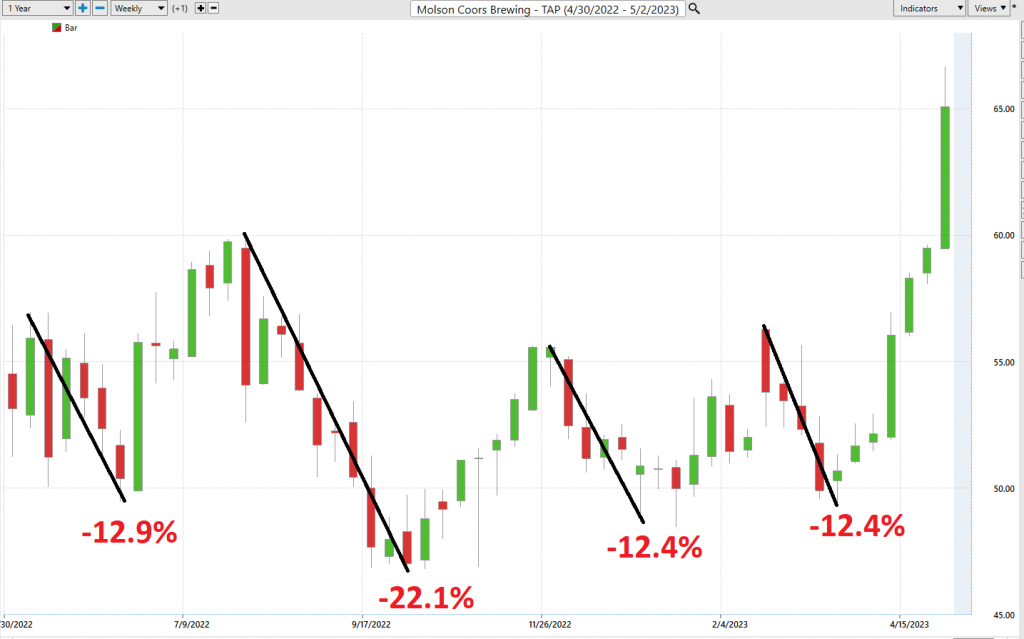
Followed by the worst-case scenario:
Next, we compare $TAP to the broader stock market indexes to get an idea of its relative performance.
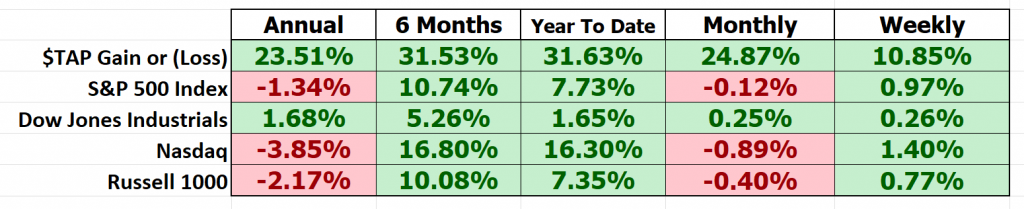
So, in $TAP we have an asset over that has outperformed the broader stock market indexes.
Lastly, we often like to drill down and compare $TAP to the other market leaders of Beer Manufacturers to compare how $TAP has performed relative to competitors.
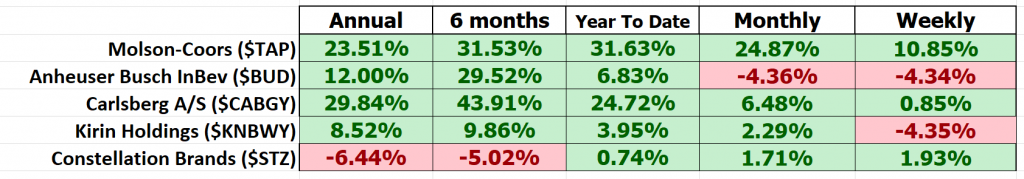
What we can learn from this simple analysis is that $TAP has performed well across all time frames and from a performance standpoint it has equaled or beaten its main competitors.
The Vantagepoint A.I. Analysis
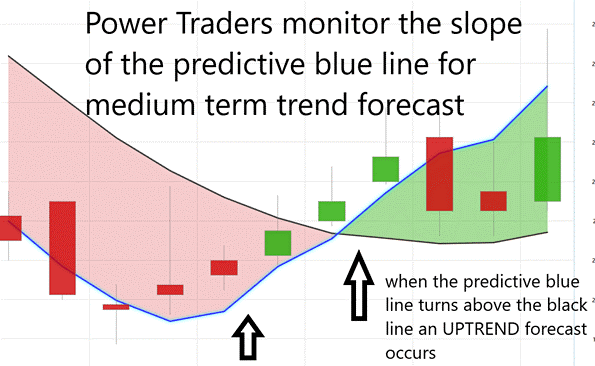
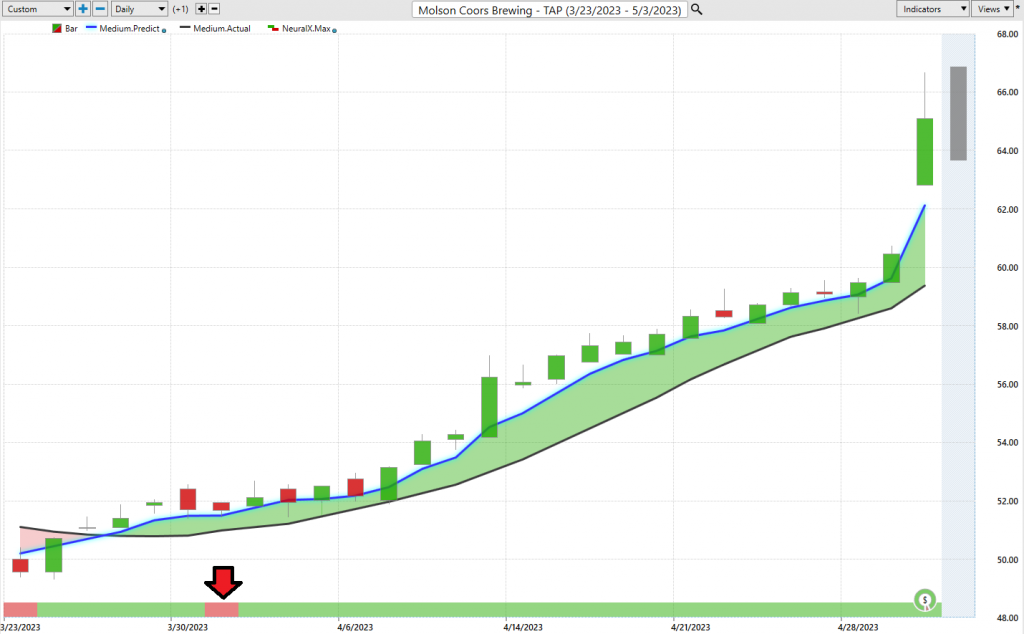
When analyzing the chart below, it’s important to focus on the slope of the blue line. This predictive line is derived using Vantagepoint’s patented Neural Network and Intermarket Analysis to evaluate the most influential price drivers of the asset through artificial intelligence and statistical correlations. By examining the recent price action of $TAP over the past few months, we can utilize the power of artificial intelligence to understand its trend. The slope of the predictive blue line indicates the price trend of the asset.
Power traders can use the predictive blue line to help to determine both the value zone as well as the trend direction. Two consecutive closes above the predictive blue line define where an uptrend forecast occurs.
When the SLOPE of the predictive blue line turns higher it becomes clear that a change in price direction is upon us.
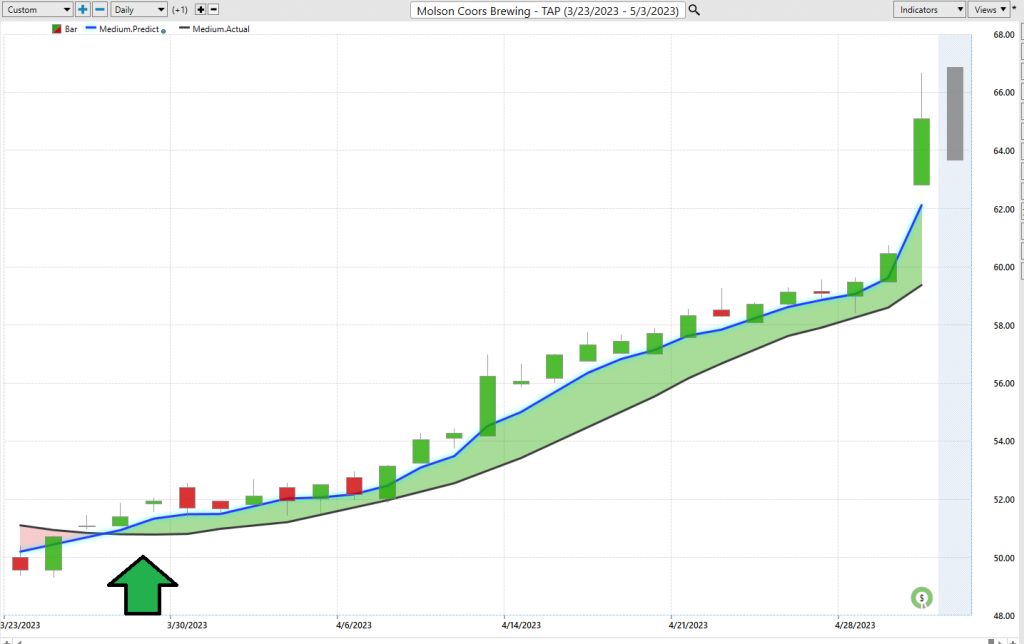
Observe how the SLOPE of the predictive blue line started moving higher a few days before it moved above the black line. A very strong trend was evidenced by seeing that price was consistently closing above the predictive blue line.
Fine Tuning Entries with The Neural Net Indicator
Located at the bottom of the chart is the Neural Network Indicator, which forecasts market strength or weakness for the next 48 to 72 hours. Green indicates strength, while red signals short-term weakness. A Neural Net is a computational learning system that uses a network of functions to interpret large amounts of data and produce a desired output, continually improving its performance through self-monitoring.
For Power Traders seeking optimal entry and exit points, we recommend using the DOUBLE CONFIRMATION setup, which involves cross-referencing the chart with both the predictive blue line and the neural network indicator. This approach ensures alignment between the Neural Index and the artificial intelligence trend forecast.
Power Traders are always seeking statistically sound trading opportunities and can utilize both the neural network and artificial intelligence to achieve this goal. We advise Power Traders to cross-reference the predictive blue line with the Neural Net to identify the best entry opportunities.
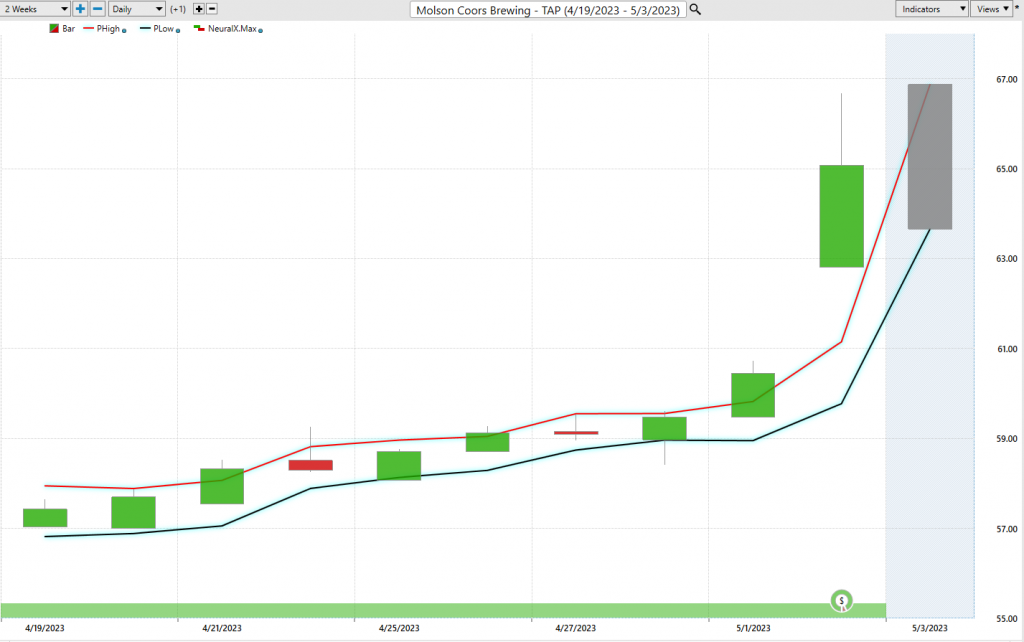
VantagePoint Software Daily Price Range Forecast
One of the powerful features in the Vantagepoint A.I. Software which Power Traders use daily is the Daily Price Range prediction forecast.
This forecast is what permits Power Traders to truly fine tune their entries and exits into the market. Every trader, whenever they decide to trade, must make the decision regarding where they should get in and where they should get out. The Vantagepoint A.I. Daily Range Forecast answers these questions with exacting precision.
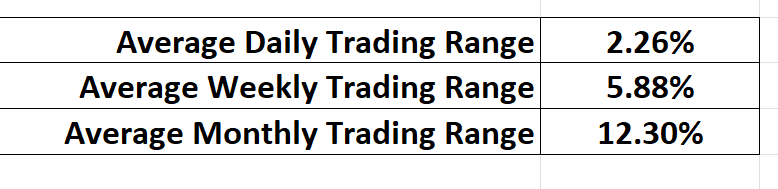
Here are the baseline averages of the trading ranges for the daily, weekly, and monthly time frames. While these metrics are important, all they tell us is what has occurred in the past.
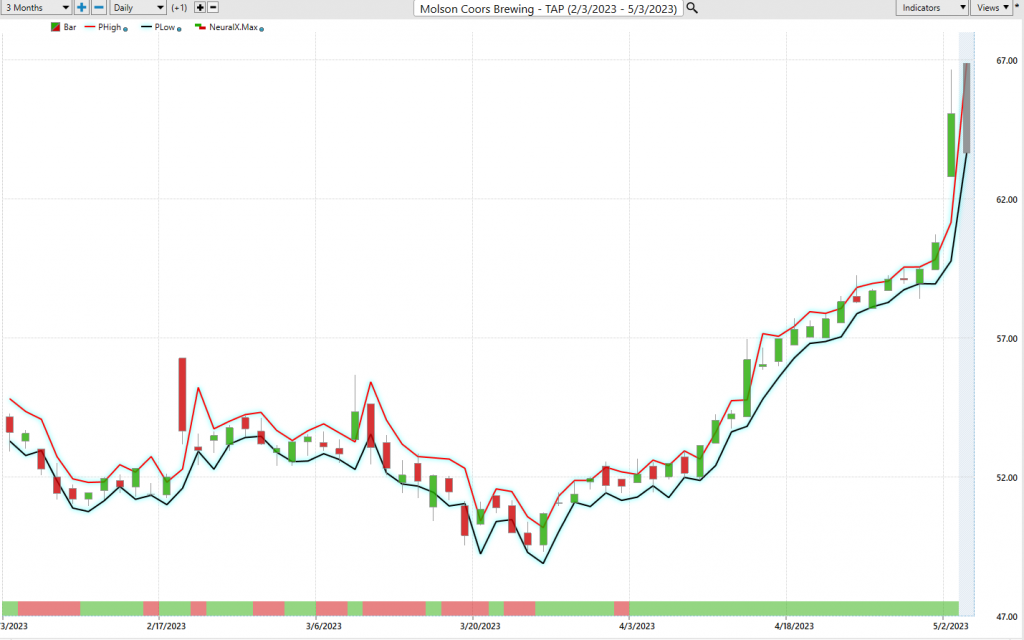
Here is the price chart of $TAP during the most recent runup featuring the Daily Price Range forecast and the Neural Net Indicator.
Intermarket Analysis
The challenge for all investors and traders is to differentiate between opinion and fact.
What sets the Vantagepoint Software apart is its ability to perform intermarket analysis and identify the assets that are most statistically interconnected, serving as the key drivers of price. While charts provide objective realities for locating support and resistance levels, it’s crucial to understand that we operate in a global marketplace, where everything is interconnected.
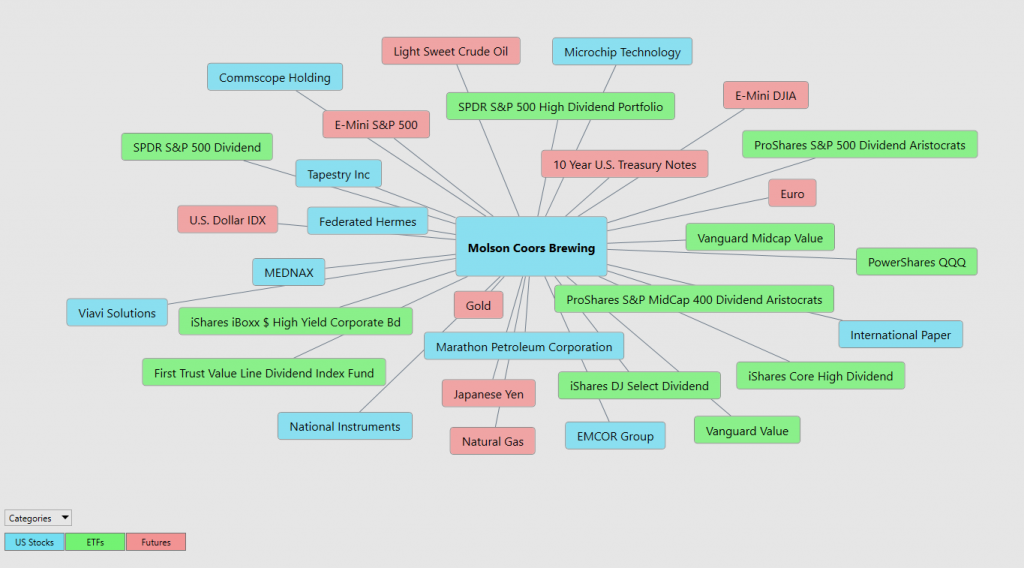
Traders are always seeking to identify the key drivers of price for the underlying asset they are trading, and these factors are often intangible and invisible to the naked eye, yet highly correlated statistically. Changes in interest rates, crude oil prices, and the volatility of the dollar, among other variables, impact the decisions companies must make to succeed in today’s challenging market.
Studying and comprehending the key drivers of $TAP’s price action can provide tremendous value, as it allows traders to identify which ETFs are acquiring $TAP and uncover other industries that affect its price movement. This knowledge can be invaluable in locating other trading opportunities and identifying them in their early stages.
In today’s challenging times, even minor fluctuations in interest rates, crude oil prices, and the volatility of the dollar, among numerous other variables, can significantly impact the decisions that companies must make to stay afloat. However, identifying these key factors remains a significant challenge for investors and traders.
Our Suggestion
The trend in $TAP is UP.
Momentum is UP!
We expect that pullbacks will be short lived and will simultaneously test the breakout from its recent 52-week high.
There is plenty of volatility in $TAP that swing traders can use the artificial intelligence to position themselves on the daily and weekly time frames for short quick trades.
Earnings are forecasted to grow by 18.6% per year moving forward. This will lead Wall Street analysts to revise their estimates upward.
Our recommendation is – follow the A.I. trend analysis and practice good money management on all trades. We will be actively looking to buy the bottom of the range forecast and to sell at the top.
We will re-evaluate based upon:
- New Wall Street Analysts’ Estimates
- New 52-week high and low boundaries
- Vantagepoint A.I. Forecast (Predictive Blue Line)
- Neural Network Forecast
- Daily Range Forecast
Let’s Be Careful Out There!
Remember, It’s Not Magic.
It’s Machine Learning.

IMPORTANT NOTICE!
THERE IS SUBSTANTIAL RISK OF LOSS ASSOCIATED WITH TRADING. ONLY RISK CAPITAL SHOULD BE USED TO TRADE. TRADING STOCKS, FUTURES, OPTIONS, FOREX, AND ETFs IS NOT SUITABLE FOR EVERYONE.
DISCLAIMER: STOCKS, FUTURES, OPTIONS, ETFs AND CURRENCY TRADING ALL HAVE LARGE POTENTIAL REWARDS, BUT THEY ALSO HAVE LARGE POTENTIAL RISK. YOU MUST BE AWARE OF THE RISKS AND BE WILLING TO ACCEPT THEM IN ORDER TO INVEST IN THESE MARKETS. DON’T TRADE WITH MONEY YOU CAN’T AFFORD TO LOSE. THIS ARTICLE AND WEBSITE IS NEITHER A SOLICITATION NOR AN OFFER TO BUY/SELL FUTURES, OPTIONS, STOCKS, OR CURRENCIES. NO REPRESENTATION IS BEING MADE THAT ANY ACCOUNT WILL OR IS LIKELY TO ACHIEVE PROFITS OR LOSSES SIMILAR TO THOSE DISCUSSED ON THIS ARTICLE OR WEBSITE. THE PAST PERFORMANCE OF ANY TRADING SYSTEM OR METHODOLOGY IS NOT NECESSARILY INDICATIVE OF FUTURE RESULTS. CFTC RULE 4.41 – HYPOTHETICAL OR SIMULATED PERFORMANCE RESULTS HAVE CERTAIN LIMITATIONS. UNLIKE AN ACTUAL PERFORMANCE RECORD, SIMULATED RESULTS DO NOT REPRESENT ACTUAL TRADING. ALSO, SINCE THE TRADES HAVE NOT BEEN EXECUTED, THE RESULTS MAY HAVE UNDER-OR-OVER COMPENSATED FOR THE IMPACT, IF ANY, OF CERTAIN MARKET FACTORS, SUCH AS LACK OF LIQUIDITY. SIMULATED TRADING PROGRAMS IN GENERAL ARE ALSO SUBJECT TO THE FACT THAT THEY ARE DESIGNED WITH THE BENEFIT OF HINDSIGHT. NO REPRESENTATION IS BEING MADE THAT ANY ACCOUNT WILL OR IS LIKELY TO ACHIEVE PROFIT OR LOSSES SIMILAR TO THOSE SHOWN.

