
![]()
Apple Inc. (AAPL), a global tech giant, that manufactures cutting-edge electronics, software, and services. $AAPL has a very well diversified portfolio of products and services, and they are consistently innovating to stay on the cutting edge of technology.
Apple’s stock has a significant impact on the market due to its representation of over 6% of the S&P 500 and over 12% of the NASDAQ. This leads many analysts to say that as goes $AAPL so goes the broader market.
Over the past year, Apple reported a decrease in revenues of over 5%, profits also decreased by over 7%, and free cash flow by over 30% year over year. These metrics have analysts very concerned about the future outlook of the tech giant.
While Apple is the biggest company in the world with a market value of around $2.62 trillion dollars, the company is under significant pressure to make significant changes to their core business. For example, 95% of iPhone supplies come from China, and due to various factors, such as the pandemic, geopolitical risks, and trade tensions, the company is under pressure to diversify its supply chain outside of China. The global smartphone shipments fell by 17% this past quarter, making it the smartphone market’s worst performance in a decade.
Apple is primarily a hardware company, with over 80% of its revenues coming from hardware sales, including Macs, iPads, wearables, such as the Apple Watch and AirPods, and the iPhone. Therefore, it is essential for investors to understand the risks and challenges the company faces in its supply chain and demand for personal electronics, as these can significantly impact Apple’s business segments.
Apple’s iPhone alone generates approximately 56% of the company’s total revenue. This is why there is a significant need to diversify the iPhone supply chain. Apple’s Services segment represents the software side of their business, including the App Store, iTunes, iCloud, Apple TV, Apple Pay, and other elements inside the Apple ecosystem. During the pandemic, all of Apple’s business segments were highly successful, with record growth and sales, including a 34% increase in iPhone revenues, a 24% increase in Mac revenues, a 17% increase in iPad revenues, a nearly 20% increase in wearables revenue, and a 27% increase in Services revenue. Apple also reported double-digit increases in the number of new users in their ecosystem, with around half of the Mac and iPad purchases coming from first-time Apple buyers.
However, despite the significant growth, it turns out that much of it was pulled forward from the future. As a result, Apple experienced a significant drop in revenue, gross profits, and free cash flows during the fourth quarter of 2022. Earnings are forecast to grow 6.89% per year but the company has a high level of debt.
One factor that has many Wall Street analysts concerned is that China, the largest smartphone market in the world, is also in an economic slump.
Recent reports suggest that the launch of iPhone 14 sales experienced an approximate 11% decline versus the iPhone 13 launch from the previous year. While global inflation and recessions may be contributing factors, the lack of demand for the iPhone can also be attributed to the product itself.
However, the lack of demand is not the only issue facing Apple. Recent estimates suggest that 95% of total iPhone supplies come from China, with around 80% of them being made in Foxconn’s Jungjo Factory. This number is as high, or higher, for Apple’s AirPods, Macs, and iPads, which means that production of Apple’s biggest revenue generators is at the mercy of the Chinese government. This is Apple’s single biggest vulnerability and investment risk today.
To mitigate this risk, Apple is attempting to move some of its manufacturing out of China and into India. Apple wants India to account for 25% of their iPhone manufacturing, up from around 6% today. However, even if successful, 75% of iPhone production would still happen in China.
Apple is also feeling political pressure due to its App Store revenues, which many consider monopolistic, and antitrust regulators are getting involved. Therefore, a big move by Apple could be on the horizon. Many top analysts are speculating that Apple could be pressured into making bold moves, such as buying a real content company like Disney or an automotive company like Fiat Chrysler.
Apple’s massive cash pile puts them in a unique position to build or buy their next category-killing product. Smart home devices, health and fitness, and virtual and augmented reality are just a few examples of markets where Apple will make its next big impact. If they capture even a small percentage of these markets, they could see billions of dollars in additional annual revenue.
$AAPL is trading at 28 times earnings.
The Apple Worldwide Developer Conference (WWDC) is set to occur on June 6th and has the industry very excited to learn about Apples new products and innovations. At the top of the list is SWIFT which is Apples proprietary software. The expectations are that the software will be enabled with new API’s allowing developers to increase functionality of the iPad and iPhone apps and software even on Windows platforms. They are also planning to release an Augmented Reality Virtual Reality Headset.
In this weekly stock study, we will look at and analyze the following indicators and metrics as are our guidelines which dictate our behavior in deciding whether to buy, sell, or stand aside on a particular stock.
- Wall Street Analysts’ Estimates
- 52-week high and low boundaries
- Best Case – Worst Case Analysis
- Vantagepoint A.I. Forecast (Predictive Blue Line)
- Neural Network Forecast
- Daily Range Forecast
- Intermarket Analysis
- Our Suggestion
We don’t base our decisions on things like earnings or fundamental cash flow valuations. However, we do look at them to better understand the financial landscape that a company is operating under.
Analysts Ratings
In our stock study, the first set of boundaries we consider are the opinions of professionals who monitor the stock for a living. We can obtain this information by examining the boundaries set by top Wall Street analysts for $AAPL. These initial boundaries give us an idea of what is considered expensive, fairly valued, and cheap.
According to the 12-month price targets offered by 26 Wall Street analysts in the past three months, the median price target for Apple is $173. The high forecast is $205.00, and the low forecast is $116.00. This indicates that the median price target represents a 4.15% increase from the last price of $166.10. Therefore, based on this analysis, we can conclude that $AAPL is currently fairly valued, but some experts on Wall Street believe that it has the potential to rise up to 20%.
This wide divergence in analyst’s opinion on a widely held stock is what is responsible for volatility in the price of the stock.
52-week High-Low Chart
When analyzing an asset, it is crucial to evaluate where it stands in relation to its 52-week highs. Great stocks tend to consistently make new 52-week highs, even though it may seem counterintuitive. One of the simplest ways to evaluate a stock is to examine long-term monthly and weekly charts to determine the trend. Successful traders often use longer-term monthly charts for trend analysis.
The 52-week high often acts as significant resistance in thwarting trends, and it is common to see the stock price explode higher quickly over a short period once this level is breached. As the price bounces off this level, it is crucial to focus on what the artificial intelligence forecast is signaling.
Over the past 52 weeks, $AAPL has traded as high as $178.49 and as low as $124.17, with an annual trading range of $54.32. By dividing the annual trading range of $54.32 by the current price of $166, we can calculate a broad-based measure of volatility, which is 32.8%. This indicates that it is normal to see $AAPL stock trade up to 32.8% higher or lower than its current trading price over the next 12 months. Therefore, if the stock stays within these broad boundaries, it would be considered normal based on its current volatility.
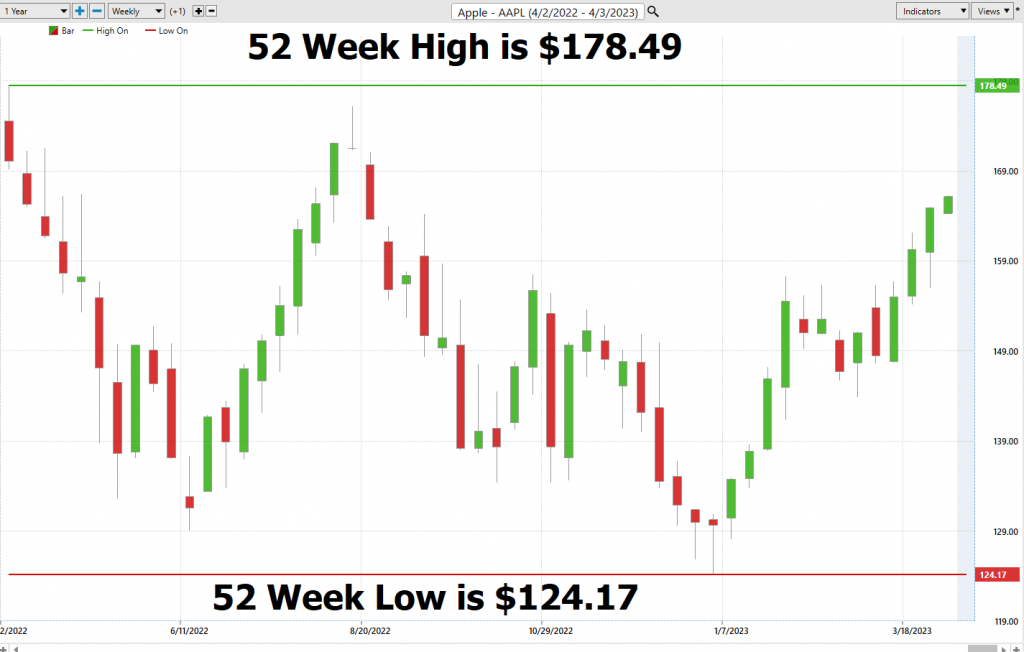
$AAPL’s challenging performance in 2022 has led it to trade at its 76th percentile based on its annual range.
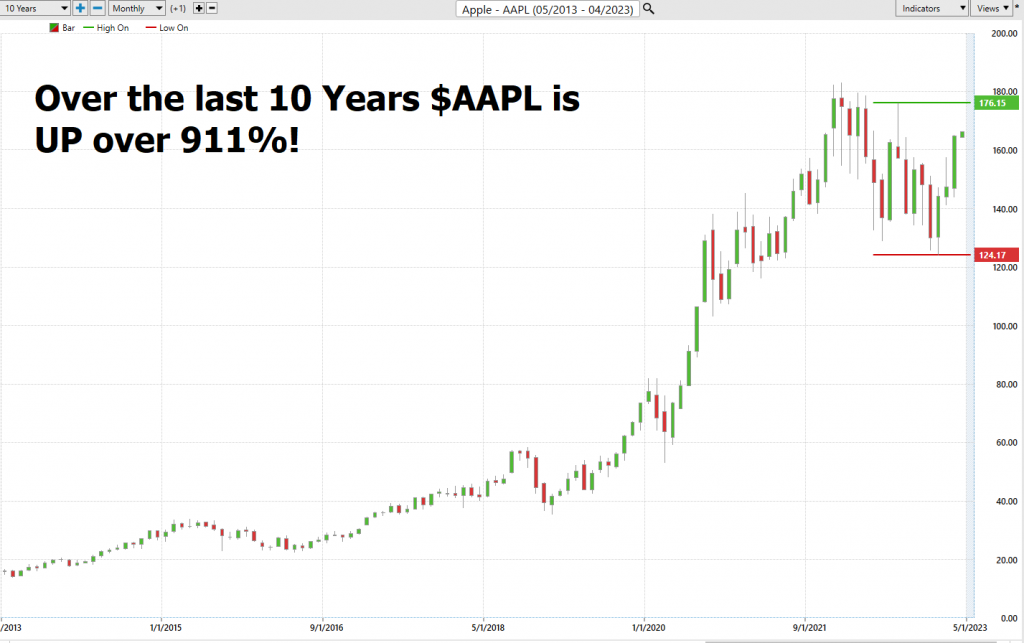
Scanning the 10-year chart provides traders and investors a perspective of what a powerful growth stock $AAPL has been over the past decade.
Best Case – Worst Case Analysis
Looking at a price chart in the stock market and comparing overall market rallies to market declines provides a very real-world perspective of volatility because it shows how prices can fluctuate rapidly and dramatically in response to market events, investor sentiment, and other factors. The price chart provides a visual representation of how the market has moved over time, showing the ups and downs of the market in a way that is easy to understand.
For example, during a market rally, the price chart will show a steady increase in prices, with occasional dips or corrections along the way. This reflects a period of optimism and confidence in the market, with investors buying up stocks in anticipation of future gains. However, during a market decline, the price chart will show a steep drop in prices, with occasional brief rallies along the way. This reflects a period of fear and uncertainty, with investors selling off stocks in anticipation of further losses. More importantly, before you step in and start trading you can compare the magnitude of rallies to declines and understand real world expectations.
By comparing these rallies and declines, traders can see just how quickly market sentiment can shift, and how volatile the market can be. This real-world perspective can help investors make informed decisions about when to buy and sell stocks, and can also help them prepare for potential losses during times of market volatility.
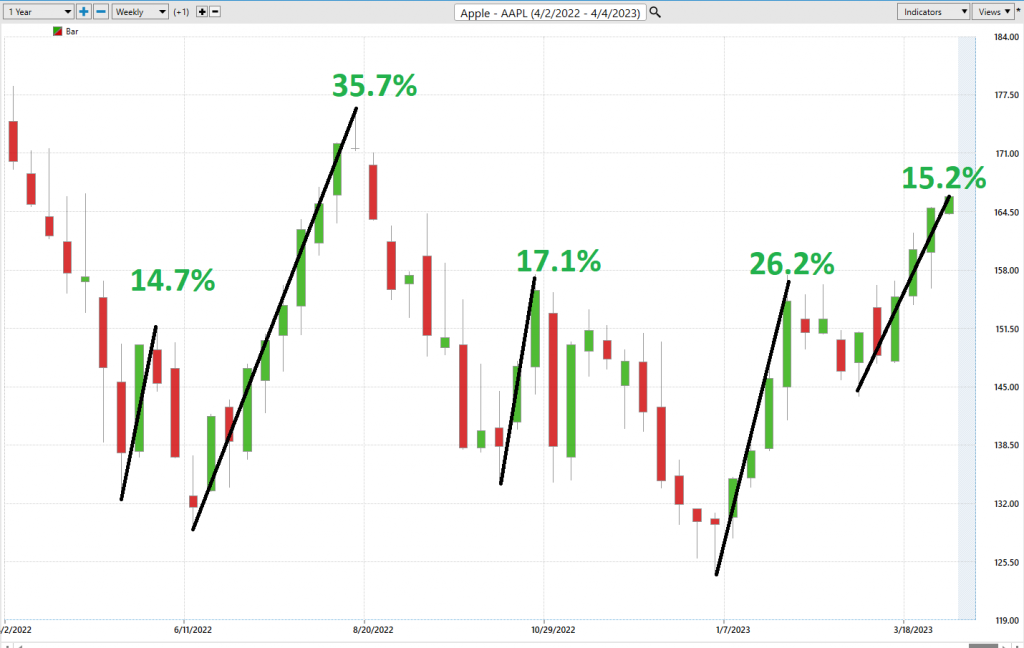
Here is the best-case analysis for $AAPL:
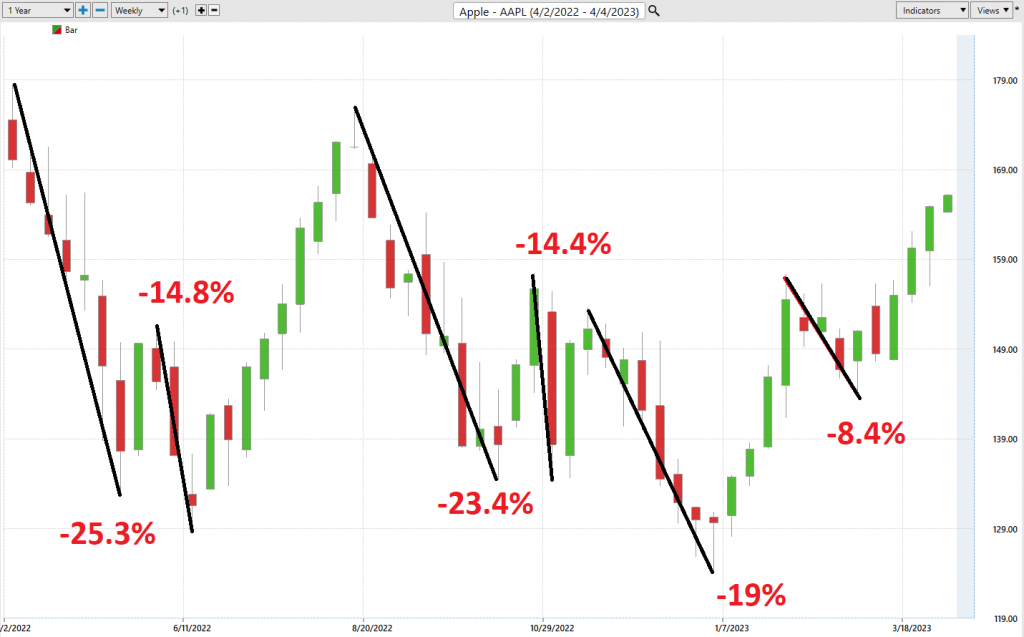
Next we look at the worst case performance:
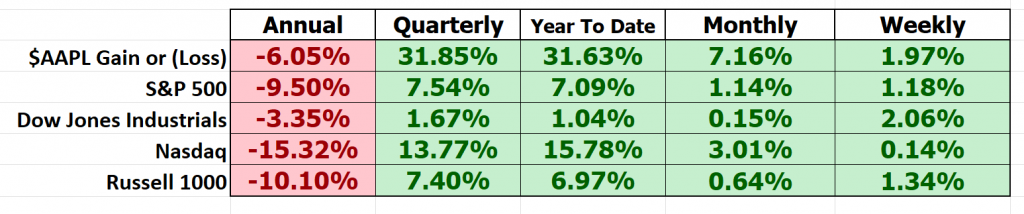
When comparing an individual stock’s performance to the broader stock market indexes, it is important to consider multiple time frames in order to gain a more comprehensive view of the stock’s performance. A stock may perform well in the short term, but if it is not keeping up with the overall market trend over a longer time frame, then it may not be a true leader in the market.
For example, a stock may have a strong performance in the last few weeks or months, but when compared to the overall trend of the market, it may have actually underperformed or only followed the market trend. Conversely, a stock may have a weak performance in the short term, but over a longer time frame, it may have consistently outperformed the market trend and be considered a market leader.
By comparing an individual stock’s performance on multiple time frames to the broader stock market indexes, traders can gain a better understanding of the stock’s relative strength and determine if it is a leader or a follower in the market. This information is crucial when making trading decisions, as it can help traders identify potential opportunities or avoid potential pitfalls.
An “alpha” stock is defined as a stock that has outperformed the market or a benchmark index, such as the S&P 500, over a certain period of time. Alpha measures the excess return of a stock or portfolio over its benchmark, adjusted for its level of risk. Essentially, it is a measure of a stock’s performance relative to the market or benchmark index. Therefore, an alpha stock is typically considered to be a stock that has demonstrated an ability to generate higher returns than the market or benchmark index, and is often sought after by investors looking to outperform the broader market. $AAPL has demonstrated that it is an alpha stock in every sense of the word.
In the stock market, the terms “growth stocks” and “value stocks” are used to differentiate between two different types of companies based on their characteristics and financial metrics.
Growth stocks refer to companies that are expected to grow at a faster rate than the overall market and have the potential for above-average earnings growth in the future. These companies typically reinvest their earnings into their businesses rather than paying out dividends to shareholders. They tend to have high price-to-earnings (P/E) ratios, which means that investors are willing to pay a premium for their growth potential.
On the other hand, value stocks are those that are believed to be undervalued by the market and have a lower price relative to their fundamentals, such as earnings or book value. These companies are often more established and have stable earnings, but they may not have the same growth potential as growth stocks. They tend to have low P/E ratios, which means that they are relatively cheap compared to their earnings.
When growth stocks outperform value stocks, it means that investors are more optimistic about the future prospects of high-growth companies than they are about established, undervalued companies. As this stock study is being published, traders and investors appear to be flocking back into GROWTH stocks after their poor performance in 2022.
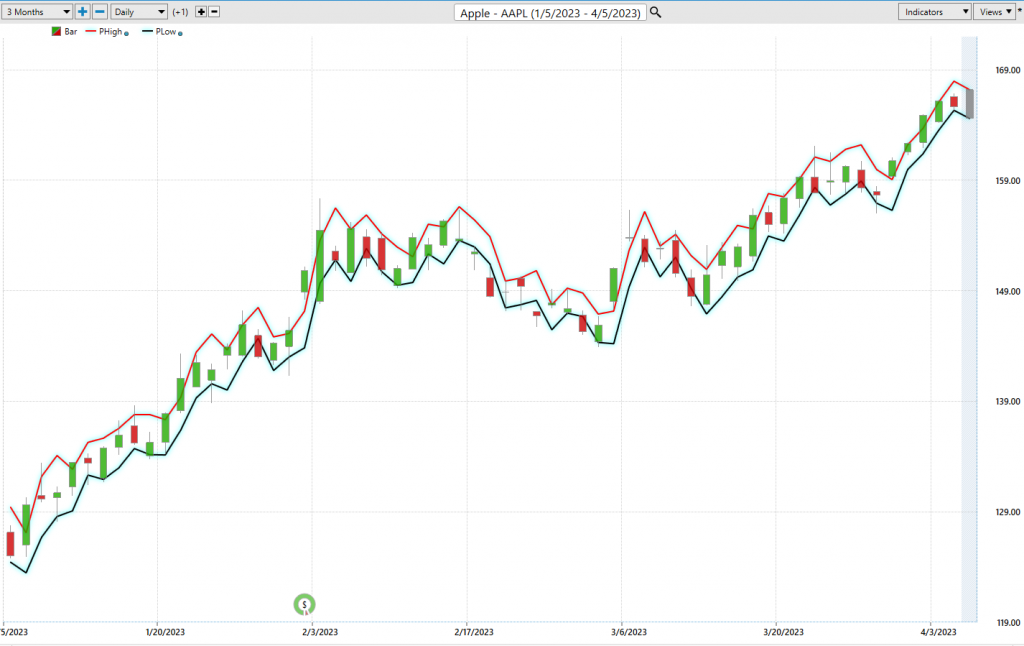
The Vantagepoint A.I. Analysis
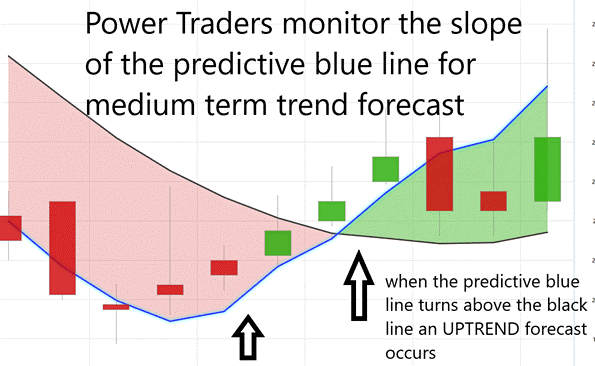
Traders using VantagePoint Software rely on artificial intelligence to identify trend forecasts by monitoring the slope of the predictive blue line. The black line represents a simple 10-day moving average of price, indicating past market performance. On the other hand, the predictive blue line acts as a value zone where traders aim to purchase the asset at or below it during uptrends.
When analyzing the chart, traders pay close attention to the relationship between the black and predictive blue lines. The predictive blue line is determined using Vantagepoint’s patented Neural Network and Intermarket Analysis, which considers the asset’s strongest price drivers and statistical correlations to determine its value.
A move of the predictive blue line above the black line presents an opportunity for an upward forecast entry, while a move below the black line presents a downward forecast. Traders can identify the trend and value zone at all times without guesswork.
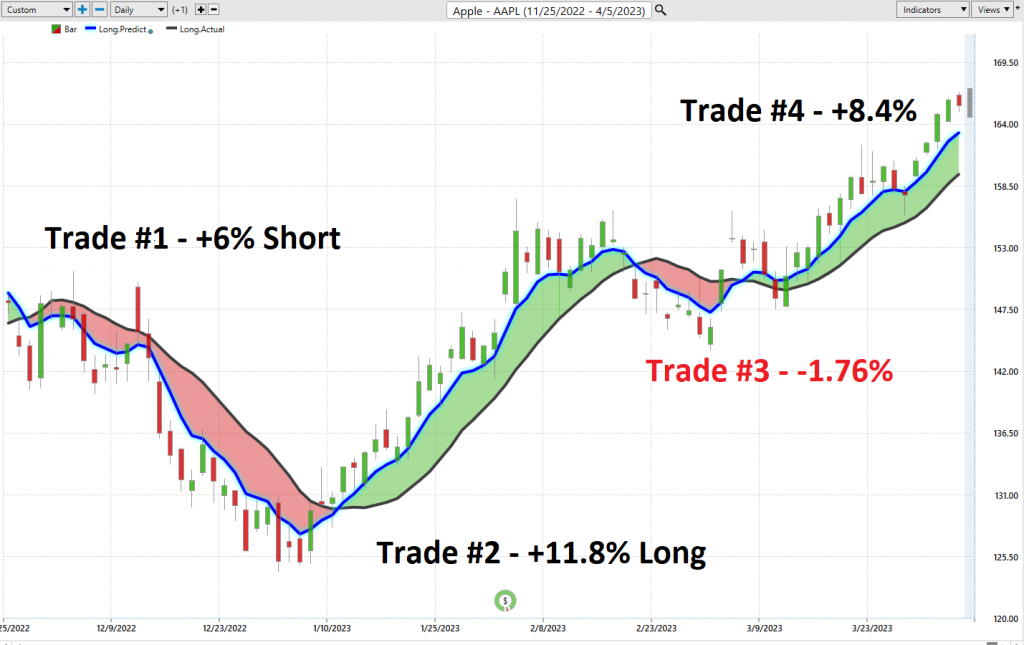
As short-term swing traders, loyalty lies with the trend, and not the popularity of a company like Apple, which is highly favored by Wall Street.
Fine Tuning Entries with The Neural Net Indicator
The Neural Network Indicator located at the bottom of the chart predicts the market’s future short-term strength or weakness. The color green indicates strength, while red predicts short-term weakness, and yellow anticipates sideways prices.
A Neural Network is an advanced computational learning system that utilizes a network of functions to process vast amounts of data and generate an output, constantly improving its performance. In trading, neural networks are a type of artificial intelligence system that learns patterns in financial markets and predicts future market behavior using algorithms.
Neural networks became popular in trading during the late 1980s and 1990s, following advancements in computer technology and algorithm sophistication. By identifying intricate patterns and relationships within large datasets, including historical price data, economic indicators, and other market factors, neural networks help traders find profitable trading opportunities.
Neural networks can be trained to predict future asset prices or market movements by assessing risk and potential reward, enabling them to make high-probability forecasts based on available historical information.
We suggest that Power Traders combine the chart with the predictive blue line and neural network indicator to create optimal entry and exit points. For serious traders, neural networks are a cutting-edge tool that can uncover subtle non-linear interdependencies and patterns that traditional technical analysis methods cannot detect.
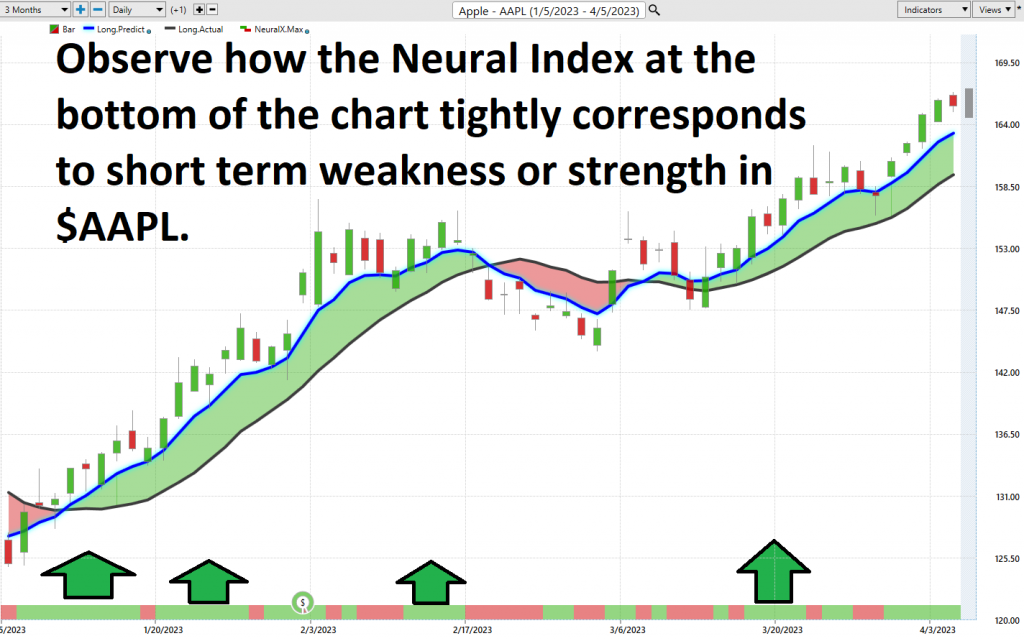
You can see in the chart above how the Neural Net offered several opportunities of double confirmation to Power Traders, when the predictive blue line and the Neural Net aligned with the same forecast. These instances provide extremely high probability trading opportunities to exploit the trend.
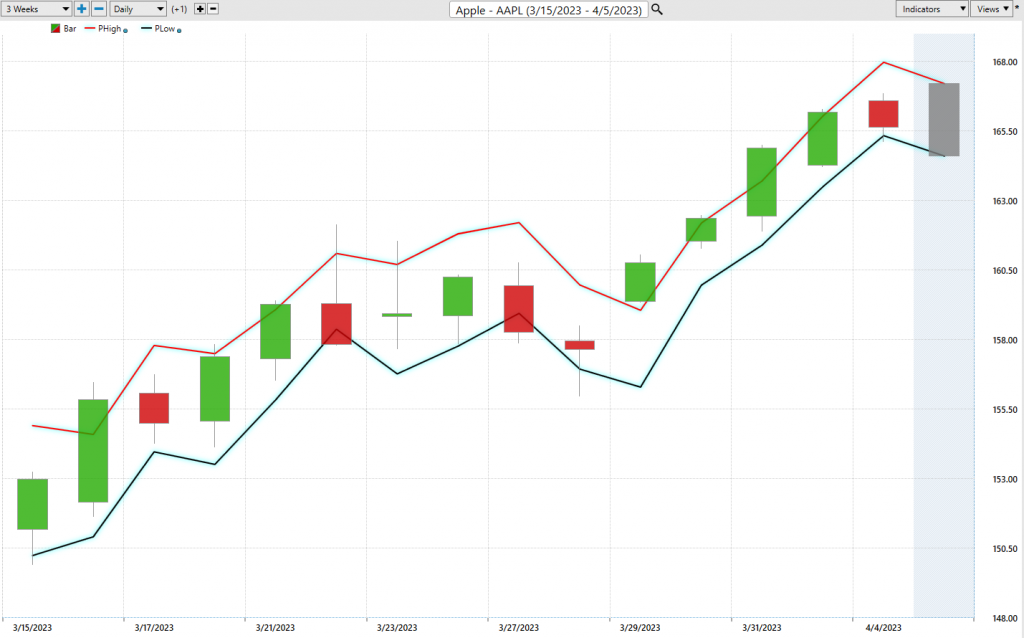
VantagePoint Software Daily Price Range Prediction
Here are the trading metrics for $AAPL stock over the past year on a daily, weekly, and monthly basis. These percentages are calculated as a percentage of the closing price.
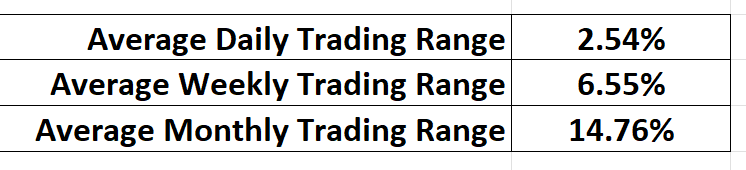
In trading, statistics play a vital role in providing insight into past market trends. However, traders must convert this knowledge into actionable decisions to be successful. Among the key concepts that influence trading decisions are volatility, opportunity, and risk. Volatility measures the degree of price fluctuation over a specific period and reflects the degree of uncertainty in an asset’s value. While volatility can generate significant profits, it also entails greater risks, as price fluctuations can lead to losses. Therefore, traders must establish a sound risk management strategy to balance the benefits of volatility with its risks. This strategy may include setting stop-loss orders, diversifying portfolios, and assessing risk tolerance regularly. With the Vantagepoint A.I. daily range forecast, traders can optimize their market entries and exits, as it provides a clear channel of trading activity and helps in determining stop placement. By identifying buying opportunities towards the bottom of the predicted channel and selling opportunities above the top band, traders can maximize their returns while minimizing risks.
Here is the price chart of $AAPL during the most recent runup and drawdown featuring the Daily Price Range forecast and the Neural Net Indicator. Power Traders had numerous opportunities to short term swing trade the trend by simply looking to purchase near the bottom of the predicted range and selling towards the top of the predictive range.
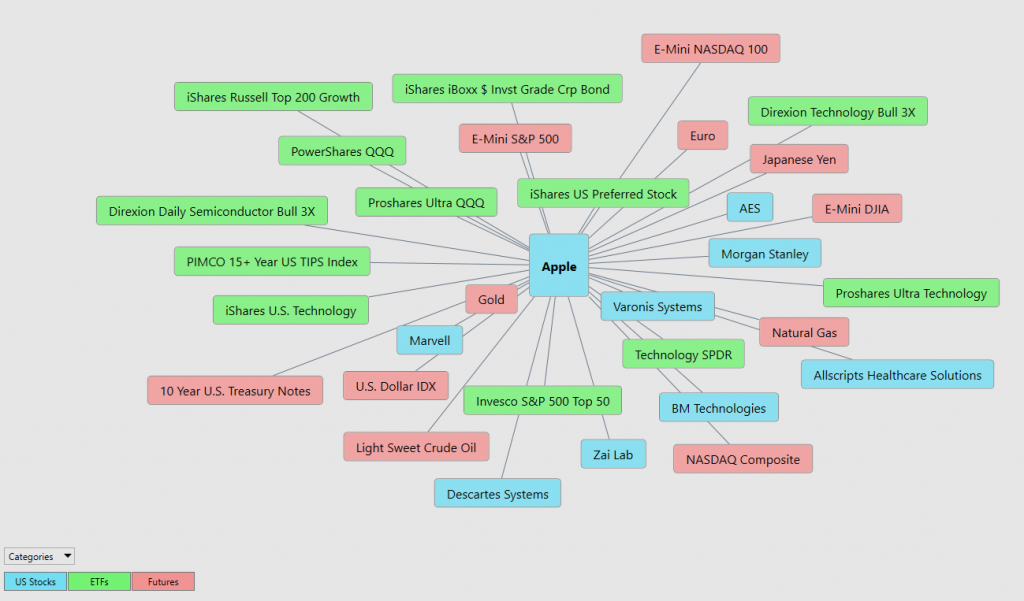
Intermarket Analysis
The Vantagepoint Software distinguishes itself by its ability to perform Intermarket analysis, identifying the assets that are most statistically interconnected and drive price movements. While studying charts can help locate support and resistance levels, the global marketplace operates on interconnectivity, with thousands of variables affecting the decisions companies make to survive. Identifying the key drivers of an asset’s price is a challenge facing traders and investors. Intermarket analysis involves examining correlations and relationships between different financial markets to detect opportunities and understand how different asset classes interact with and influence each other. Traders can identify emerging trends, potential opportunities, and risks by analyzing intermarket relationships. The 31 markets in the Intermarket Analysis graphic are the key drivers of $AAPL’s price and understanding these relationships can provide valuable insights for traders. By relying on facts and data, traders can make better-informed decisions and improve their overall trading performance.
This can be invaluable information because it allows a trader to locate other opportunities and see a listing of the ETF’s that are also buyers of $AAPL. This knowledge is how other trading opportunities are often uncovered in their embryonic stages.
Suggestion
AAPL’s next earnings call is May 4, 2023.
Its Worldwide Developer Conference is on June 6th, 2023. Both events will be key drivers of price moving forward.
What concerns us the most is that Mac sales have decreased by 22%, and PC brands are faring even worse. This information is cause for concern for both the computer industry and consumers alike.
The decline in Mac sales could be attributed to a variety of factors, including the rise of mobile devices such as smartphones and tablets, as well as the increasing popularity of cloud-based computing. In addition, Apple’s high prices may also be turning some consumers away.
The rise of alternative computing platforms such as Chromebooks and the increasing use of mobile devices for basic computing needs have both contributed to this trend.
Overall, this data suggests that the computer industry is undergoing a significant shift, and that traditional desktop and laptop computers may be losing ground to newer, more mobile computing solutions.
The daily range forecast has been an exceptional guide for traders over the last few months and we will continue to focus on it for short term swing trading opportunities.
Our advice: Follow the a.i. trend analysis and practice good money management on all your trades.
We will re-evaluate this analysis based upon:
- Wall Street Analysts’ Estimates
- 52-week high and low boundaries
- Vantagepoint A.I. Forecast (Predictive Blue Line)
- Neural Network Forecast
- Daily Range Forecast
- Intermarket Analysis
Let’s Be Careful Out There!
Remember, It’s Not Magic.
It’s Machine Learning.

IMPORTANT NOTICE!
THERE IS SUBSTANTIAL RISK OF LOSS ASSOCIATED WITH TRADING. ONLY RISK CAPITAL SHOULD BE USED TO TRADE. TRADING STOCKS, FUTURES, OPTIONS, FOREX, AND ETFs IS NOT SUITABLE FOR EVERYONE.
DISCLAIMER: STOCKS, FUTURES, OPTIONS, ETFs AND CURRENCY TRADING ALL HAVE LARGE POTENTIAL REWARDS, BUT THEY ALSO HAVE LARGE POTENTIAL RISK. YOU MUST BE AWARE OF THE RISKS AND BE WILLING TO ACCEPT THEM IN ORDER TO INVEST IN THESE MARKETS. DON’T TRADE WITH MONEY YOU CAN’T AFFORD TO LOSE. THIS ARTICLE AND WEBSITE IS NEITHER A SOLICITATION NOR AN OFFER TO BUY/SELL FUTURES, OPTIONS, STOCKS, OR CURRENCIES. NO REPRESENTATION IS BEING MADE THAT ANY ACCOUNT WILL OR IS LIKELY TO ACHIEVE PROFITS OR LOSSES SIMILAR TO THOSE DISCUSSED ON THIS ARTICLE OR WEBSITE. THE PAST PERFORMANCE OF ANY TRADING SYSTEM OR METHODOLOGY IS NOT NECESSARILY INDICATIVE OF FUTURE RESULTS. CFTC RULE 4.41 – HYPOTHETICAL OR SIMULATED PERFORMANCE RESULTS HAVE CERTAIN LIMITATIONS. UNLIKE AN ACTUAL PERFORMANCE RECORD, SIMULATED RESULTS DO NOT REPRESENT ACTUAL TRADING. ALSO, SINCE THE TRADES HAVE NOT BEEN EXECUTED, THE RESULTS MAY HAVE UNDER-OR-OVER COMPENSATED FOR THE IMPACT, IF ANY, OF CERTAIN MARKET FACTORS, SUCH AS LACK OF LIQUIDITY. SIMULATED TRADING PROGRAMS IN GENERAL ARE ALSO SUBJECT TO THE FACT THAT THEY ARE DESIGNED WITH THE BENEFIT OF HINDSIGHT. NO REPRESENTATION IS BEING MADE THAT ANY ACCOUNT WILL OR IS LIKELY TO ACHIEVE PROFIT OR LOSSES SIMILAR TO THOSE SHOWN.

