
Square, a financial services and digital payments company co-founded by now-former Twitter CEO Jack Dorsey. The company provides credit card payment processing solutions. The company’s commerce ecosystem offers point-of-sale software and hardware that helps sellers with payment and point-of-sale solutions. On December 1, 2021, Square announced that it would be changing its name to BLOCK.
The company recently took a majority stake in the music streaming service called Tidal. It also is the owner of CashApp a popular alternative to Paypal and Venmo. Under Dorsey’s leadership, Square had reached a $100 billion market cap. He accomplished this feat while simultaneously also leading Twitter.
What excites investors and traders about Square is that as a payments processing company it is only available in seven countries. This means it has not entered most of the developed world and those other 200+ countries served by its main competitor Paypal.
Block has also become a champion of cryptocurrency, specifically bitcoin. Many analysts on Wall Street feel that the name change to “BLOCK” indicates that the company sees huge opportunity in blockchain technology.
Over the past five years, BLOCK ($SQ) had rewarded long-term investors with over 1580% gains. However, since its high price in early August the stock has slid more than 53%. Since its birth, Square had been a fiat-first company. The name change to BLOCK implies that the company will place a huge focus on bringing bitcoin to the masses. With Dorsey not full-time as CEO of the company Wall Street is looking for reasons to love the stock again.
Equally impressive is that Block ($SQ) purchased Afterpay a leader in the buy now pay later space for $29 billion in an all-stock transaction. As of June 30, Afterpay served more than 16 million customers and roughly 100,000 merchants. The acquisition clearly communicates of Block’s ($SQ) intention to be a leader in the digital payments space.
Block’s fortunes at the present seem to be very heavily correlated crypto and the blockchain. That could be a very shrewd long-term bet for the fintech giant, but the volatility of crypto is not easy for the traditional shareholder to stomach.
Block also recently launched direct business lending to their small business clients. They have the financial analytics to comprehend risk factors associated with financial activity across their platform. Given all these new revenue verticals, Block offers great upside potential at a very reduced valuation if you can get the timing correct.
In this weekly stock study, we will look at and analyze the following indicators and metrics which are our guidelines which dictate our behavior in deciding whether to buy, sell, or stand aside on a particular stock.
- Wall Street Analysts’ Estimates
- 52-week high and low boundaries
- Vantagepoint A.I. Forecast (Predictive Blue Line)
- The Best Case – Worst Case Scenarios
- Neural Network Forecast
- Daily Range Forecast
- Intermarket Analysis
- Our trading suggestion
We don’t base our trading decisions on things like earnings or fundamental cash flow valuations. However, we do look at them to better understand the financial landscape that a company is operating under.
Before we start this analysis on $SQ I want to mention what traders look for is motion. The greater the motion the greater the opportunities for profit. The old adage on Wall Street is to buy low and sell high. Everyone thinks they understand this simple phrase because when you buy something you own it and then you can sell it afterwards. However, if you reverse that phrase, you come up with Sell High and Buy Low. This is the arena of the more sophisticated trader. They Borrow the stock at current prices, thereby selling it and agree to buy it back at some point in the future. This is also referred to as selling short. Short selling on Wall Street is discouraged my many brokerages but it is a completely valid and legitimate form of trading.
Let me provide a simple example that simplifies the example further. Let’s say you know that I want to buy a Lexus SUV for $20,000. You agree to sell me the SUV, but you currently do not have a LEXUS SUV is stock. If you can find a LEXUS SUV for less than $20,000 you will earn a profit on the transaction. If you find a Lexus SUV for more than $20,000 you will have a corresponding loss.
This identical process is also true for stocks.
I mention this at the outset of this stock study because you will quickly notice that $SQ has been in a downtrend for 4 ½ months. Buyers have been crucified over this time frame. But short sellers have done exceptionally well. My point is that in the financial markets you can change your mindset and learn to sell high and buy low and this action will open up hundreds of opportunities in falling markets.

Wall Street Analysts’ Estimates
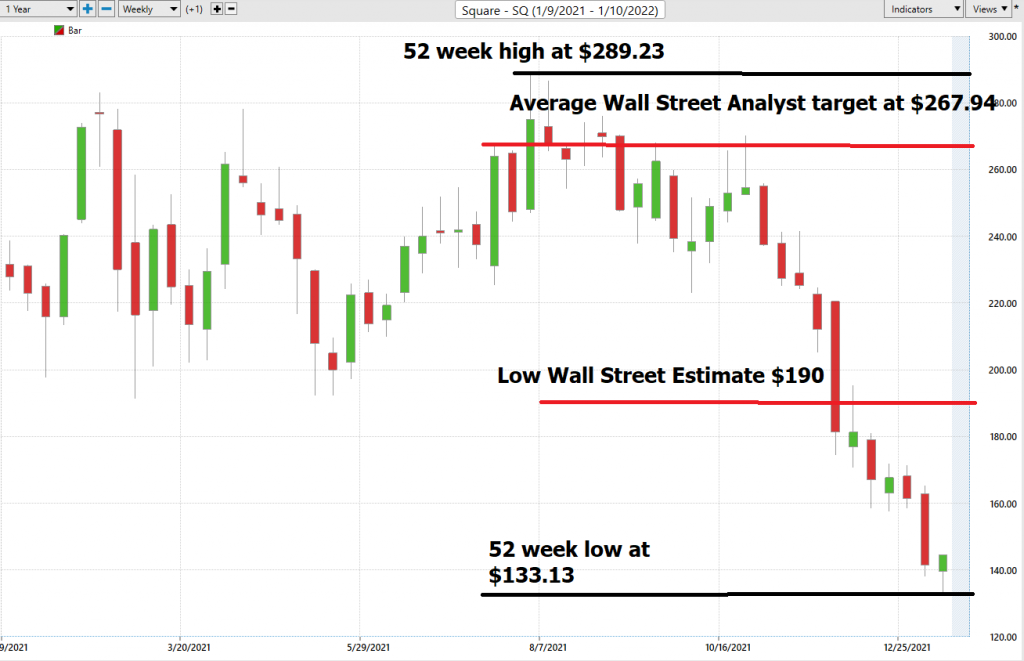
Based on 17 Best Performing Wall Street analysts offering 12-month price targets for Block in the last 3 months. The average price target is $267.94 with a high forecast of $330.00 and a low forecast of $190.00. The average price target represents a 79.27% positive change from the last price of $149.46.
Because of the recent huge slide in $SQ the top analysts on Wall Street see that the company is currently undervalued. Power traders love seeing this type of opportunity for a stock as it signals that $SQ is out of favor.
52-Week High and Low Boundaries
Over the past year we have seen $SQ trade as low as $133.13 and as high as $289.23. This tells us that the average weekly trading range for $SQ is $3.00
We also like to divide the current price by the annual trading range to get a broad-based estimate of trading volatility. When we divide $156.10 the annual range by the current price of $148.63, we come up with 105%. This tells us that the volatility of $SQ over the past year has been 105%. This value is much larger than other large cap stocks and shows us that BLOCK is an extremely volatile asset.
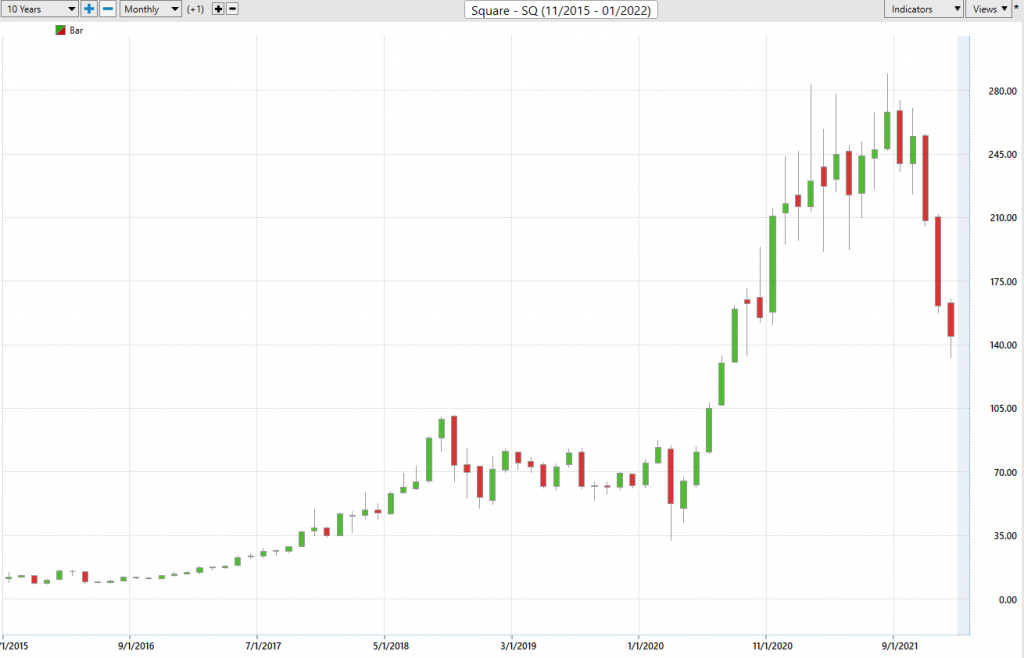
Here is a ten year monthly chart of $SQ so that you can see the powerful price journey it has taken over the longer term time frames.
We then like to get more granular to analyze and look at how the stock has performed around the major analysts forecasts as well as the 52-week high and low boundaries.
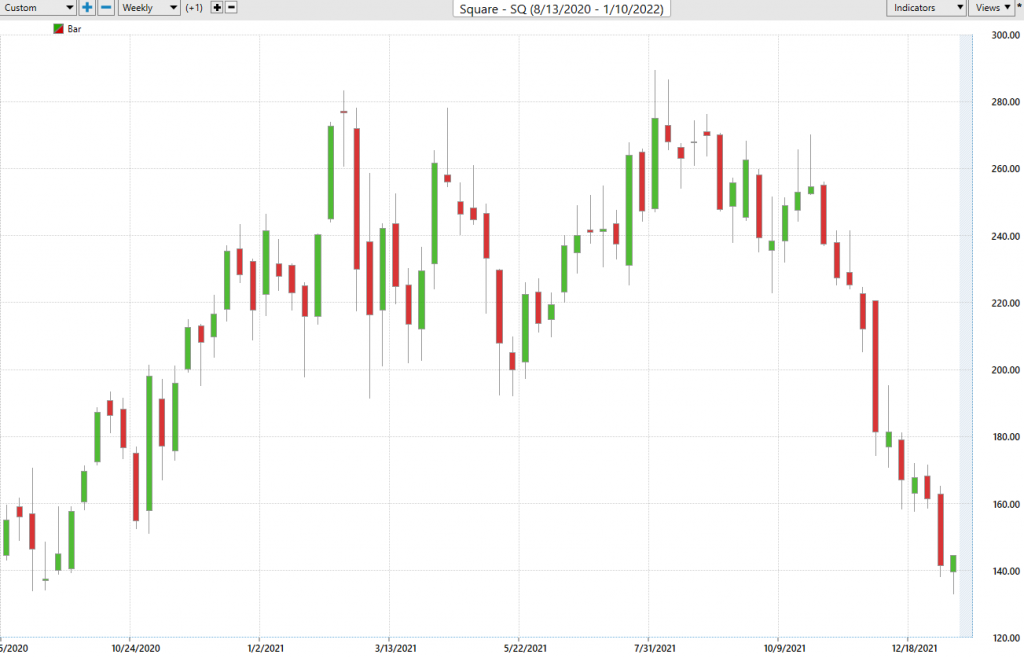
Below is a 52-week chart of $SQ that illustrates exactly why it is important to pay attention to the 52-week high and low boundaries. I have included the low Wall Street Analyst estimate as well as the average.
What makes $SQ to be very tempting is that Wall Street says it is very much undervalued. However, we are trend traders, and the trend is clearly down. We will not step in and try to catch a falling knife. When we see proof that a bottom is in, and the artificial intelligence is signaling an uptrend has formed we want to have this on our radar as the snap back will most likely be fast and furious.
We like to study the 52-week chart just so that we can get a feel for how the company has performed over the past year and compare that to other opportunities and the broader market indexes.
Best Case – Worst Case Scenario $SQ
Whenever we look at a trade or long-term investment opportunity to really understand what we are dealing with we need to compare the performance of the asset we are considering with the returns of the major market indexes.
But we also want to get an idea of the best case and worst-case scenarios have been in the asset.
Over the past year $SQ is down -35.84%. This is quite surprising since through the second quarter it had been a Wall Street darling.
The S&P 500 Index is up 23.57%
The Dow Jones Industrials are UP 16.57%
The NASDAQ is UP 36.17%
The Russell 1000 Small Cap Index is UP 21.03%
So, we can see that in $SQ we have an asset that has massively underperformed all the broader stock market indexes.
More importantly the drawdowns have been quite large as well. The largest drawdowns were 53.4% peak to trough. This occurred from August 2020 to present time.
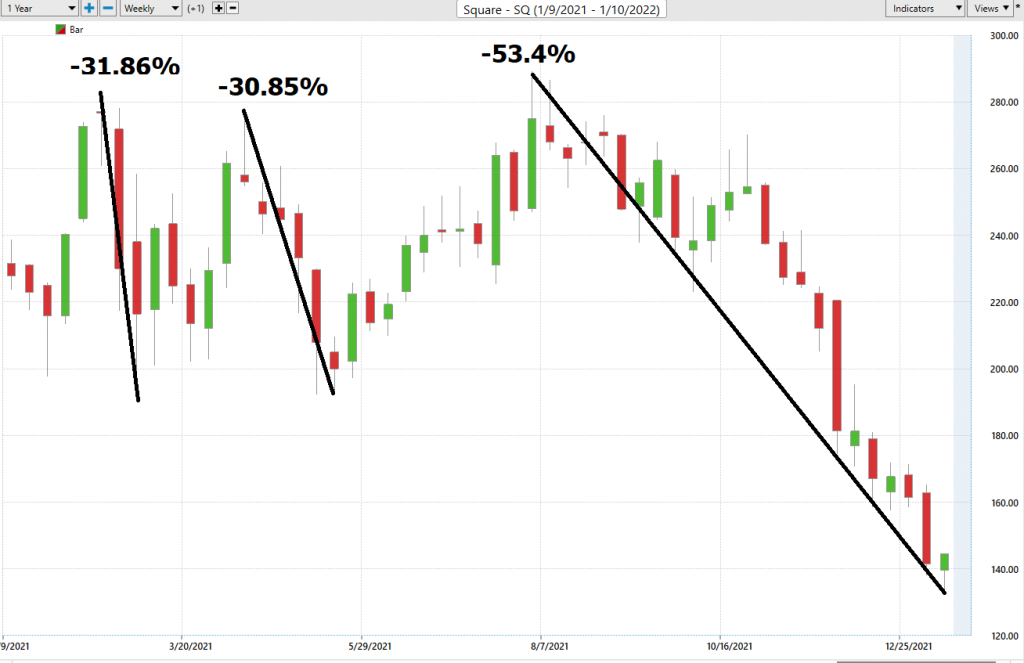
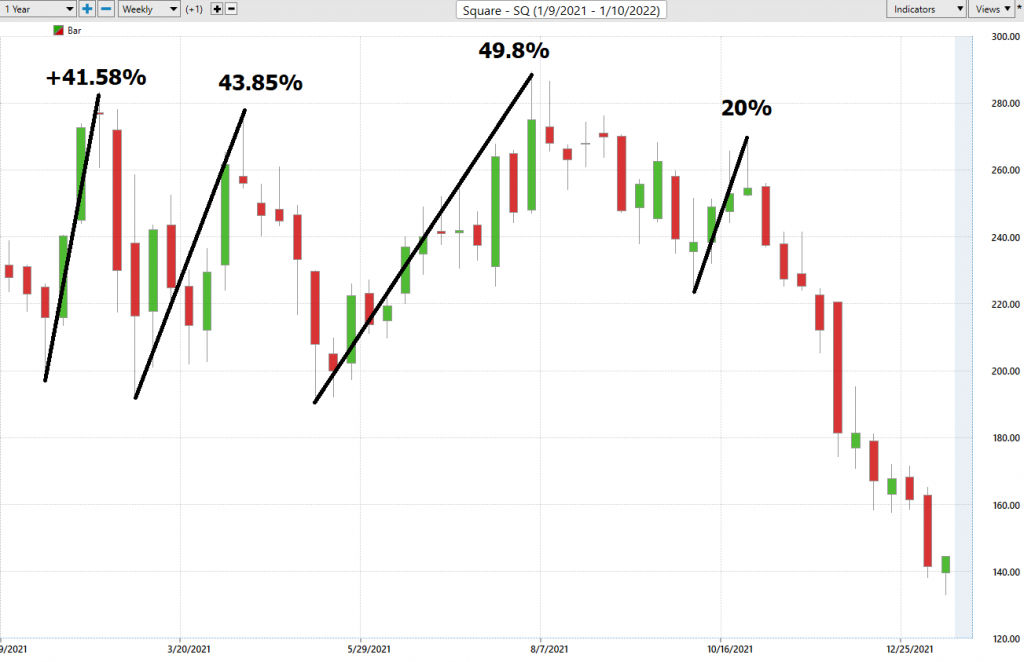
The best-case scenario is mild in comparison and shows that while $SQ had some rallies throughout the year it certainly had trouble holding on to those gains. The stock has had 4 sharp rallies with the largest consisting of a 49.8% gain trough to peak.
One lesson I’d like to share with you is that patience is very much a skill to be learned when you are looking at a stock like Block ($SQ). The stock just made a new 52-week low. While that sounds cheap, what experienced traders do is wait for the market to prove itself that a low is in.
It is not uncommon for a stock that has just made a new 52-week low to continue falling lower. During these times it is customary for traders to become value investors. They think fondly of how much money they will make when this asset returns to its 52-week highs. My point is that as a trader your only loyalty should be to the trend. Otherwise, you are asking for trouble. At present time the trend is DOWN.
Vantagepoint A.I. Forecast (Predictive Blue Line)
Let’s do some basic trend forecasting analysis based upon looking at the VantagePoint predictive blue line over the last year. On the following chart you will see the power of the VantagePoint Predictive blue line which determines the medium term trend price forecast.
The guidelines we abide by are as follows:
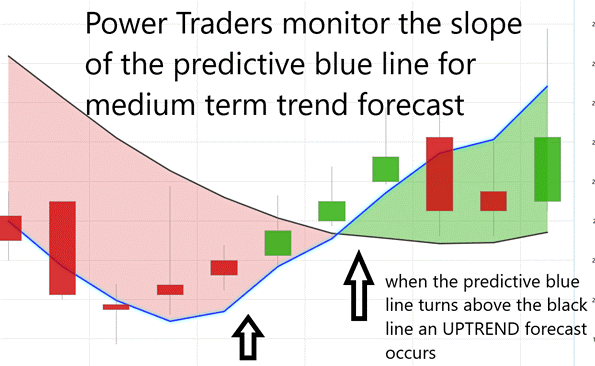
- The slope of the predictive blue line determines the trend and general direction of $SQ
- When the blue line turns above the black line an UP opportunity occurs
- When the blue line turns below the black line a DOWN opportunity occurs
- Ideally, the VALUE ZONE is determined to try and buy the asset at or below the predictive blue line
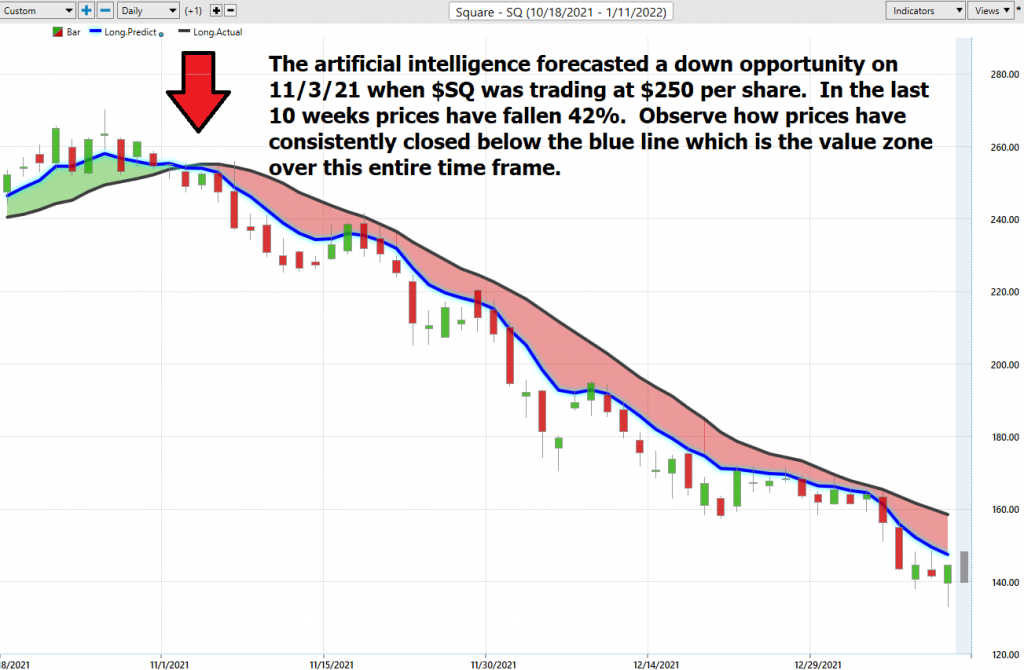
Instead of asking “when should I buy,” great traders recognize that the trend is DOWN. Patience is a skill that needs to be acquired and respected.
This is the power and effectiveness of the Vantagepoint A.I. forecast in assisting traders to stay on the right side of the trend at the right time.
Neural Network Indicator (Machine Learning)
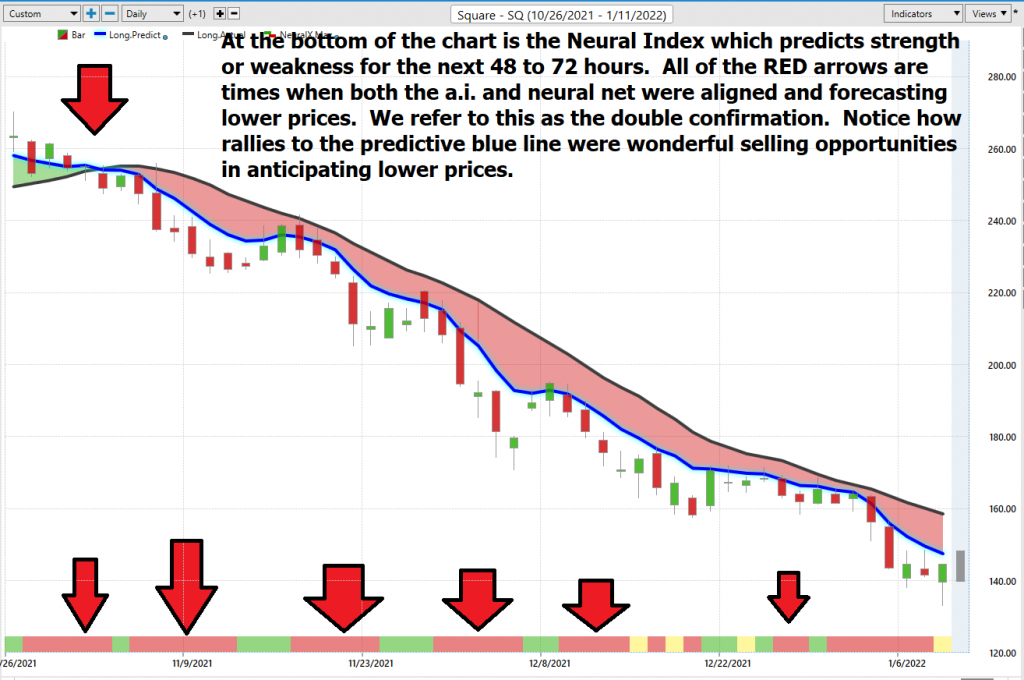
At the bottom of the chart is the Neural Network Indicator which predicts future short-term strength and/or weakness in the market. When the Neural Net Indicator is green it communicates strength. When the Neural Net is red it is forecasting short term weakness in the market.
A Neural Net is a computational learning system that uses a network of functions to understand and translate massive amounts of data into a desired output, consistently monitoring itself and improving its performance.
Whenever Power Traders are looking for statistically valid trading setups, they look for a DOUBLE confirmation signal. This signal occurs whenever the blue predictive line and the Neural Net at the bottom of the chart suggest the same future expected outcome.
We advocate that Power Traders cross reference the chart with the predictive blue line and neural network indicator to create optimal entry and exit points.
Traders look for confirmation on the Neural Net to position themselves for LONG or SHORT opportunities in the market. In other words, when the A.I. forecast is green, and The Neural Net is green, that presents a buying opportunity.
The inverse is also true, when the A.I. forecast is red and the Neural Net is red, that is a selling opportunity. The arrows on the chart below highlight the trading zones where Power Traders would’ve been using double confirmation to find a buying opportunity in cross referencing the A.I. forecast with the Neural Net.
Power Traders are always looking to apply both the Neural Network and A.I. to the markets to find statistically sound trading opportunities.
All of the RED arrows are times when both the a.i. and neural net were aligned and forecasting lower prices. We refer to this as the double confirmation. Notice how rallies to the predictive blue line were wonderful selling opportunities in anticipating lower prices.
VantagePoint Software Daily Price Range Prediction
One of the powerful features in the VantagePoint Software which Power Traders use daily is the Price Range prediction forecast.
This forecast is what permits Power Traders to truly fine tune their entries and exits into the market.
Every day traders are faced with the anxiety and frustration of wondering where they should be looking for opportunities to buy and sell the market. VantagePoint’s A.I. makes this decision super easy with the Daily Price Range Forecast. This is where the rubber meets the road, so to speak.
Here is the price chart of $SQ during the most recent downtrend.
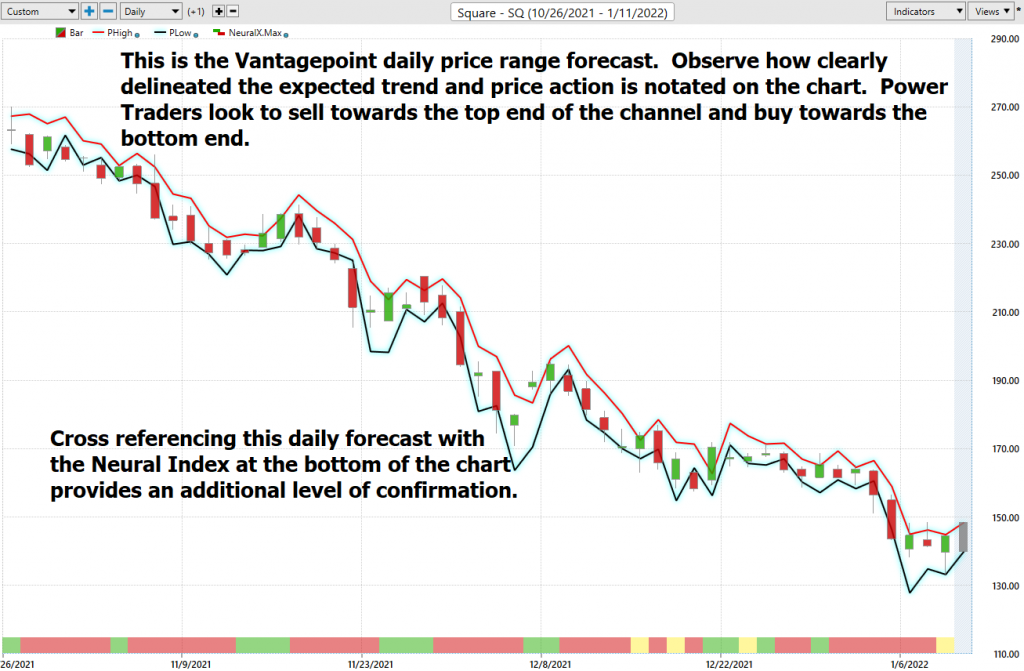
This chart helps traders decide where stop placement should occur. Observe how placing protective sell stops below the dark line on the chart was a powerful way to minimize risk on this trade.
See how the upper and lower bands of the price range forecast for a very clear channel of trading activity as well. Swing traders are always looking for opportunities to buy towards the bottom of the predicted channel and selling opportunities above the top band.
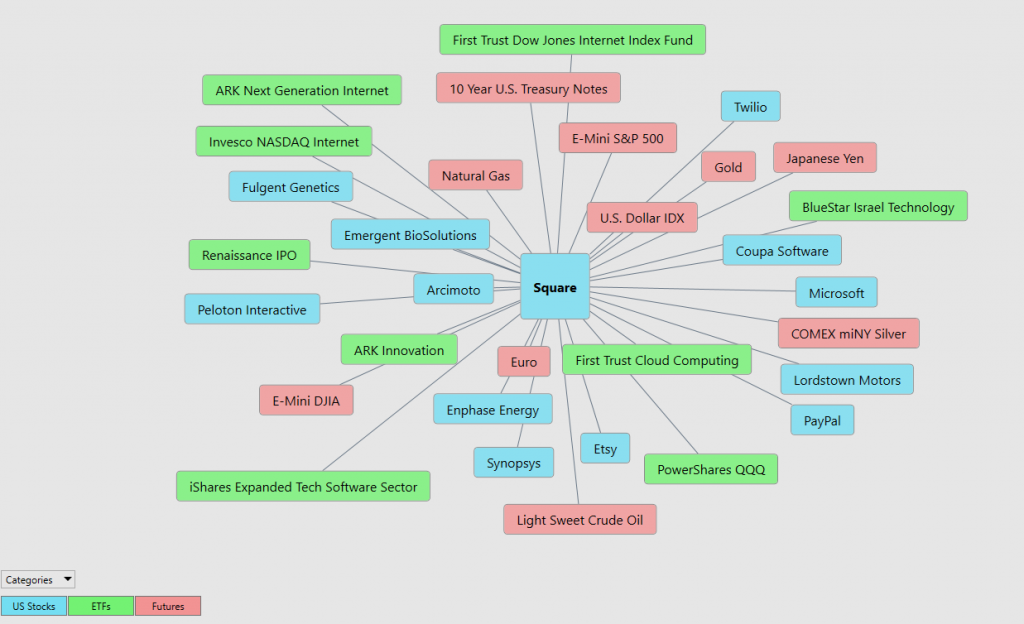
Intermarket Analysis
Power lies in the way we respond to the truth we understand.
One of the supremely important questions in trading is what is driving the price? Headlines often create interesting narratives. But these “stories” only capture the imagination. Traders want and need to understand the cause and effect of price movement.
The only way to get an answer to this important question is through intermarket analysis which looks at statistical price correlations of assets.
Intermarket analysis is a method of analyzing markets by examining the correlations between different asset classes. In other words, what happens in one market affects other markets. So a study of the relationship(s) will prove to be beneficial to a trader.
We live in a global marketplace.
Everything is interconnected.
Interest rates, Crude Oil Prices, and the volatility of the Dollar amongst thousands of other variables affect the decisions companies must make to flourish and prosper in these very challenging times. Trying to determine what these factors are is one of the huge problems facing investors and traders.
You always have a choice. You can tune in to the talking heads in the media who spin talking points which promote fear. Or you can rely on facts to base your decision making on.
Within the following Intermarket Analysis graphic, you will see the 31 markets that are the key drivers to SQ’s price.
Our Suggestion
Currently, $SQ is trading near its 17-month low.
This is very attractive to value investors who are interested in long term plays in a stock.
Our only loyalty is to the trend and currently the trend is DOWN.
However, that being said, we do think that you need to put this stock on your trading radar and watch it closely. We suspect that when the reversal occurs it will be fast and furious and $SQ will move very quickly to the upside.
What makes the possibility of a quick rebound in price is that the top Wall Street analysts who look at fundamental metrics think that the lowest 12-month target on $SQ is $190. By their measuring yardstick that means that $SQ is 28% undervalued by their worst-case scenario.
Some things to look for:
- On the weekly chart a GREEN candle that closes above the previous weeks high.
- A consolidating channel that trades sideways for some time until a breakout from that zone occurs.
While we do not think there is much more downside in $SQ, the trend is DOWN, and it needs to be respected as sellers have pushed prices down over 55% in the last 5 months.
The old adage on Wall Street is that “top pickers and bottom pickers become cotton pickers. Instead of asking “when to buy,” learn to respect the trend and practice patience.
$SQ has had impressive earnings growth over the past few years and that will be the key driver moving forward. Their next earnings report date is scheduled for March 1, 2022.
The company has a powerful business model and is clearly playing to be a leader in the digital payments space. Since they are currently only in 7 countries the growth potential long term is explosive to say the least.
PUT $SQ on your radar and allow the a.i. to guide your trading decisions.
Practice solid money management on all your trades.
We will re-evaluate based upon:
- New Wall Street Analysts’ Estimates
- New 52-week high and low boundaries
- Vantagepoint A.I. Forecast (Predictive Blue Line)
- Neural Network Forecast
- Daily Range Forecast
Let’s Be Careful Out There!
Remember, It’s Not Magic.
It’s Machine Learning.

IMPORTANT NOTICE!
THERE IS SUBSTANTIAL RISK OF LOSS ASSOCIATED WITH TRADING. ONLY RISK CAPITAL SHOULD BE USED TO TRADE. TRADING STOCKS, FUTURES, OPTIONS, FOREX, AND ETFs IS NOT SUITABLE FOR EVERYONE.
DISCLAIMER: STOCKS, FUTURES, OPTIONS, ETFs AND CURRENCY TRADING ALL HAVE LARGE POTENTIAL REWARDS, BUT THEY ALSO HAVE LARGE POTENTIAL RISK. YOU MUST BE AWARE OF THE RISKS AND BE WILLING TO ACCEPT THEM IN ORDER TO INVEST IN THESE MARKETS. DON’T TRADE WITH MONEY YOU CAN’T AFFORD TO LOSE. THIS ARTICLE AND WEBSITE IS NEITHER A SOLICITATION NOR AN OFFER TO BUY/SELL FUTURES, OPTIONS, STOCKS, OR CURRENCIES. NO REPRESENTATION IS BEING MADE THAT ANY ACCOUNT WILL OR IS LIKELY TO ACHIEVE PROFITS OR LOSSES SIMILAR TO THOSE DISCUSSED ON THIS ARTICLE OR WEBSITE. THE PAST PERFORMANCE OF ANY TRADING SYSTEM OR METHODOLOGY IS NOT NECESSARILY INDICATIVE OF FUTURE RESULTS. CFTC RULE 4.41 – HYPOTHETICAL OR SIMULATED PERFORMANCE RESULTS HAVE CERTAIN LIMITATIONS. UNLIKE AN ACTUAL PERFORMANCE RECORD, SIMULATED RESULTS DO NOT REPRESENT ACTUAL TRADING. ALSO, SINCE THE TRADES HAVE NOT BEEN EXECUTED, THE RESULTS MAY HAVE UNDER-OR-OVER COMPENSATED FOR THE IMPACT, IF ANY, OF CERTAIN MARKET FACTORS, SUCH AS LACK OF LIQUIDITY. SIMULATED TRADING PROGRAMS IN GENERAL ARE ALSO SUBJECT TO THE FACT THAT THEY ARE DESIGNED WITH THE BENEFIT OF HINDSIGHT. NO REPRESENTATION IS BEING MADE THAT ANY ACCOUNT WILL OR IS LIKELY TO ACHIEVE PROFIT OR LOSSES SIMILAR TO THOSE SHOWN.

