
I’ve been thinking a lot about the Federal Reserve lately. Quite frankly I’ve given up trying to understand them. They seem like they have cornered themselves between a rock and a hard place and any move they make is going to hurt really bad.
Over the last week, I’ve started watching the internals of the broader market. Essentially, I’m looking at how many stocks on the NYSE and NASDAQ are making new 52-week highs versus how many stocks are making 52-week lows. Over the last month, I’ve watched as 2 to 3 times as many companies are making new 52-week lows versus companies that are making new 52-week highs. What this means is that most stocks are going down in price. It’s a different headline than what you read about in the media.
The last time I recall seeing this type of weakness in the market internals was right before the dotcom bubble burst in March 2000. That decline occurred immediately after Fed Chairman Alan Greenspan raised interest rates. Many stocks in the tech sector dropped 80%.
I’m not saying that will happen now. But when we look at the Fed and their recent announcements, things are looking very similar to that time frame. We have the most fundamentally overvalued stock market bubble in history, and it looks like the Fed by raising interest rates is in a similar position as Chairman Greenspan was in March 2000.
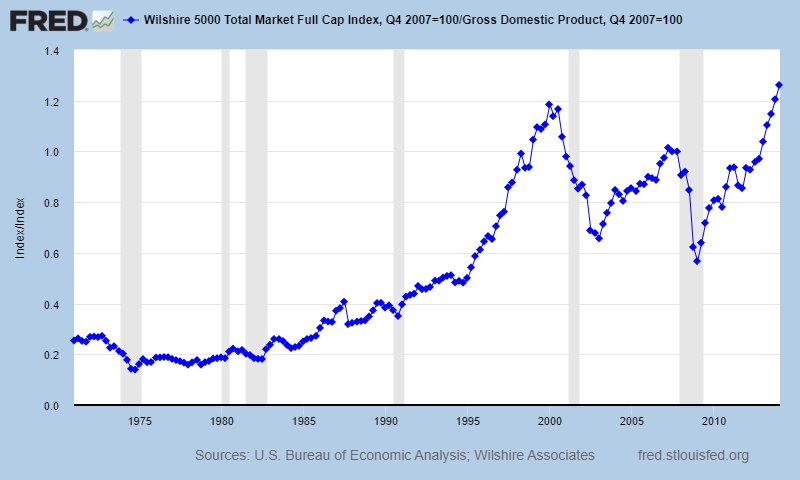
Here is the most current chart of the Warren Buffett Indicator which is simply the market cap of all stocks divided by the Gross Domestic Product in the country. This ratio is charted by The Federal Reserve and is used to determine whether an overall market is undervalued or overvalued compared to a historical average. When the valuation ratio is between 50% and 75%, the market can be said to be modestly undervalued. The market is said to be fair valued if the ratio falls between 75% and 90%, and modestly overvalued if it falls within the range of 90 and 115%. It’s latest reading is 126% which is the highest in its history.
One of the big challenges with trying to make sense of the Fed is understanding their history and not just focusing on the current headlines. Deep down. I want to believe that they have a solution for what ails the economy. Unfortunately, I can’t help but be skeptical.
For most of 2021, the Fed was promising they wouldn’t raise interest rates until at least 2023, with most Fed Governors pointing to 2024 as a more realistic time frame for their penciled-in rate hikes. Fed Chair Jerome Powell famously and reassuringly stated in one of his pressers, “We’re not thinking about raising rates, we’re not even thinking about thinking about raising rates.”
Wall Street interpreted that as cheap money will be here for the next two years, inflation is under control, and financial assets rallied sharply.
Last week, the Federal Open Market Committee released its minutes from their December meeting. The Fed announced that it is planning to end its $120 billion a month in bond purchases by March 2022 and then they will begin raising interest rates. This is the most hawkish statement we have heard from the Fed since the Great Financial Crisis.
In recent weeks, the market has come to learn that the Fed is considering not just 3, or even 4, but 5 or more rate hikes and significant balance sheet liquidation – all in 2022.
The problem I have when I read between the lines of the Feds statement, I can’t help but feel that they are bluffing. I think the Fed needs to raise interest rates. I also think the Fed should not be buying $120 billion a month in U. S Treasury Bonds. The problem, as I see it, is that Wall Street is completely addicted to the Feds money and over the last 14 years the Fed has threatened numerous times that they were going to stop, but they always relented at the very first sign of a severe market correction.
At the start of the Great Financial Crisis in 2008, President Bush signed the Emergency Economic Stabilization Act into law which allowed the Treasury to pump $700 billion into the banking system to kickstart the “Too Big to Fail” stimulus which we have been living under for the last 14 years.
If you do a little simple arithmetic and divide $700 billion by 12 months you end up with a comparable monthly value of roughly $58.3 billion in Fed stimulus per month. That was a gigantic bailout in 2008. The narrative was that this “one time” action would save the economy and save millions of jobs and bankruptcies.
So, here’s where the rubber meets the road for me. Below is a chart of the Federal Reserve Balance sheet going back to the Great Financial Crisis in 2008. In August 2008 the Feds balance sheet stood at 898$ billion dollars. That is the entire amount of debt the Fed had purchased in its then, 95-year history. In the last 13 years the Fed has increased their balance sheet to just under $9 trillion. That is a staggering 775% exponential growth. During the entirety of the last 13 years, they have been buying a minimum of $50 billion a month of credit instruments to support the economy.
So, the Fed has averaged Treasury purchases of $50 billion per month for 14 years. They are still purchasing $120 billion a month, and now they are going to stop completely and go cold turkey? That is what is called a fiscal and monetary cliff.
Over the last two years the Fed has added over $2.8 trillion in Treasuries to their balance sheet to support the economy. This Quantitative Easing was support for the U.S. Treasury market, municipal bond market, money market mutual funds, elf’s, secondary corporate debt, junk bonds, commercial paper, REPO market, student loans, auto loans and credit card loans.
When the Fed stops buying, are ALL these sectors of the credit market just magically going to fix themselves?
Call me skeptical but the Fed has been buying $120 billion a month of Treasuries over the last two years which is twice as much money as what was pumped into the banking system in 2008. The point is how can you claim the economy is healthier today than 2008 when twice as much money is needed to keep the engine running by having the Fed buy U.S. Treasuries and other credit instruments?
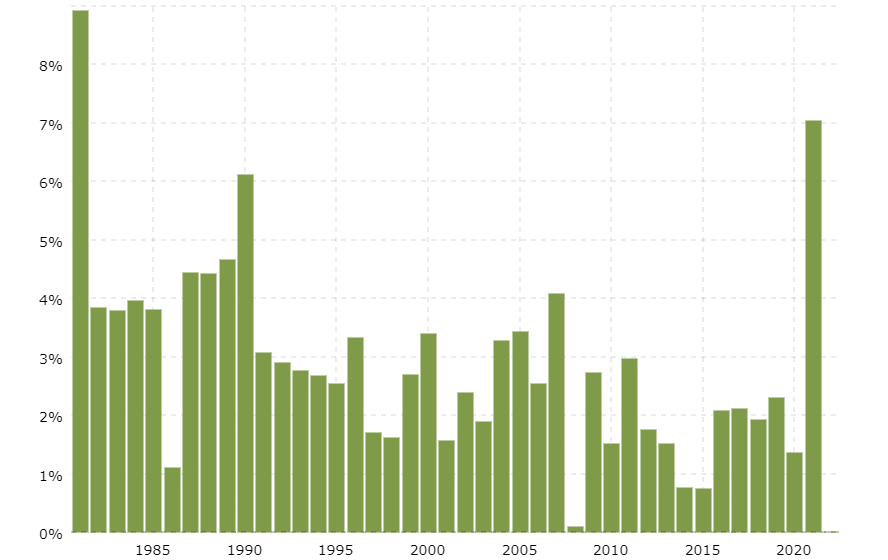
Just yesterday the Bureau of Labor Statistics released their Consumer Price Index, and the number shows inflation spiking to 7% which is the highest value in 40 years. Yet it was only one year ago that the Fed was telling anyone who would listen that their benchmark target for inflation was 2%. I’m not trying to be a party pooper here, but 7% is three and a half times as much as 2%.
The point I am making is that we can listen to what the Fed is saying, but we need to pay attention to what they are actually doing. The contrast is striking!
I think the Fed wants to raise rates.
I think the Fed wants to stop adding credit instruments to its balance sheet.
I just don’t think they can, without destroying the economy and financial markets.
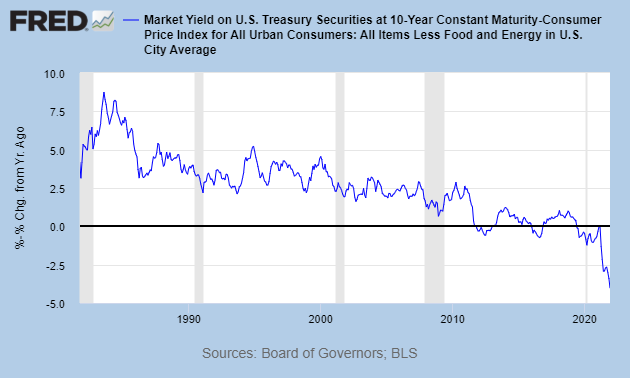
Yesterday’s CPI number paints a very grim story regarding U.S. Treasury debt.
The Yield on a US Treasury Ten Year note is currently 1.7%.
Subtract the Consumer Price Index value from that yield and you have a Real Rate of Return on Government debt at negative – 5.3%. This is the risk-free rate. Or stated another way, it is the guaranteed return that the government provides you for purchasing their credit instruments.
Who do you know that willingly will invest in a guaranteed loss of 5.3%? Are you going to buy U.S. Debt and help the U.S. government finance their debt? Do you know anyone who will?
The Fed is the only game in town!
Sure, pension funds are mandated to invest in U.S. Treasuries, and you don’t have to be a rocket scientist to anticipate the problems that creates in honoring the retirement obligations of public servants. Most pension funds need 7% yields to be able to remain solvent. When a pension fund invests in U.S. Treasuries with a negative real rate of return, you can anticipate that they will have huge problems honoring their pensioners soon.
Here is a long-term chart of the Real Rate of Return maintained by The Federal Reserve. It is the long-term yield on 10-year treasuries less the consumer price index value. I think about this chart all the time. The question worth asking is, now that the fiscal and monetary cliff has arrived and the Fed will stop buying U.S. Treasuries, who purchases those credit instruments? Look at how the Real Rate of Return has been negative for several years. Stated another way, for the last few years, savers cannot save.
The only two other choices are that the government must cut back spending which is highly unlikely, or they have to dramatically increase taxes to eliminate the budget deficit.
Here is why this question is so important.
The traditional economic theory tries to isolate the economy into the following 4 quadrants.
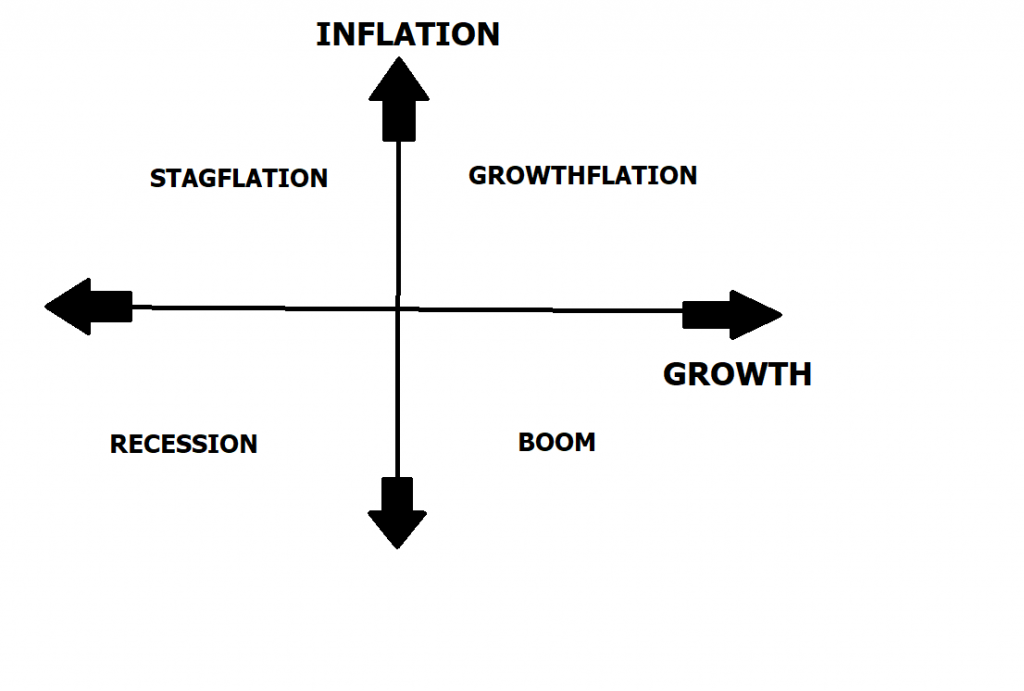
With inflation increasing and growth decreasing you have an economic climate that hovers between stagflation and recession with the higher probability being recession.
The valuation of the stock market is based upon the present value of cash flows and future expectations of future value and growth. In a deflationary environment, the present value of money is worth the same or more in the future. But when inflation rears its ugly head, that $1 you have to invest today at 5% inflation is only worth .75 cents 5 years from now. At 7% inflation, that $1 today is worth less than 65 cents 5 years from now.
In other words, once we account for inflation, stock valuations are way too high.
Wall Street is future expectations.
We don’t invest in stocks for how they are valued today, but rather how they will grow or shrink in the future.
A simplified example that focuses on the important variables will help us to understand.
Let’s say that my future predictions about the Company X are that they will grow their earnings and profits in the coming years. For simplicity, let’s say I am willing to pay 12 times multiple on their earnings of $1 billion today to participate in that growth. Let’s say we expect future profits to be $5 billion dollars five years from now and we expect zero inflation during that time.
If we are correct about our inflation expectations and the company meets our targets, a 12X multiple may be the perfect valuation. But if we factor 7% inflation into the mix, the numbers are drastically different and potentially catastrophic in only 5 years.
If we are wrong about our inflation expectations, we could be overvaluing the stock at the present by as much as 35% today.
This is why the markets are scared and nervous at the moment.
Do you remember the story of Rip Van Winkle?
It was a story written by Washington Irving in 1819. The story is a fable about a man who goes into the woods to escape his wife’s nagging. However, Rip falls asleep for many, many years and when he awakes, he discovers a world that is almost unrecognizable.
I use this fable as a metaphor because todays fast paced interconnected world is a far cry from the financial marketplace yesteryear. In the words of futurist Alvin Toffler, “change will happen faster and faster.”
Today, economists defend ideas like negative interest rates which were impossibilities before the Great Financial Crisis. Today we have a monetary printing press gone wild at levels never seen in our country’s history.
Imagine if you fell asleep 14 years ago how you might react to seeing how the financial landscape had changed compared to the world of today! Stop and think of the challenge of trying to understand the effects of a Federal Reserve that had grown its balance sheet by 775% in 13 years and was now saying that they were going to stop cold turkey. Or economic lockdowns, a pandemic and inflation rising at the fastest pace in 40 years.
Things in the financial markets are going to get very interesting in the coming weeks as the fiscal and monetary cliff arrives. I’m anticipating greater volatility and the probability of a huge selloff is very real if the FED stops buying bonds as they have stated.
I’ve shared with you my fundamental thesis. I think I’m right. But, more importantly over the years I’ve learned that what matters in trading and investing is a reliable method that keeps me out of harm’s way.
What’s Your Best Chance to Make Money in The Financial Markets Today?
The Answer A.I. offers will surprise you.
Today Artificial Intelligence, Machine Learning and Neural Networks are an absolute necessity in protecting your portfolio.
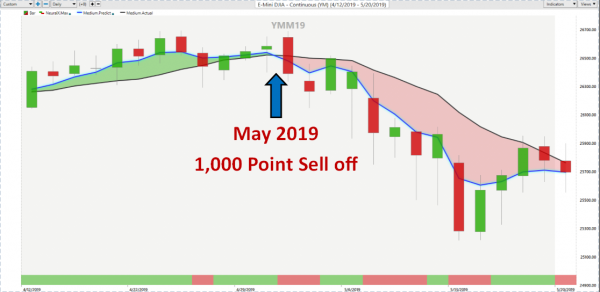
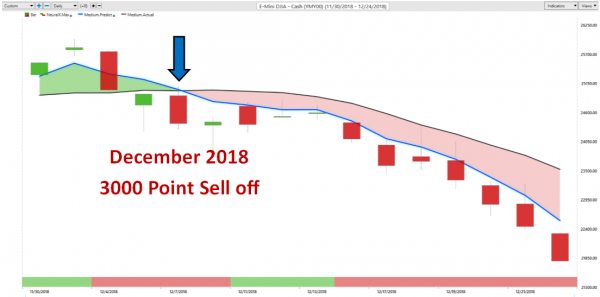
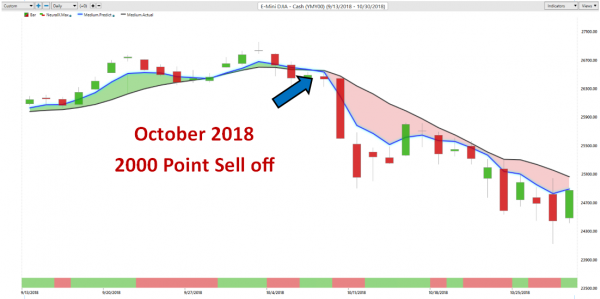
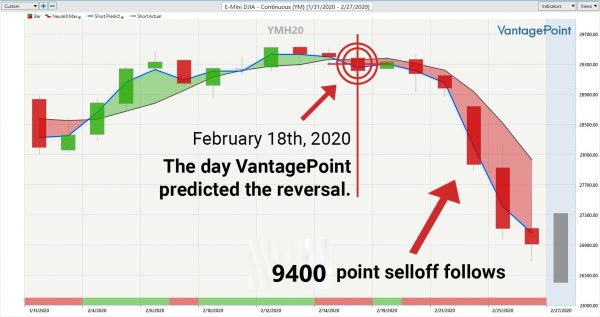
I have a very strong opinion that stocks are going to go lower if the Fed follows through on their announcements. But my “NORTH STAR” will always be the trend highlighted by the artificial intelligence.
A.I. combined with neural networks are exactly the types of analytical horsepower you need to stay on the right side of the right trend at the right time.
If survival of the fittest makes you uneasy, stay out of this zero-sum game.
If you want to win, it’s all about who has the best tools.
Artificial intelligence is so powerful because it learns what doesn’t work, remembers it, and then focuses on other paths to find a solution. This is the Feedback Loop that is responsible for building the fortunes of every successful trader I know.
That should get you excited because it is a game changer!
While reporters, talking heads and analysts want to discuss esoteric economic ideas, my only loyalty as a trader is to the trend! This is how VantagePoint artificial intelligence simplifies and empowers traders daily!
Visit With US and check out the a.i. at our Next Live Training.
It’s not magic. It’s machine learning.
Make it count.

IMPORTANT NOTICE!
THERE IS SUBSTANTIAL RISK OF LOSS ASSOCIATED WITH TRADING. ONLY RISK CAPITAL SHOULD BE USED TO TRADE. TRADING STOCKS, FUTURES, OPTIONS, FOREX, AND ETFs IS NOT SUITABLE FOR EVERYONE.
DISCLAIMER: STOCKS, FUTURES, OPTIONS, ETFs AND CURRENCY TRADING ALL HAVE LARGE POTENTIAL REWARDS, BUT THEY ALSO HAVE LARGE POTENTIAL RISK. YOU MUST BE AWARE OF THE RISKS AND BE WILLING TO ACCEPT THEM IN ORDER TO INVEST IN THESE MARKETS. DON’T TRADE WITH MONEY YOU CAN’T AFFORD TO LOSE. THIS ARTICLE AND WEBSITE IS NEITHER A SOLICITATION NOR AN OFFER TO BUY/SELL FUTURES, OPTIONS, STOCKS, OR CURRENCIES. NO REPRESENTATION IS BEING MADE THAT ANY ACCOUNT WILL OR IS LIKELY TO ACHIEVE PROFITS OR LOSSES SIMILAR TO THOSE DISCUSSED ON THIS ARTICLE OR WEBSITE. THE PAST PERFORMANCE OF ANY TRADING SYSTEM OR METHODOLOGY IS NOT NECESSARILY INDICATIVE OF FUTURE RESULTS. CFTC RULE 4.41 – HYPOTHETICAL OR SIMULATED PERFORMANCE RESULTS HAVE CERTAIN LIMITATIONS. UNLIKE AN ACTUAL PERFORMANCE RECORD, SIMULATED RESULTS DO NOT REPRESENT ACTUAL TRADING. ALSO, SINCE THE TRADES HAVE NOT BEEN EXECUTED, THE RESULTS MAY HAVE UNDER-OR-OVER COMPENSATED FOR THE IMPACT, IF ANY, OF CERTAIN MARKET FACTORS, SUCH AS LACK OF LIQUIDITY. SIMULATED TRADING PROGRAMS IN GENERAL ARE ALSO SUBJECT TO THE FACT THAT THEY ARE DESIGNED WITH THE BENEFIT OF HINDSIGHT. NO REPRESENTATION IS BEING MADE THAT ANY ACCOUNT WILL OR IS LIKELY TO ACHIEVE PROFIT OR LOSSES SIMILAR TO THOSE SHOWN.

