

Founded in 1982, EA was one of the first companies to explore the idea of home computer games. Electronic Arts manufactures, publishes, and distributes video games, content, and services for game consoles, PCs, mobile phones, and tablets worldwide. The company has been very successful at joint venturing with professional sports leagues and individuals across various genres, such as sports, first-person shooter, action, role-playing, and simulation primarily under the Battlefield, The Sims, Apex Legends, Anthem, Need for Speed, and Plants v. Zombies, FIFA, Madden NFL, and Star Wars brands. The firm also provides advertising services; licenses its games to third parties to distribute and host its games.
Over the last decade as computers have become faster and faster, video games have been capable of creating very realistic and lifelike experiences for the gamers who play them. One of the most important reasons for the booming gaming industry is that online games are affordable for everyone. These games transport the players into new realities that satisfy a need for excitement, achievement, and recognition. Electronic Arts has a market cap of $38.3 billion and trades on average 2.6 million shares per day.
The gaming industry, while solid has underperformed other sectors of the economy. This is surprising as simple logic would dictate that during an economic lockdown you would postulate that more demand would exist for these products and services.
Electronic Arts (EA) competitors include Blizzard Entertainment, Discord, Niantic, Activision, and Ubisoft. Electronic Arts Inc. has established itself as the global leader in digital interactive entertainment with more than 450 million registered players around the world and among the most popular gaming franchises.

The stock of Electronic Arts ($EA) has outperformed its peers, which says a lot about the sales potential of its upcoming release schedule, coupled with EA’s relatively low valuation. However, on the flip side $EA continues to underperform the broader stock market indexes. Over the past six months the S&P has gained 10.31%. Even with the recent rally in $EA, over the same period, it is down 5.84% comparatively.
The company has a very diverse portfolio of gaming franchises and is very well positioned to expand its market share.
In this stock analysis we will evaluate the following metrics and indicators to determine what the best course of action is regarding $EA stock trading.
- Wall Street Analysts’ Estimates
- 52-week high and low boundaries
- Vantagepoint A.I. Forecast (Predictive Blue Line)
- Neural Network Forecast
- Daily Range Forecast
- Intermarket Analysis
- Our Suggestion
We don’t base decisions on things like earnings or fundamental cash flow valuations. However, we do look at them to better understand the financial landscape that a company is operating under.
Analysts Ratings
The very first thing we like to do in our analysis is to take a quick look at what the Wall Street Analysts are thinking about $EA.
Based on 6 Best Performing Wall Street analysts offering 12-month price targets for Electronic Arts in the last 3 months. The average price target is $170.17 with a high forecast of $179.00 and a low forecast of $150.00. The average price target represents a 25.85% change from the last price of $135.22.
Power Traders love to see this type of divergent opinion on a stock that is widely traded. $EA is undervalued according to the analysts on Wall Street that get paid to watch it 24/7.
52-week High-Low Chart
Next, we want to see where we are trading in relation to the 52-week range.
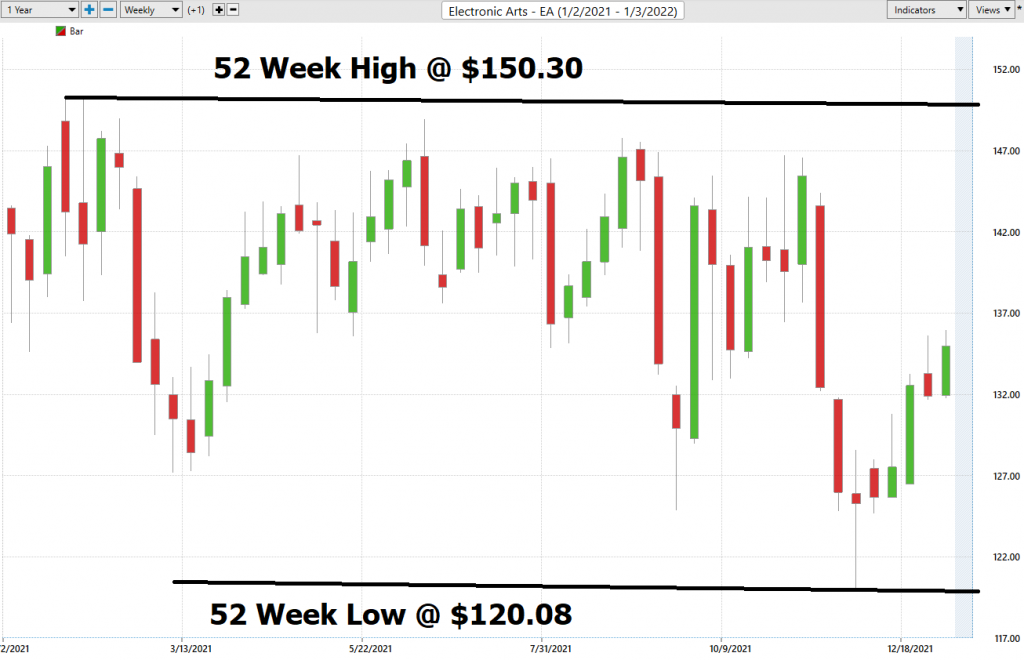
Over the last 52 weeks $EA has traded as high as $150.30 and as low as 120.08. This means provides us with an annual trading range of $30.22 When we divide this metric by 52 weeks, we can determine that the average weekly trading range for EA is $.58 cents. What we often like to do as well is to divide the annual trading range ($30.22) by the current price ($135.57) to provide us with a very basic and generic calculation of how the annualized volatility for $EA, which is currently 22.3%.
We refer to these as the commonsense metrics which we use as baseline measurements of understanding normal value. When using artificial intelligence, we look to amplify our returns based upon these baseline measurements.
Another simple way to look at the current price is to determine where we are in relation to that 52-week range. Currently, the price is 51% off the low and 49% off the high. In other words, we are right smack in the middle of the trading range established over the past year.
Whenever we trade, we always pay attention to where we are in relation to the 52-week trading range. It is very common to see the 52-week high provide very strong resistance to the market until it is breached. Often when the 52-week high is breached we will see the stock price explode higher very quickly over a very short period.
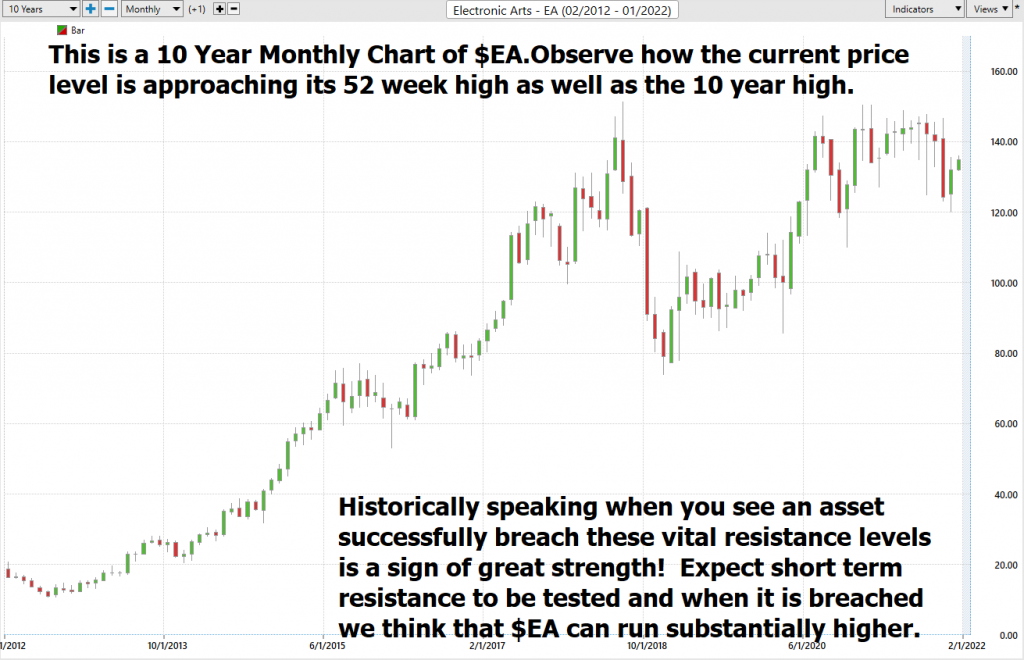
Zooming out on the stock, we also like to look at where we are in relation to the 10-year annual range. This chart, in my opinion paints a potentially explosive situation. $EA is well below its 52-week high at the present. But as you can see from the 10-year chart, its 52 week high corresponds very closely with its 10 year high. We think the breaching of this boundary will create explosive opportunity for $EA.
Best Case – Worst-Case Scenarios
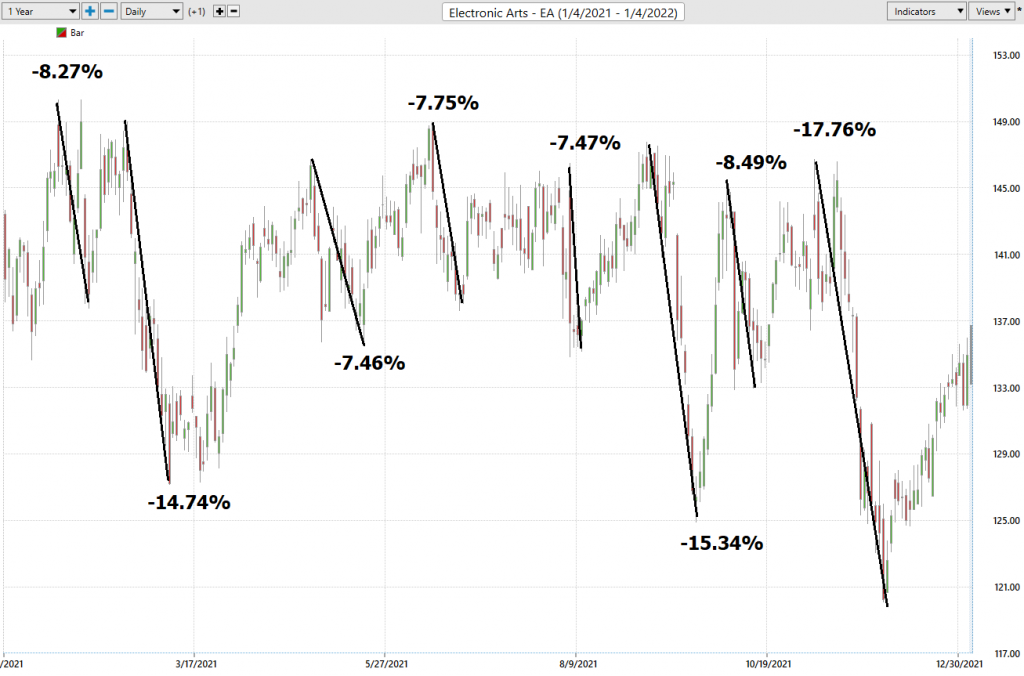
When we study the long term 52-week chart we can look at the best case and worst-case scenarios just to get an eyeball perspective of the risk and volatility of this asset. This is worth doing anytime you invest or trade to monetarily understand what the potential risks and rewards have been over the past year. In the 52-Week Analysis we already concluded that the volatility of $EA was 22.3%. That number tells us that “NORMAL” is defined as prices one year from now being 22.3% higher or lower than the current price. That would have us looking at a prospective range of $105 to $165 as extreme measures over the coming year.
Here is a snapshot of the drawdowns that $EA has experienced over the past year measured on a percentage basis. You can see that the worst drawdown on the year was -17.76%. More importantly, you can see that the stock had a whipsaw tendency all year. It would rally. Then give back all gains. It repeated this cycle throughout all of 2021.
Here is the best-case analysis which allows you to see how short-lived the rallies in $EA have been.
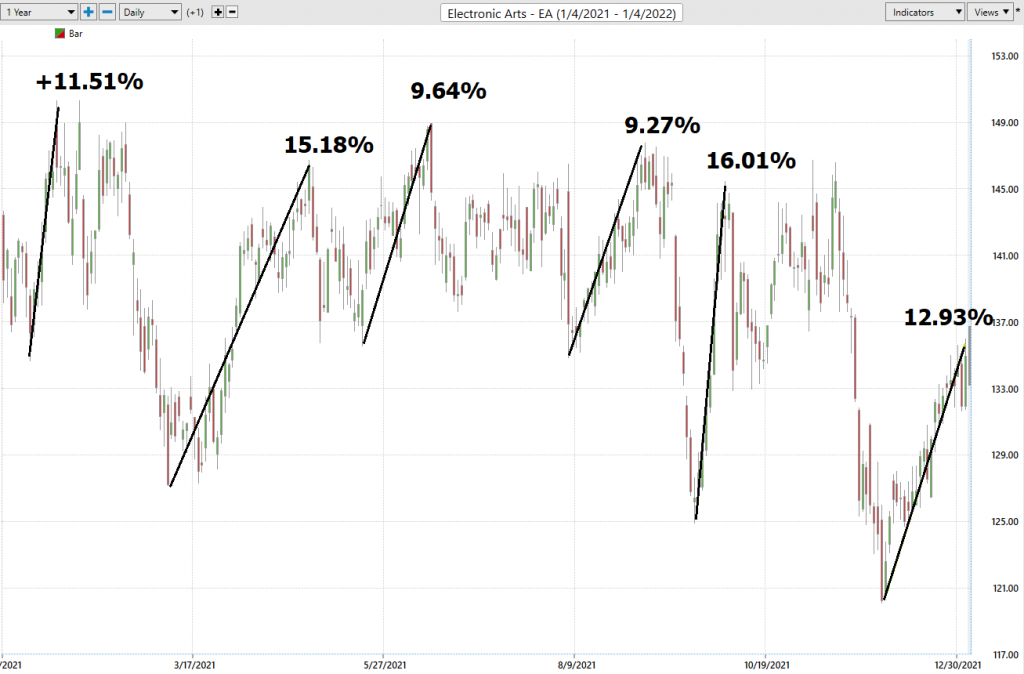
It is worth doing this type of baseline analysis because it allows you to quickly compare understand the performance of $EA and to understand its risk and reward possibilities.
The reason we do this simple analysis is that a common mistake that many traders make is that they get too greedy whenever they trade. In other words, they want more than what the market is willing to give. From this very simple analysis we can immediately determine that this is not a buy and hold stock. We look for good entries guided by the a.i. and risk $1 to make $2.50.
Next, we compare $EA to the major broad market indexes. Over the past year $EA has been a major laggard.
$EA -3.93%
S&P 500 Index +28.62%
Down Jones Industrials +21.08%
NASDAQ +49.57%
Russell 1000 Index +26.16%
So, in $EA we have an asset which has massively underperformed the broader stock market indexes. It is trading in the middle of its 52-week range and appears to be well within striking distance of its 52-week high and 10-year high prices. However, the stark reality is that it has had a slight downward bias all year and its largest ally trough to the peak was 16%.
The Vantagepoint A.I. Analysis
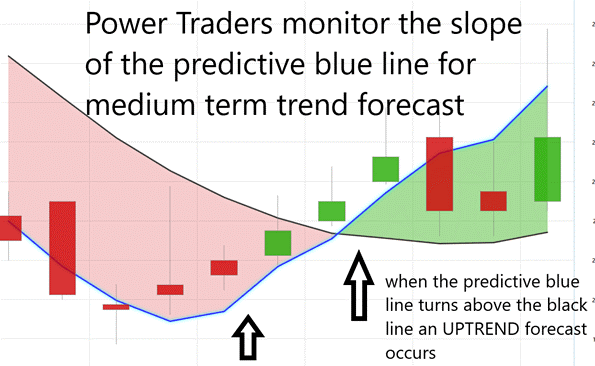
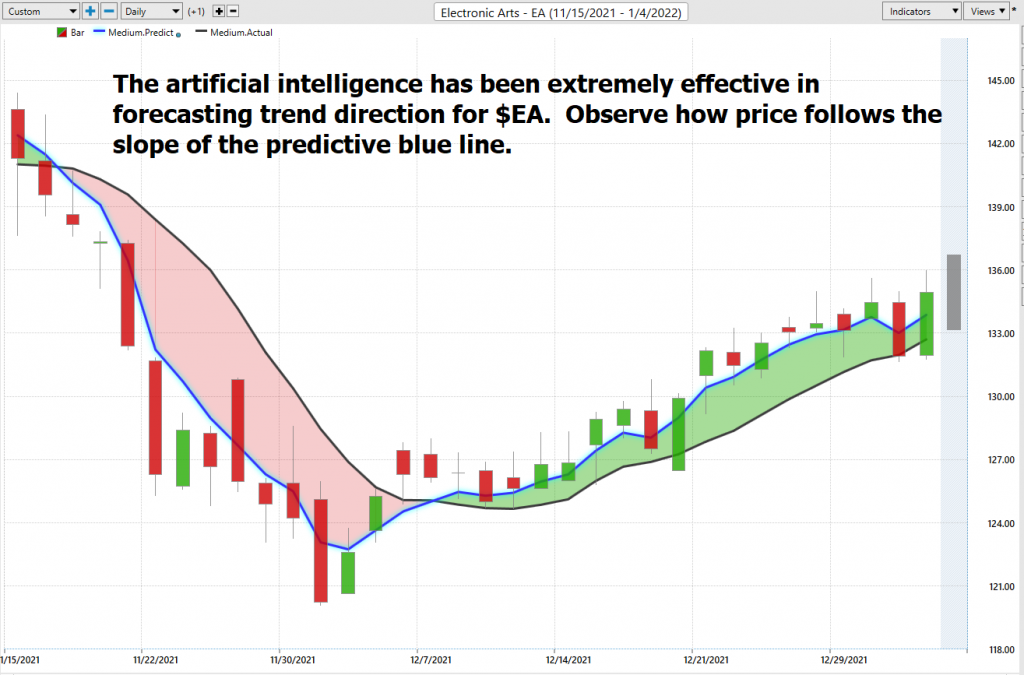
Using VantagePoint Software and the artificial intelligence, traders are alerted to trend forecasts by monitoring the slope of the predictive blue line. The black line is a simple 10 day moving average of price which simply tells you what has occurred in the market. The predictive blue line also acts as value zone where in uptrends traders try to purchase the asset at or below the blue line.
In studying the chart above pay close attention to the slope of the blue line.
Power Traders pay close attention to the relationship between the black line and predictive blue line. The black line is just a simple 10 day moving average. It is calculated by taking the closing prices of the last 10 days and dividing that sum by 10. All that the black line tells you is what has occurred. It tells you where prices have been and what the average price over the last ten days is.
The predictive blue line, on the other hand utilizes that Vantagepoint patented Neural Network and Intermarket Analysis to arrive at its value. It looks at the strongest price drivers of an asset through artificial intelligence and statistical correlations to determine its value.
Whenever we see the predictive blue line move above the black line, we are presented with an UP-forecast entry opportunity.
Power traders use the predictive blue line in helping to determine both the value zone as well as the trend direction.
Observe how the SLOPE of the predictive blue line started moving higher a few days previous to its moving above the black line. A very strong trend was evidenced by seeing that price was consistently closing above the predictive blue line.
Fine Tuning Entries with The Neural Net Indicator
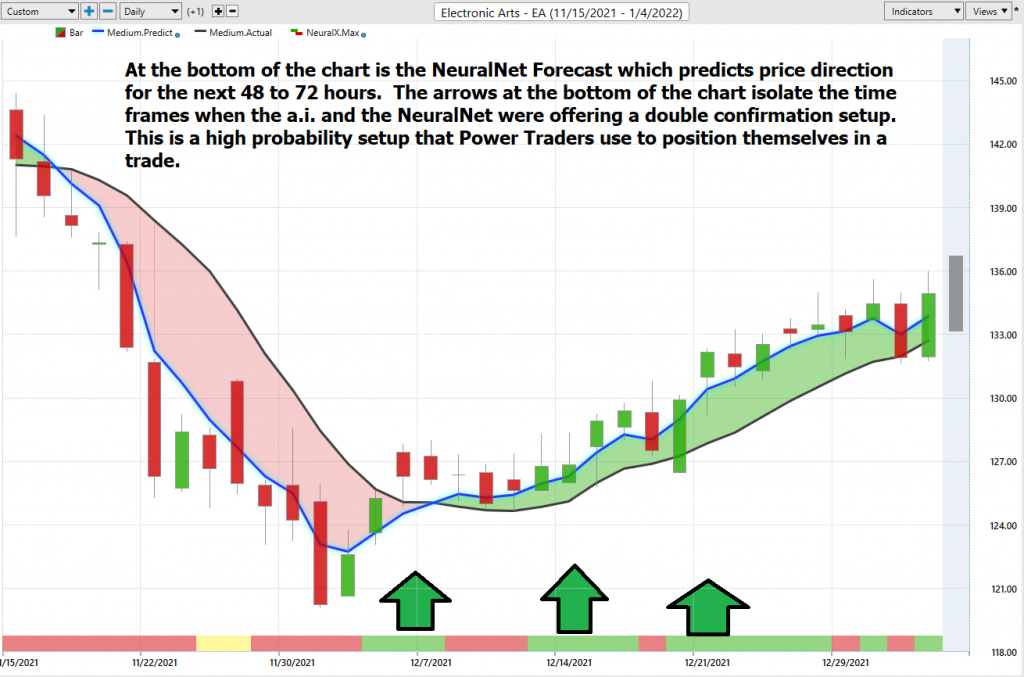
At the bottom of the chart is the Neural Network Indicator which predicts future strength and/or weakness in the market. When the Neural Net Indicator is green it communicates strength. When the Neural Net is Red it is forecasting short-term weakness in the market.
A Neural Net is a computational learning system that uses a network of functions to understand and translate massive amounts of data into a desired output, consistently monitoring itself and improving its performance.
Whenever Power Traders are looking for statistically valid trading setups, they look for a DOUBLE confirmation signal. This signal occurs whenever the blue predictive line and the Neural Net at the bottom of the chart suggest the same future expected outcome.
We advocate that Power Traders cross reference the chart with the predictive blue line and neural network indicator to create optimal entry and exit points.
Power Traders are always looking to apply both the neural network and a.i. to the markets to find statistically sound trading opportunities.
We advise Power Traders to cross reference the predictive blue line with the Neural Net for the best entry opportunities. Observe how the slope of the predictive blue line has remained positive from the time earnings were announced.
VantagePoint Software Daily Price Range Prediction
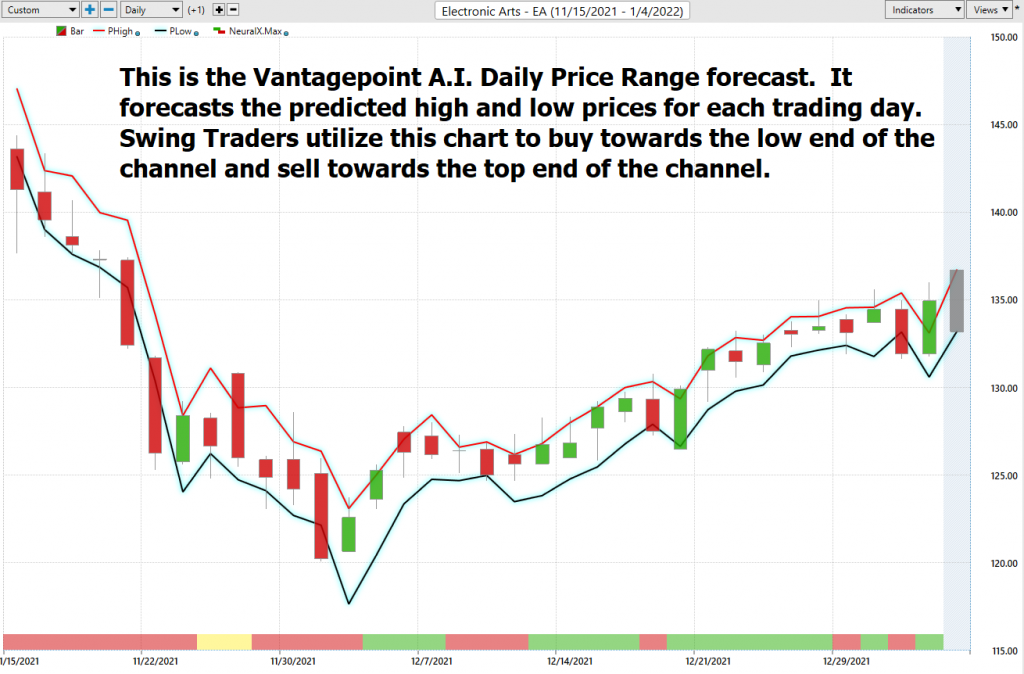
One of the powerful features in the Vantagepoint A.I. Software which Power Traders use daily is the Daily Price Range prediction forecast.
This forecast is what permits Power Traders to truly fine tune their entries and exits into the market. Whenever traders decide to enter a market, they need to be able to define where the value zone is as well as where something might be overvalued. The Daily Price Range Forecast answers these questions with exacting precision and detail
Here is the price chart of $EA during the most recent runup featuring the Daily Price Range forecast and the Neural Net Indicator. Observe in the following chart how clearly the trading channel is delineated.
Intermarket Analysis
What makes the Vantagepoint Software truly unique is its ability to perform Intermarket analysis and to locate those assets which are most interconnected that are responsible for driving the price of $EA higher or lower.
Studying the charts can always provide objective realities in terms of locating support and resistance levels which become very clear on a chart. But we live in a global marketplace. Everything is interconnected. The billion-dollar question for traders is always what are the key drivers of price for the underlying asset that I am trading?
These intangibles are invisible to the naked eye yet show very high statistical correlations.
Small changes in Interest rates, Crude Oil Prices, and the Volatility of the dollar amongst thousands of other variables affect the decisions companies must make to survive in these very challenging times. Trying to determine what these factors are is one of the huge problems facing investors and traders.
There is great value to be had in studying and understanding the key drivers of $EA price action.
By doing so you can often see which ETFs are most likely acquiring $EA as well as uncovering other industries, commodities, forex which affect $EA price movement.
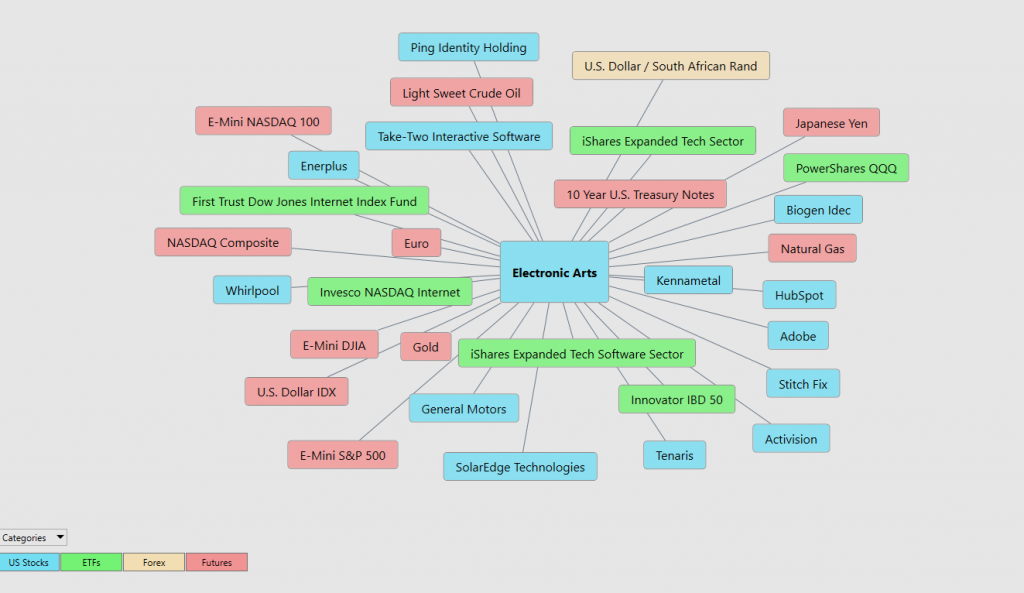
By studying the intermarket regularly, you can regularly find other trading gems that are highly correlated to the price action of $EA.
Our Suggestion
The next Earnings Report date for $EA is tentatively scheduled for January 31, 2022.
We think $EA has tremendous upside potential based upon its current 10-year chart. However, this is not without risk. In assessing the worst-case analysis, it would be considered quite normal to see this stock fall as much as 10% before continuing higher.
The consensus of analysts’ opinions shows it is undervalued. The most bullish estimates believe that it can run to $180. If the guidance from the artificial intelligence remains bullish, we think that opportunities for buying breaks in this asset with tight stops are worth considering. $EA has massively underperformed the broader market indexes, so it is considered a “catch-up” play.
Earnings will be the key driver in $EA. The 52-week high at $150.30 will provide resistance to the market. However, when that is breached this asset can quickly run 20% higher.
Practice Good Money Management on all your trades.
Let’s Be Careful Out There!
Remember, It’s Not Magic.
It’s Machine Learning.

IMPORTANT NOTICE!
THERE IS SUBSTANTIAL RISK OF LOSS ASSOCIATED WITH TRADING. ONLY RISK CAPITAL SHOULD BE USED TO TRADE. TRADING STOCKS, FUTURES, OPTIONS, FOREX, AND ETFs IS NOT SUITABLE FOR EVERYONE.
DISCLAIMER: STOCKS, FUTURES, OPTIONS, ETFs AND CURRENCY TRADING ALL HAVE LARGE POTENTIAL REWARDS, BUT THEY ALSO HAVE LARGE POTENTIAL RISK. YOU MUST BE AWARE OF THE RISKS AND BE WILLING TO ACCEPT THEM IN ORDER TO INVEST IN THESE MARKETS. DON’T TRADE WITH MONEY YOU CAN’T AFFORD TO LOSE. THIS ARTICLE AND WEBSITE IS NEITHER A SOLICITATION NOR AN OFFER TO BUY/SELL FUTURES, OPTIONS, STOCKS, OR CURRENCIES. NO REPRESENTATION IS BEING MADE THAT ANY ACCOUNT WILL OR IS LIKELY TO ACHIEVE PROFITS OR LOSSES SIMILAR TO THOSE DISCUSSED ON THIS ARTICLE OR WEBSITE. THE PAST PERFORMANCE OF ANY TRADING SYSTEM OR METHODOLOGY IS NOT NECESSARILY INDICATIVE OF FUTURE RESULTS. CFTC RULE 4.41 – HYPOTHETICAL OR SIMULATED PERFORMANCE RESULTS HAVE CERTAIN LIMITATIONS. UNLIKE AN ACTUAL PERFORMANCE RECORD, SIMULATED RESULTS DO NOT REPRESENT ACTUAL TRADING. ALSO, SINCE THE TRADES HAVE NOT BEEN EXECUTED, THE RESULTS MAY HAVE UNDER-OR-OVER COMPENSATED FOR THE IMPACT, IF ANY, OF CERTAIN MARKET FACTORS, SUCH AS LACK OF LIQUIDITY. SIMULATED TRADING PROGRAMS IN GENERAL ARE ALSO SUBJECT TO THE FACT THAT THEY ARE DESIGNED WITH THE BENEFIT OF HINDSIGHT. NO REPRESENTATION IS BEING MADE THAT ANY ACCOUNT WILL OR IS LIKELY TO ACHIEVE PROFIT OR LOSSES SIMILAR TO THOSE SHOWN.

