
![]()
Founded in 1916, Boeing Corporation ($BA) is an iconic American aerospace company created by William Edward Boeing in Seattle, Washington. The company continues to be a leader in the world of commercial aircraft and defense, space, and security systems. They design, develop, manufacture, and support a wide range of products including commercial and military aircraft, satellites, weapons systems and more. In terms of their competitors, they go up against Airbus SE as well as smaller companies such as Bell Inc., GE Aviation and Pratt & Whitney. Airbus, of Europe, is widely considered to be Boeing’s closest rival, having supplanted the traditional American giant as the world’s leading aircraft manufacturer. Other companies such as Bombardier and Embraer are gaining share in areas such as commercial aircraft, business aviation and defense sectors worldwide. However, Boeing remains a household name when it comes to top-tier aircraft manufacturing with civilian and military applications alike. Despite other competitors making strides in recent years, none have been able to stop Boeing from achieving success by a comfortable margin.
As for their business model, Boeing earns revenue from its client base across four key businesses: Commercial Airplanes; Defense, Space & Security; Global Services; and Boeing Capital Corporation (BCC).
Boeing ($BA) is one of the world’s largest aerospace companies, so it comes as no surprise that its workforce is particularly large. In fact, Boeing employees more than 160,000 people across 25 countries around the globe and is currently on track to reach 200,000 by 2023. The company’s history runs deep, with many iconic aircraft being designed and produced over the years – so having a team that reflects their impressive level of expertise is a must. With such a strong presence in global commercial aviation, defense and space and security markets, as well as over 10 decades’ experience under its belt, Boeing will surely continue to be an integral part of the industry for many years to come.
It is also important to note that being part of the Dow Jones Industrial Average since March 2014 speaks highly about the company’s financial standing within the stock market industry.
For years, Boeing had experienced massive success with its 737 family of planes. However, when the company released the 737 MAX in 2017, it faced a series of unprecedented issues. As reported by The New York Times, pilots found that the new plane tended to point its nose sharply downwards during flight; this was linked to faulty sensors that incorrectly detected the plane’s angle and triggered an automated safety system. To address these issues, Boeing recalled hundreds of MAX airplanes and issued multiple software updates to resolve the false readings given by the sensors. Additionally, they stepped up their training protocols, so pilots knew how to override the automation if necessary. Though controversial, as no crashes involving MAX planes were directly linked to this issue, Boeing has since implemented several changes to ensure passenger safety and reestablish trust in their products. This problem has weighed heavily on $BA’s stock price but it appears that management, having worked diligently to address this issue has successfully put all concerns with the 737 MAX in the distant rear-view mirror.
Boeing produces a wide variety of aircraft for both commercial and military purposes. As such, it relies upon a large network of suppliers for many aspects of its business operations. Boeing is known to work with several major suppliers such as GKN Aerospace, Safran, Rockwell Collins and United Technologies Corporation—all major players in the aerospace and defense industries. These companies provide advanced technology design services as well as high-quality parts which are then carefully machined by tool and die makers to exact specifications. They also supply other essential components such as wiring harnesses, avionics, electronics, and software to ensure that each Boeing aircraft always meets the highest standards. Many of these supply chains were massively disrupted during the economic lockdown and pandemic.
As the largest aerospace manufacturer in the world, it’s no surprise that competitive and economic pressures are some of the biggest issues Boeing must face as a business. Most notably, continuing struggles in production and delivery of the troubled 737 MAX airplane have caused a massive drag on profits for several quarters. This, combined with an overall uncertain operation environment due to high levels of geopolitical volatility, has led to high costs across several areas of operation. Additionally, increasing public scrutiny on ethical lapses and safety concerns can pose serious long-term threats to their current success. All these factors together create a challenging situation for Boeing executives to navigate to ensure maximum efficiency and profitability going forward.
It has been a difficult five years for Boeing investors. $BA was hit first by all the mechanical issues surrounding the company’s 737 MAX and then essentially grounded by the pandemic. We think the worst is behind them and the company is slowly rebuilding. Earnings are forecasted to grow by 47.7% per year. The company has a huge amount of debt and many analysts state that the debt is not well covered by operating cash flow.
The company will report its Q4 results on January 25, 2023. We think the recent price action over the past few weeks means that Wall Street is expecting positive results and the stock has been anticipating better financial moving forward. However, be forewarned that the company has been losing money since the pandemic began in Spring 2020. This reality is hard to comprehend when you discover that $BA is a military contractor and receives billions of dollars in new contracts from the U.S. government every year. Make no mistake about it, $BA is unprofitable, and losses have accelerated over the past 5 years.
In this weekly stock study, we will look at and analyze the following indicators and metrics as our guidelines which dictate our behavior in deciding whether to buy, sell, or stand aside on a particular stock.
- Wall Street Analysts Estimates
- 52-week High and Low Boundaries
- Best Case-Worst Case Analysis
- Vantagepoint A.I. Forecast (Predictive Blue Line)
- Neural Network Forecast
- Daily Range Forecast
- Intermarket Analysis
- Our trading suggestion
We don’t base insights on things like earnings or fundamental cash flow valuations. However, we do look at them to better understand the financial landscape that a company is operating under.
Our analysis is geared towards short-term traders. Wall Street contains a vibrant ecosystem of stock market professionals, and two of the most prominent types are investors and traders. More accurately, investors tend to strategize with a longer-term outlook than traders. Generally, investors are looking for more time to increase their portfolio through investments vehicles like stocks and bonds which have a greater chance for appreciation over time, while traders aim to make profits by selling securities quicker and exploiting short-term market trends. In addition, investors are buying a security expecting long-term returns based on an underlying appreciation of the asset or continual income from dividends and interest payments, while traders buy or sell securities to make profits rooted in the fluctuations within a market. Clearly, both investors and traders have different roles on Wall Street, but both can be instrumental in helping enhance overall portfolio performance.
Wall Street Analysts Estimates
The 22 analysts offering 12-month price forecasts for Boeing Co have a median target of $219.00, with a high estimate of $250.00 and a low estimate of $121.00. The median estimate represents a +5.95% increase from the last price of $206.71.
52-week High-Low Chart
Readers of this blog will attest to the fact that we are huge believers in monitoring where a stock is trading in relation to its 52-week range. Our perspective is that winning stocks continuously make new 52-week highs, and we want to be on board for those types of moves. We pay a great deal of attention to how a stock reacts and performs in relation to its 52-week high and low boundaries.
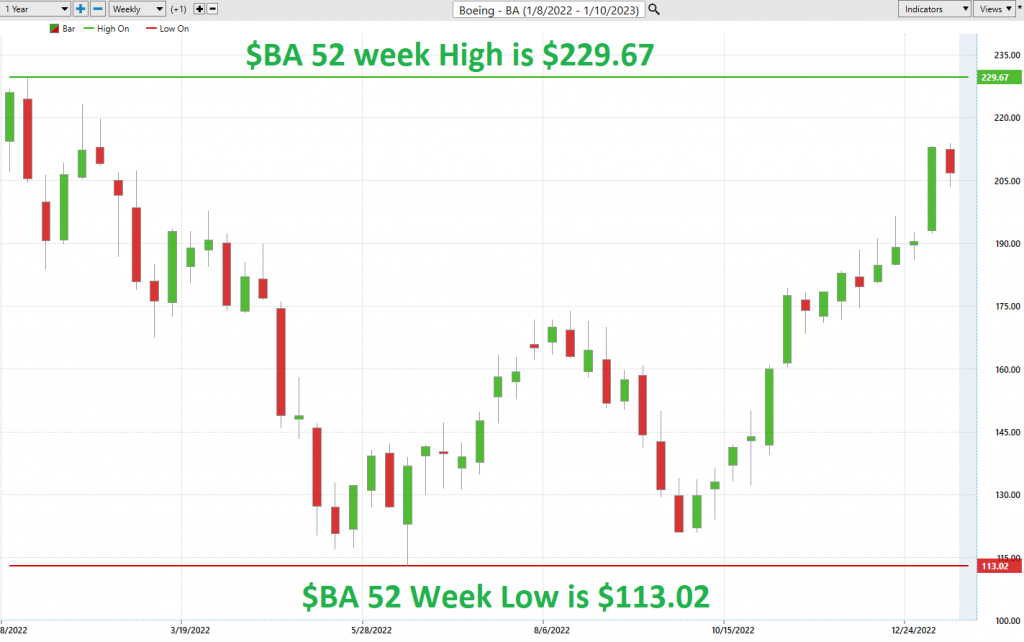
Over the last 52 weeks, $BA has traded as high as $229.67 and as low as $113.02. Its most recent close was $206.69. It is currently trading at its 80th percentile based upon the annual range.
Based upon the high and low prices we can quickly see that the annual trading range of $BA is $116.65. What we also like to do is calculate the statistical volatility to get a realistic view of risk. To do this we simply divide the current price of $206.69 by the annual trading range. This tells us that the annualized statistical volatility is 56.4% Volatility can be an informative metric for stock analysis, as it’s the measure of the amount of fluctuation in a security’s price over time. A high statistical volatility tells us that the stock’s price has been highly variable in past periods, which might indicate greater potential returns soon. Additionally, it could be a sign that traders are trading frequently or speculating heavily on certain stocks due to news events or other catalysts. Moving forward, it is important to make sure that any potential trading opportunity is examined thoroughly before committing capital. With an understanding of what high volatility in stocks can tell us, we can proceed with more confidence and insight when making our decisions.
We refer to these as the commonsense metrics which we use as baseline measurements of understanding normal value. When using artificial intelligence, we look to amplify our returns based upon these baseline measurements.
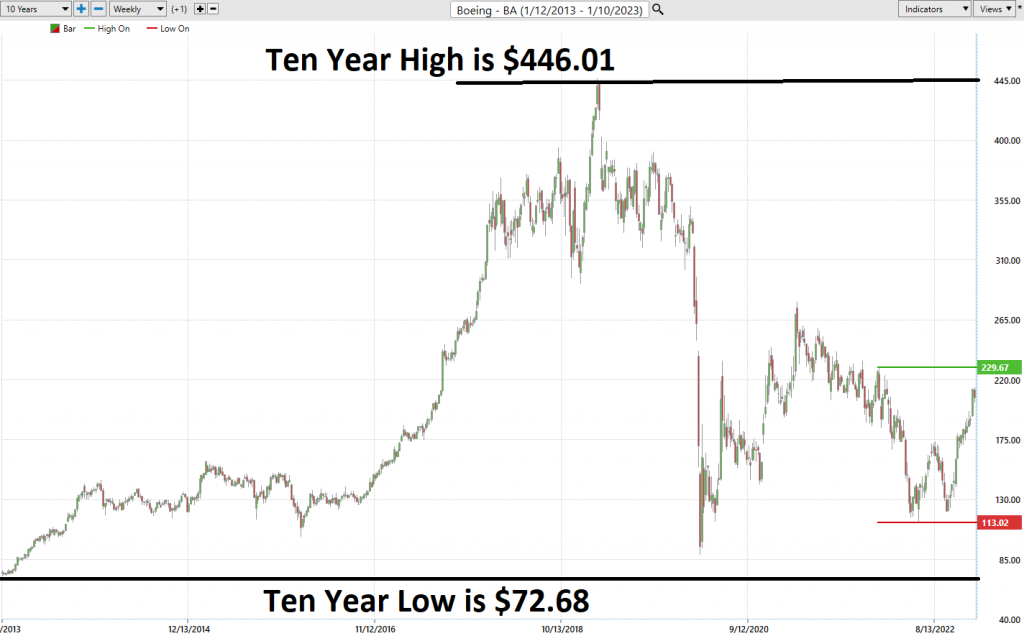
When we zoom out to the longer-term charts for $BA we can see that $BA is still trading well below the annual range of 2017 which is when its problems the 737 MAX mechanical issues began.
Best Case – Worst Case Scenarios
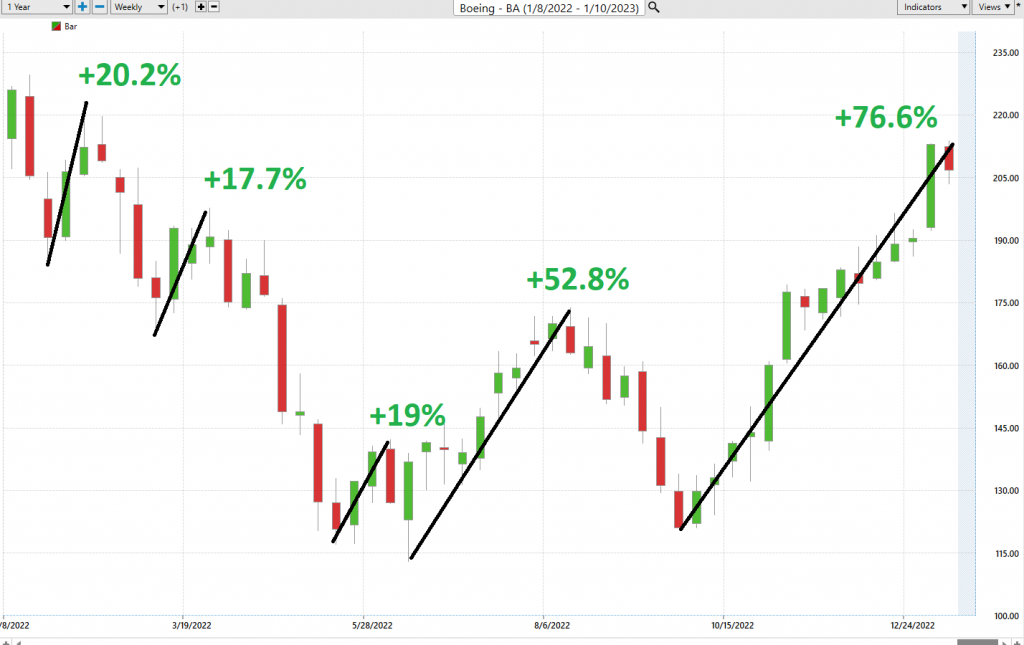
Next, we want to look at the trend over the past year and evaluate the strength of the rallies in relation to the declines. By simply connecting the best and worst possibilities of the trends we can quickly understand the risk associated with trading or investing in $BA.
Here is the best-case analysis:
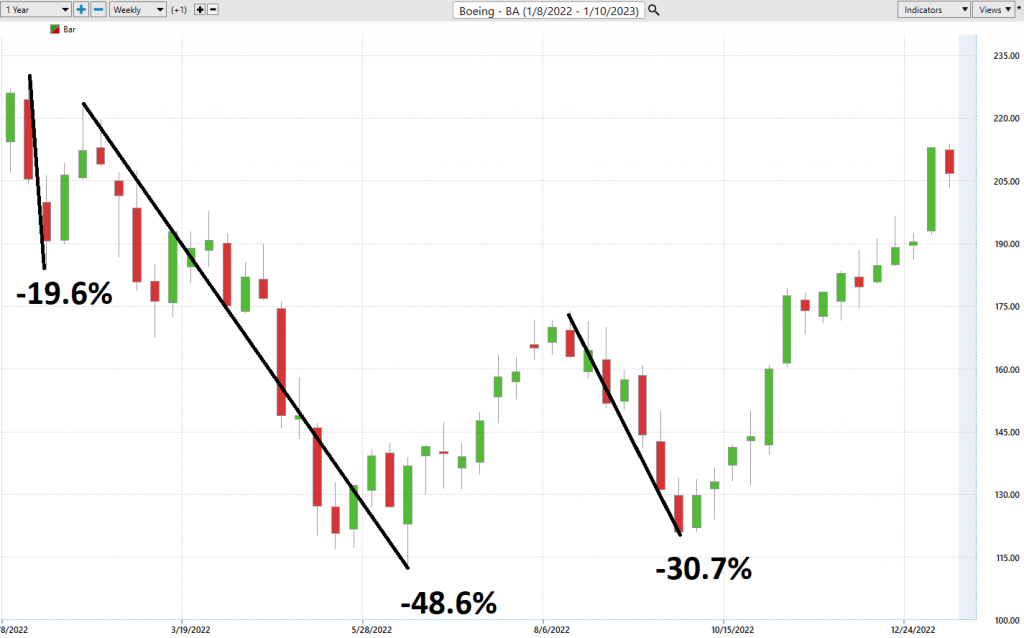
Followed by the Worst-Case Analysis.
What can we learn from this?
This simple perspective provides a real-world view of the volatility associated with trading $BA. Over the past year the stock has been very volatile. This reality offers a great opportunity for swing traders looking for short-term trends.
Lastly, we want to get an idea of how $BA has performed in relation to the rest of the broader market.
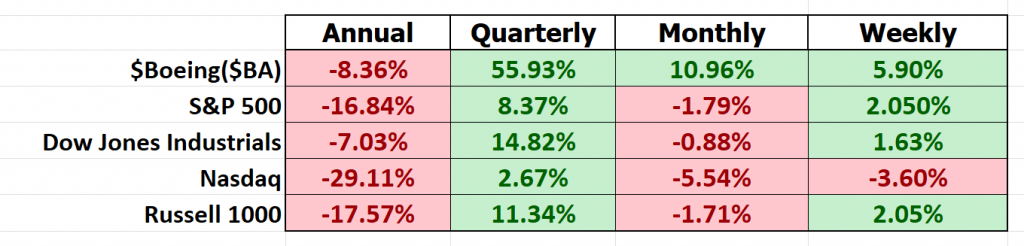
Combing the metrics with the best case/worst case analysis we can conclude that $BA is significantly more volatile than the broader market. It is still down year over year but has managed to correct the other broader term metrics.
The Vantagepoint A.I. Analysis
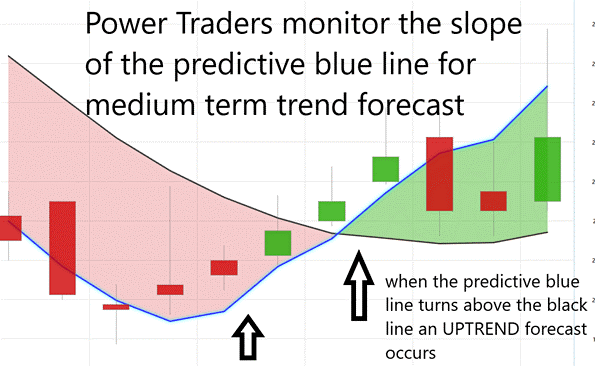
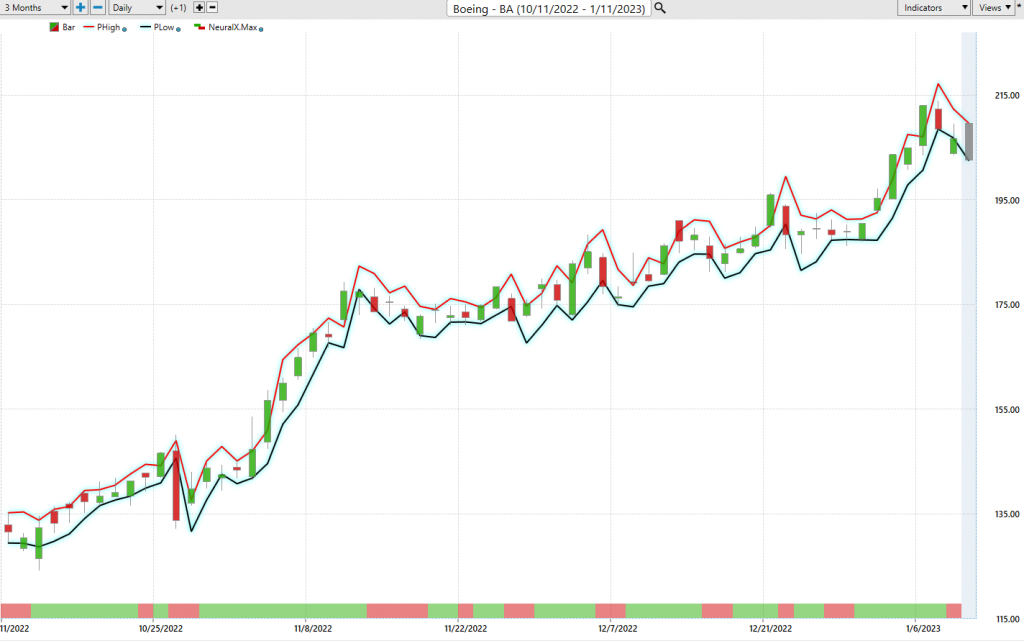
Using VantagePoint Software and the artificial intelligence, traders are alerted to trend forecasts by monitoring the slope of the predictive blue line. The black line is a simple 10-day moving average of price which simply tells you what has occurred in the market. The predictive blue line also acts as value zone where in uptrends traders try to
Pay close attention to the slope of the blue line. Anytime the blue line crosses the zero intercept is a trend signal. If the line crosses from down to up, an UP-trading opportunity exists. If the line crosses from Up to down the down trading opportunity exists.
Power traders use the predictive blue line to help to determine both the value zone as well as the trend direction.
Observe how the SLOPE of the predictive blue line started moving higher a few days before its moving above the black line. A strong trend was evidenced by seeing that prices were consistently closing above the predictive blue line.
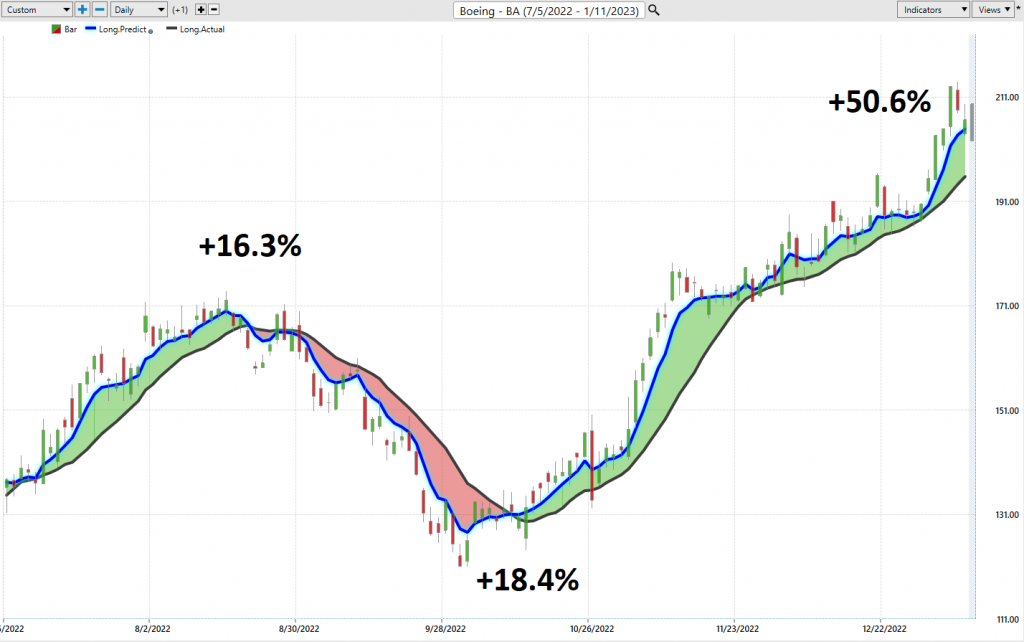
There were three major a.i. trend forecasts over the last 6 months.
#1 was a winner for 16.3%
#2 was a winner for 18.4%
#3 was a winner for 50.6%
Fine Tuning Entries with The Neural Net Indicator
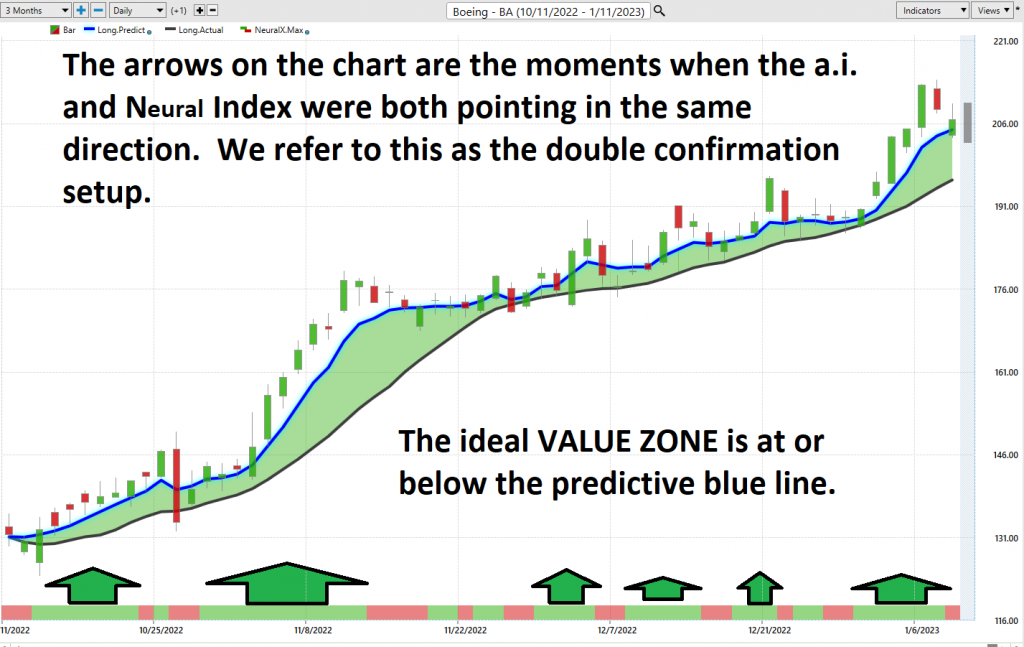
At the bottom of the chart is the Neural Network Indicator which predicts future strength and/or weakness in the market with a 48-to-72-hour time horizon.
A Neural Net is a computational learning system that uses a network of functions to understand and translate massive amounts of data into a desired output, consistently monitoring itself and improving its performance. A neural network for traders is like a massive supercomputer, trained to continuously evaluate hundreds of factors in the stock market to paint a clearer picture than humans ever could. Each input is evaluated and assigned weights based on importance, creating an incredibly accurate mental map, which the network can then use to anticipate future movements. Essentially, it’s as if each factor in the market supports one another like pieces of a large jigsaw puzzle – when all these pieces are understood and properly considered, it can give traders the edge and foresight to anticipate trends and changes in value.
When the Neural Net Indicator is green it communicates strength. When the Neural Net is Red it is forecasting short-term weakness in the market.
We advocate that Power Traders cross reference the chart with the predictive blue line and neural network indicator to create optimal entry and exit points. This provides what we refer to as the DOUBLE CONFIRMATION setup.
Power Traders are always looking to apply both the neural network and a.i. to the markets to find statistically sound trading opportunities.
We advise Power Traders to cross-reference the predictive blue line with the Neural Net for the best entry opportunities.
VantagePoint Software Daily Price Range Prediction
The purpose of all these indicators so far is to help traders stay on the right side of the right trend at the right time.
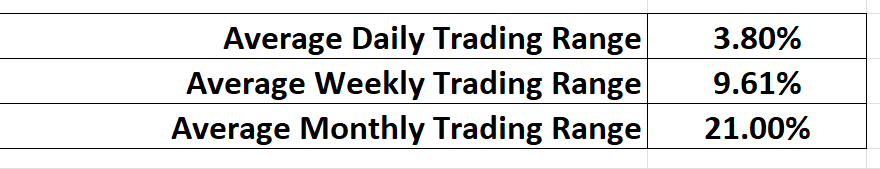
One of the powerful features in the Vantagepoint A.I. Software which Power Traders use daily is the Daily Price Range prediction forecast.
This forecast is what permits Power Traders to truly fine tune their entries and exits into the market, often looking for smaller time frames and more granular trading opportunities.
Here is what the average trading ranges have been on $BA over the past year for the daily, weekly, and monthly time frames.

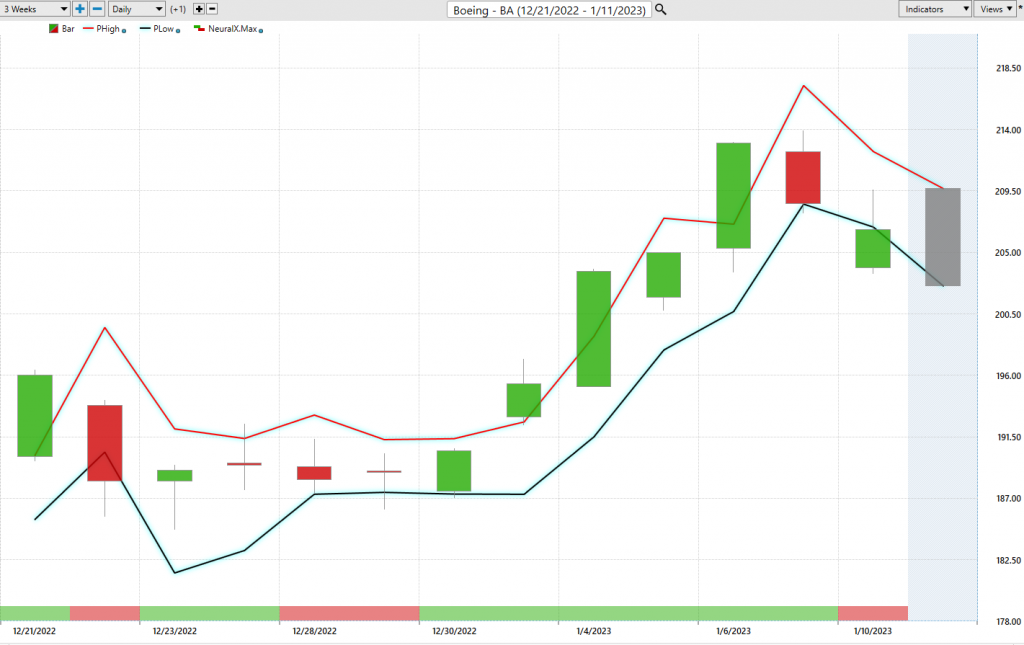
When it comes to getting the most out of trades, the old Wall Street adage is to buy low, sell high. While this has been a mantra of investors for generations, it can be difficult to time the market correctly and therefore does not always result in maximum returns. An alternative strategy which may increase your chances of higher returns is to look for stocks that are already increasing in price over time and buy those highs and ride their uptrend. By finding a strong trend heading up, that has had continuous growth in recent months, you can capitalize on further increases in prices. Doing so means your entry point is higher than if you were simply buying low and waiting for prices to rise; yet because the underlying trend indicates an upward trajectory, you could reasonably expect to see returns should the trend persist or even increase. Purchasing high can be beneficial if done properly, benefiting from future raises while limiting downside risk. Using the Vantagepoint A.I. Daily Range forecast allows Power Traders to anticipate where the value zone is over very short-term horizons.
Here is the price chart of $BA during the most recent runup featuring the Daily Price Range forecast and the Neural Net Indicator. Observe how effective the daily range forecast is in clearly delineating the trend.
All the tools so far in this analysis attempt to define value and to clearly identify the trend and points within the trend where traders should look to capitalize on.
Intermarket Analysis
Intermarket analysis is an important tool in trading stocks such as Boeing ($BA). With this method, a trader can assess the relationship between one market and the other in order to gain insight into how individual stocks will be affected. For example, a trader could use intermarket analysis to assess the correlation between Boeing’s stock price movements and those of its industry competitors or related sectors such as the aerospace industry or airline stocks. A trader may also look at macro factors like interest rates, national spending bills, or currency fluctuations that could potentially influence Boeing’s stock price. With this insight, they can formulate effective strategies on when best to enter and exit a trade with Boeing. By utilizing intermarket analysis, traders can arm themselves with comprehensive knowledge of how different markets are connected in order to provide them with an edge when making trading decisions.
What makes the Vantagepoint Software unique is its ability to perform Intermarket analysis and to locate those assets which are most interconnected that are responsible for driving the price of $BA higher or lower.
Studying the charts can always provide objective realities in terms of locating support and resistance levels which become clear on a chart. But we live in a global marketplace. Everything is interconnected. The billion-dollar question for traders is always what are the key drivers of price for the underlying asset that I am trading?
These intangibles are invisible to the naked eye yet show very high statistical correlations.
Minor changes in Interest rates, Crude Oil Prices, and the Volatility of the dollar amongst thousands of other variables affect the decisions companies must make to survive in these challenging times. Trying to determine what these factors are is one of the huge problems facing investors and traders.
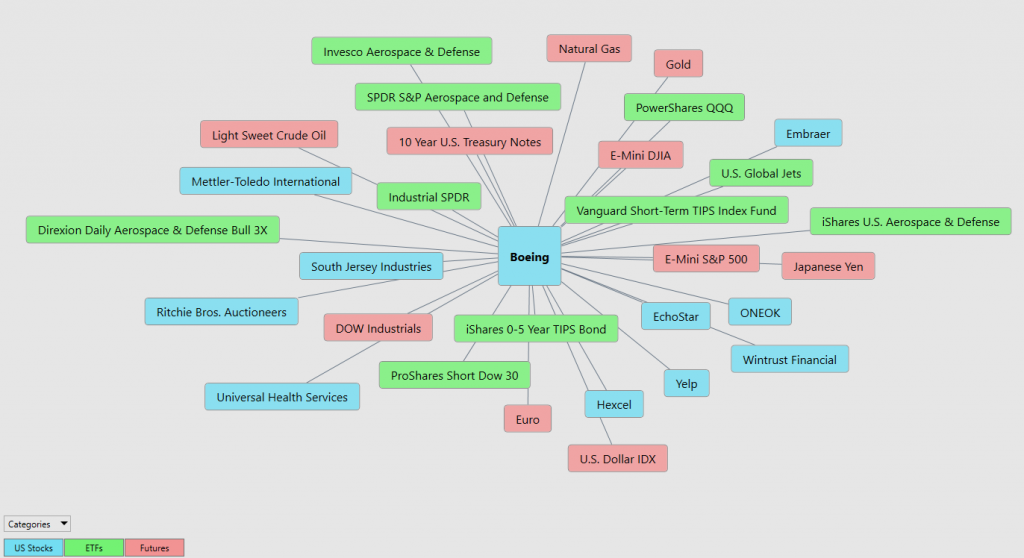
There is immense value to be had in studying and understanding the key drivers of $BA price action. This graphic presents a plethora of opportunities that can quickly be explored within the software.
This is an amazing research tool that consistently uncovers future gems.
Our Suggestion
$BA will report Q4 results on January 25, 2023, and we expect the financials will be important drivers of the stock price for the rest of the year.
In 2021, the company generated $62.29 billion in revenue which represented an increase of 7.1% over the previous year. However, losses continued to mount as the company reported net losses of $4.20 billion.
The good financial news is that the company is increasing orders for its 737 MAX. Earnings growth is an important consideration for investors as it helps gauge future performance potential. Dividend yields are scrutinized for clues about how well a company’s management is deploying capital – dividends can indicate whether money is being reinvested into the business or given back to shareholders. Additionally, debt levels are critical in providing insight into how leveraged a company is. Lastly, returns on equity give a sense of how profitable a stock has been in comparison to its peers and industry benchmarks. Collectively, these indicators provide traders with crucial information necessary to evaluate stocks like Boeing ($BA) accurately.
At the present time $BA is almost fairly valued. The trends are mildly favorable for 2023. We look to buy sharp pullbacks using the a.i. as our guidance and decision-making system. The volatility will continue in $BA for many years to come.
As long as the a.i. forecast remains UP you could look for opportunities to scale in small positions with tight stop losses.
Let’s Be Careful Out There!
It’s Not Magic.
It’s Machine Learning.

IMPORTANT NOTICE!
THERE IS SUBSTANTIAL RISK OF LOSS ASSOCIATED WITH TRADING. ONLY RISK CAPITAL SHOULD BE USED TO TRADE. TRADING STOCKS, FUTURES, OPTIONS, FOREX, AND ETFs IS NOT SUITABLE FOR EVERYONE.
DISCLAIMER: STOCKS, FUTURES, OPTIONS, ETFs AND CURRENCY TRADING ALL HAVE LARGE POTENTIAL REWARDS, BUT THEY ALSO HAVE LARGE POTENTIAL RISK. YOU MUST BE AWARE OF THE RISKS AND BE WILLING TO ACCEPT THEM IN ORDER TO INVEST IN THESE MARKETS. DON’T TRADE WITH MONEY YOU CAN’T AFFORD TO LOSE. THIS ARTICLE AND WEBSITE IS NEITHER A SOLICITATION NOR AN OFFER TO BUY/SELL FUTURES, OPTIONS, STOCKS, OR CURRENCIES. NO REPRESENTATION IS BEING MADE THAT ANY ACCOUNT WILL OR IS LIKELY TO ACHIEVE PROFITS OR LOSSES SIMILAR TO THOSE DISCUSSED ON THIS ARTICLE OR WEBSITE. THE PAST PERFORMANCE OF ANY TRADING SYSTEM OR METHODOLOGY IS NOT NECESSARILY INDICATIVE OF FUTURE RESULTS. CFTC RULE 4.41 – HYPOTHETICAL OR SIMULATED PERFORMANCE RESULTS HAVE CERTAIN LIMITATIONS. UNLIKE AN ACTUAL PERFORMANCE RECORD, SIMULATED RESULTS DO NOT REPRESENT ACTUAL TRADING. ALSO, SINCE THE TRADES HAVE NOT BEEN EXECUTED, THE RESULTS MAY HAVE UNDER-OR-OVER COMPENSATED FOR THE IMPACT, IF ANY, OF CERTAIN MARKET FACTORS, SUCH AS LACK OF LIQUIDITY. SIMULATED TRADING PROGRAMS IN GENERAL ARE ALSO SUBJECT TO THE FACT THAT THEY ARE DESIGNED WITH THE BENEFIT OF HINDSIGHT. NO REPRESENTATION IS BEING MADE THAT ANY ACCOUNT WILL OR IS LIKELY TO ACHIEVE PROFIT OR LOSSES SIMILAR TO THOSE SHOWN.

