
![]()
Broadcom ($AVGO) is a global leader in semiconductor design and development, providing connectivity solutions to the networking and telecommunications industries. Founded in 1991 by Henry Samueli and Henry Nicholas III, Broadcom currently employs over 25,000 people in offices around the world, with its headquarters located in San Jose, California. Broadcom generates revenue through the design and sale of chipsets for internet infrastructure, mobile platforms, data centers, wireless products, and digital media streaming. Additionally, they earn profits via licensing agreements with companies such as Samsung and Alcatel-Lucent. $AVGO has a market cap of $242 billion.
Broadcom’s main competitors are Intel, Qualcomm, and Texas Instruments. Intel is a household name when it comes to processors and has traditionally been one of the largest players in the semiconductor market space. Qualcomm stands out for its mobile chipsets used in phones and tablets. Qualcomm also led with 5G technology, solidifying their spot as a top global chipmaker. Finally, Texas Instruments provides components to diverse industries from healthcare and automotive to consumer technology. With these big names offering stiff competition, Broadcom has had to make sure they stay on top with innovative products and pricing strategy that make their solutions appealing.
One of their biggest challenges facing $AVGO is staying ahead of the competition as new companies enter the market. They must also ensure their products comply with global standards and regulations, develop innovative products that boost their bottom line, and continually provide superior customer service and consumer experiences. Additionally, Broadcom must navigate increasingly complex supply chains and reduce component availability to remain cost-efficient. Meeting all these goals in an increasingly competitive landscape is an ongoing challenge that makes Broadcom’s success impressive and remarkable.
$AVGO had an incredible 4th Quarter in 2022 which is making analysts and traders think the worst from the supply chain breakdowns are behind them.
Earnings are forecasted to grow 7.62% over the next year.
Earnings grew by 74% over the past year.
$AVGO also pays a reliable 2.9% dividend which has great appeal to the risk averse.
The company does have a high level of debt and recently over the past few months there has been some insider selling. It is currently trading at 21.6 times earnings which is amongst the highest P/E ratio in the semiconductor niche. But earnings and sales are strong. In the 3rd Quarter $AVGO reported a 40% increase in earnings per share and a 25% increase in revenue at $8.46 billion.
In this weekly stock study, we will look at and analyze the following indicators and metrics which are our guidelines to dictate our behavior regarding any stock analysis.
- Wall Street Analysts’ Estimates
- 52-week high and low boundaries
- Vantagepoint A.I. Predictive Blue Line
- The Best Case – Worst Case Scenarios
- Neural Network Forecast
- Daily Range Forecast
- Intermarket Analysis
- Our trading suggestion
We don’t base decisions on things like earnings or fundamental cash flow valuations. However, we do look at them to better understand the financial landscape that a company is operating under.
Wall Street Analysts’ Estimates
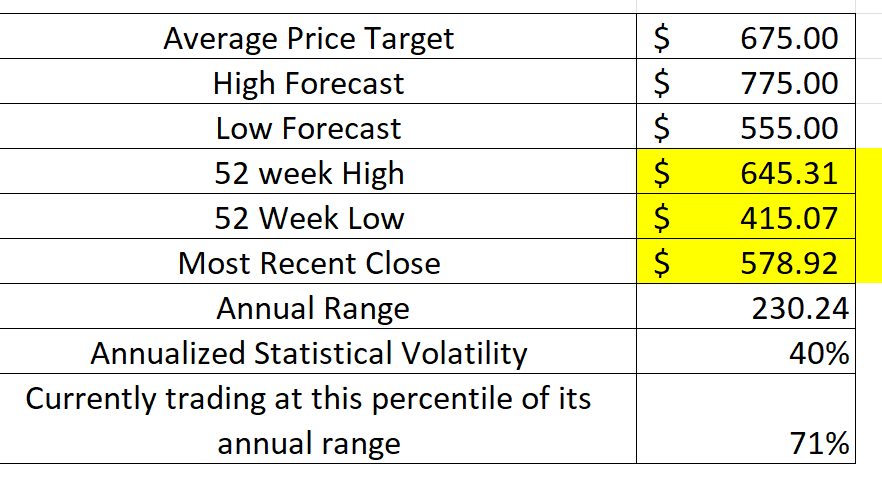
The 19 analysts offering 12-month price forecasts for Broadcom Inc have a median target of 675.00, with a high estimate of 775.00 and a low estimate of 555.00. The median estimate represents a +16.56% increase from the last price of 579.10.
We see that the company is undervalued and coming off a few bad quarters caused by the pandemic and economic lockdown.
Whenever we see Wall Street estimates this divergent in their opinion it is a sign that we should expect increased volatility in the asset. We love to see this heavily divergent opinion as it tells us that volatility is baked into the mix.
52-Week High and Low Boundaries
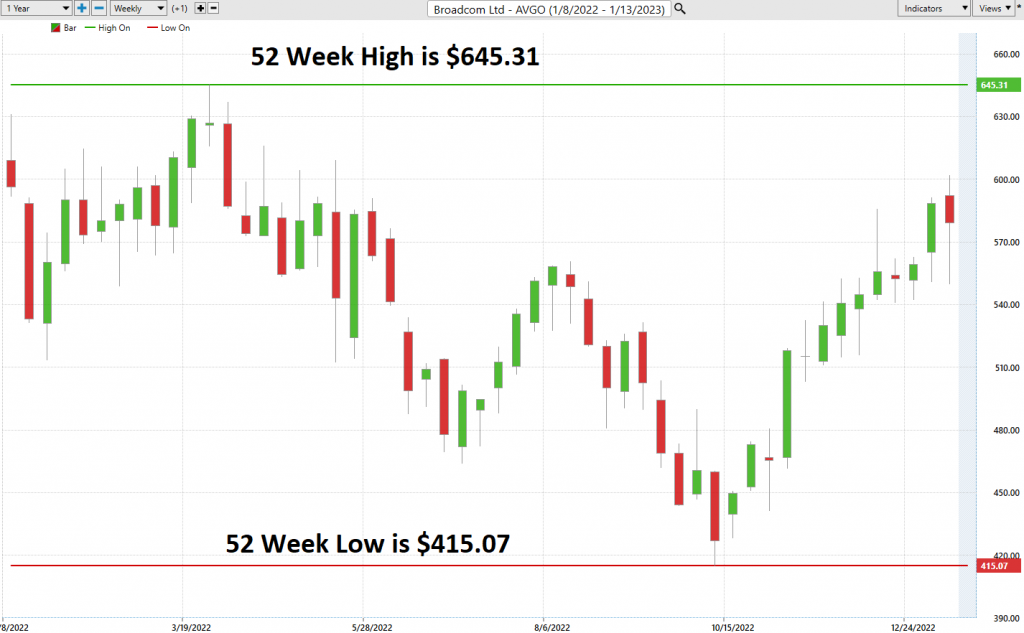
Over the past year we have seen $$AVGO trade as low as $415.07 and as high as $645.31. This tells us that the annual trading range is $230.24.
We also like to divide the annual trading range of $230.24 by the current price of $578.92 to get a broad-based estimate of trading volatility. This tells us that the volatility of $$AVGO over the past year has been 40%. This value also provides us with a basic estimate in letting us know that if the future is like the recent past, it would be normal for $$AVGO to trade in a range that is 40% higher and lower than the current price over the next year.
Here is the annual 52-week chart of $$AVGO so that you can see the powerful price journey it has taken over the last few months.
The 52-week low price boundary is a significant level that professional traders pay close attention to for a few reasons. First, it helps them to defining what is “fair value” for a given security. Second, it can be useful in defining what is “cheap” – i.e. when a security is trading significantly below its analyst estimates, it may be an attractive buying opportunity. Finally, professional traders will often look for bottoming price action near the 52-week low boundary – this can be a helpful indication that the security is about to begin a new uptrend. As such, the 52-week low boundary is a key level that professional traders use in their analysis.
Usually, when a stock makes a 52 week low it is a very negative indication. When the negative momentum continues and the stocks makes a lower 52 week low it also is a negative bellweather. However, when the low price level is tested numerous times and holds, it is important to pay attention as you will often see tremendous price rallies based simply upon the bottoming price action. This is what has occurred in $AVGO as it has rallied 43.59% off its 52 week lows in the last 60 trading sessions.
Power Traders will compare the Wall Street Analysts estimates with these broad volatility estimates to get a broad sense of price action in $$AVGO.
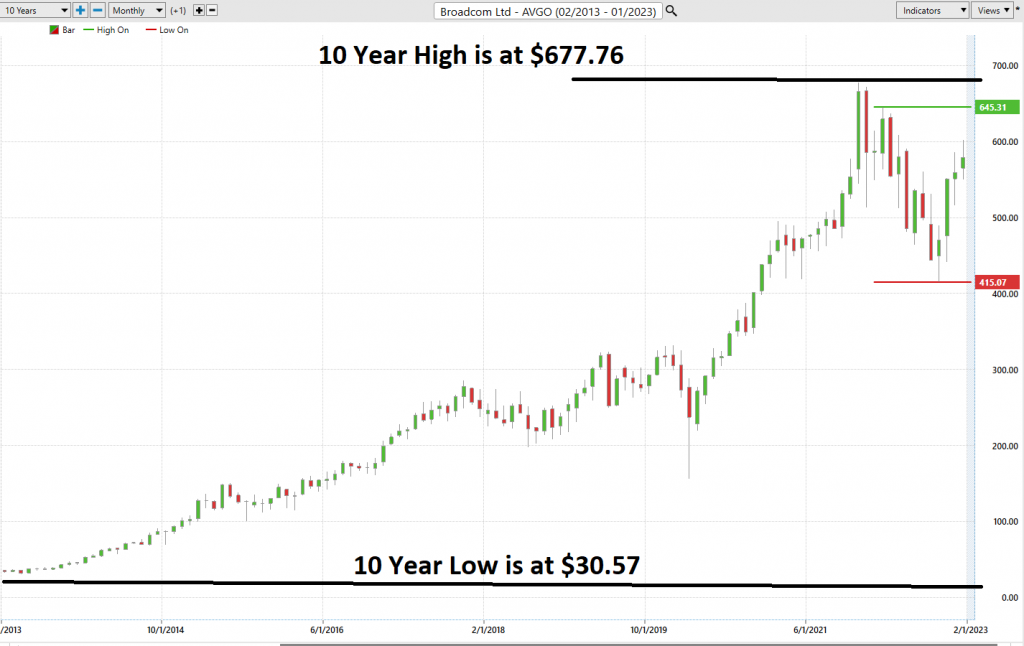
What is also very constructive is to look and examine the longer term 10 year monthly chart for $AVGO. This chart looks like the long term bull trend is returning in spades. Since $AVGO is one of the chief players in the semiconductor space this is very positive for the tech sector as a whole and it has created a tremendous amount of enthusiasm.
Best Case – Worst Case Scenario $AVGO
Whenever we look at a trade or long-term investment opportunity to really understand what we are dealing with we need to compare the best rallied to the worst declines to understand the assets real time volatility and then compare the performance of the asset we are considering with the returns of the major market indexes.
Statistical annualized volatility is a measure of the level of fluctuation in the stock’s price over time. It represents the estimated standard deviation found in price movements during normal market trading. Quantitatively speaking, the longer the time period used to calculate its average, the more accurate and realistic it becomes in predicting future performance. Instead of just making this a number, we prefer to look at the charts from a best-case analysis and worst-case analysis. This allows us to get a real assessment of what this volatility means in terms of potential performance.
Great trading is always about being very aware of the potential volatility of an asset. As traders we look for MOTION. But motion is a two-edged sword and by initially looking at rallies and declines we can quickly determine whether an asset is holding on to gains or not. Keep in mind that $AVGO has an annualized volatility of 40%. This means that “NORMAL” is defined that the stock could be 40% higher or lower over the coming 12 months.
Here is the BEST-CASE analysis.
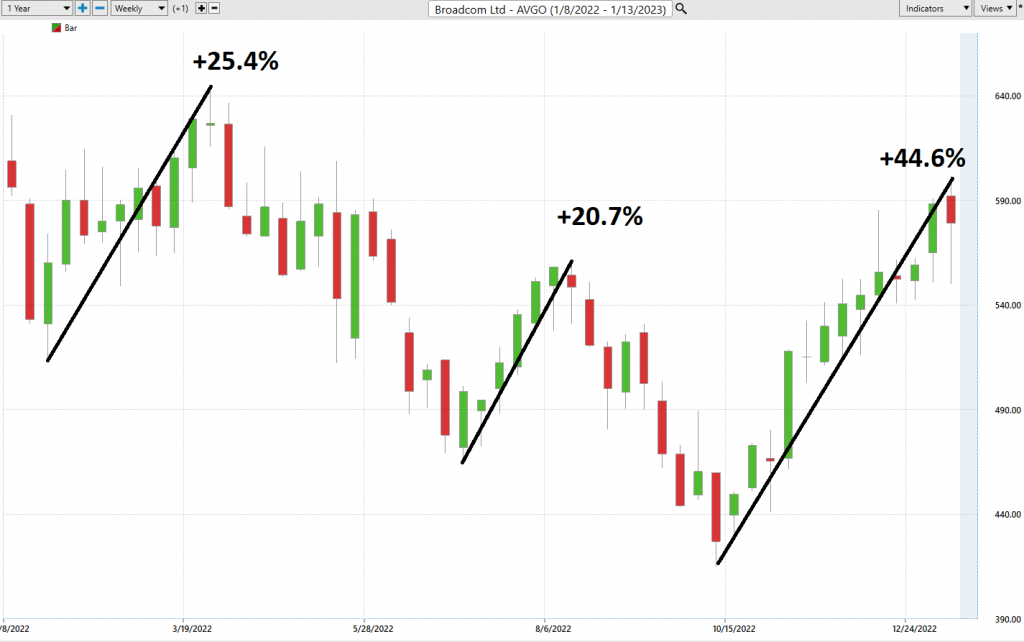
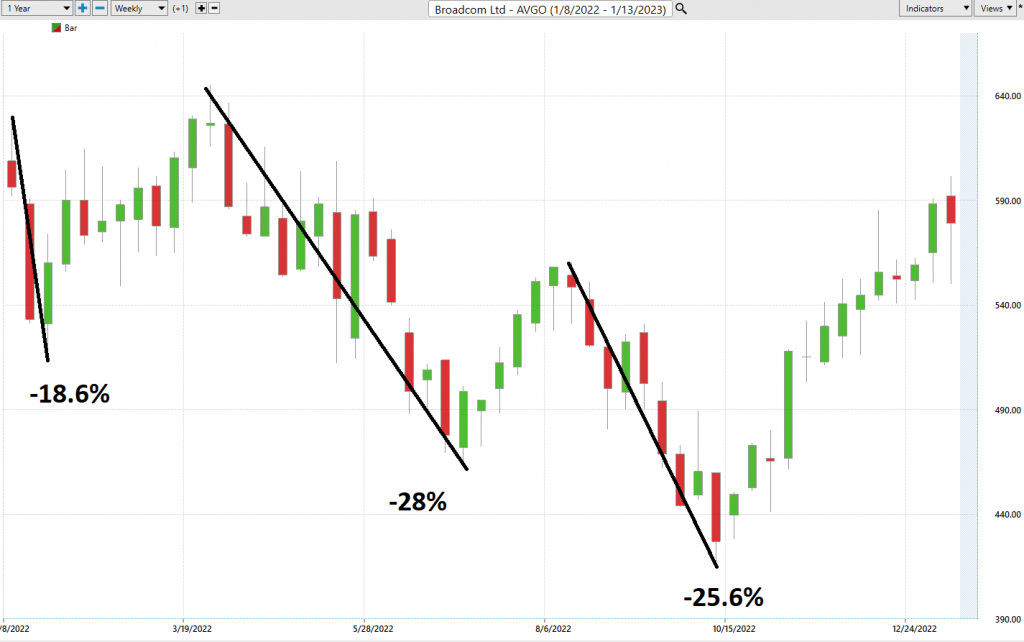
Followed by the WORST-CASE Analysis:
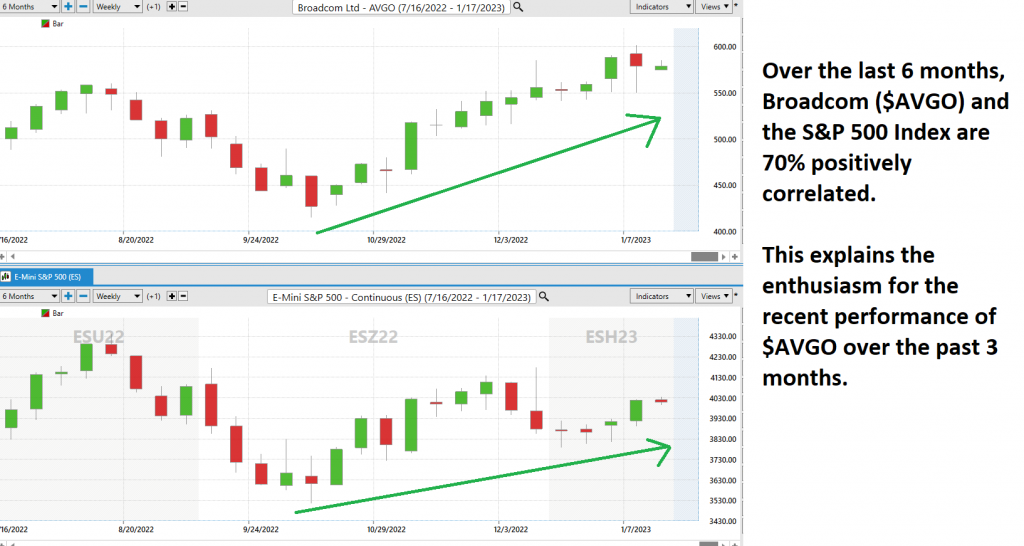
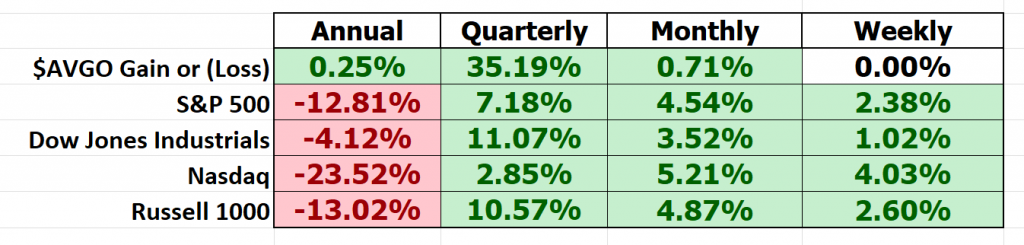
Next, we compare the performance of $AVGO to the broader major stock market indexes.
So, we can understand the enthusiasm associated with $AVGO’s rallies as it led the market lower, and Wall Street is hoping that this large cap will also bring the tech sector positive.
When we drill down a little deeper, we compare $AVGO to the other top semiconductor stocks. We can quickly see that the entire sector has rebounded very nicely. Since the lockdown that occurred in 2020 adversely affected the semiconductor sector, this rebound is a sign that the worst may be behind us.
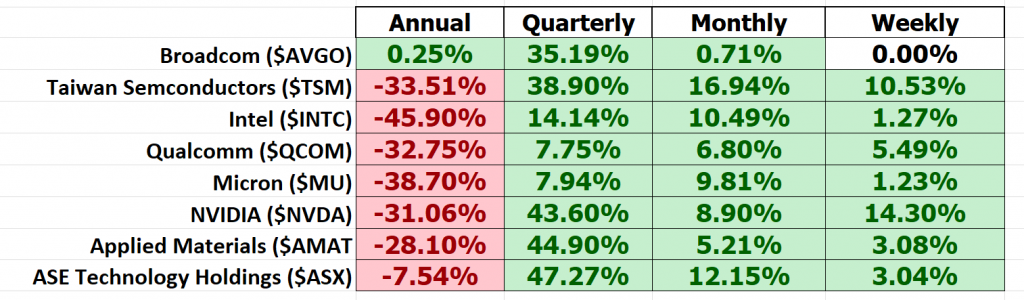
While other companies have done well on the weekly, monthly, and quarterly time frames, $AVGO has turned positive across all time frames. In other words, they are the leader of the pack.
Vantagepoint A.I. Forecast Predictive Blue Line
Let’s do some basic trend forecasting analysis based upon looking at the VantagePoint predictive blue line over the last year. On the following chart you will see the power of the VantagePoint Predictive blue line which determines the medium term trend price forecast.
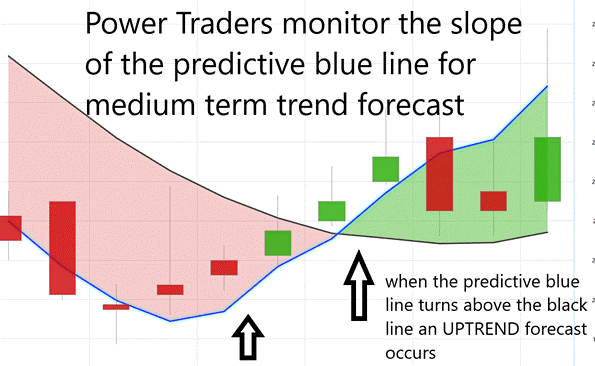
The guidelines we abide by are as follows:
- The slope of the predictive blue line determines the trend and general direction of $AVGO
- When the blue line turns above the black line an UP opportunity occurs
- When the blue line turns below the black line a DOWN opportunity occurs
- Ideally, the VALUE ZONE is determined to try and buy the asset at or below the predictive blue line
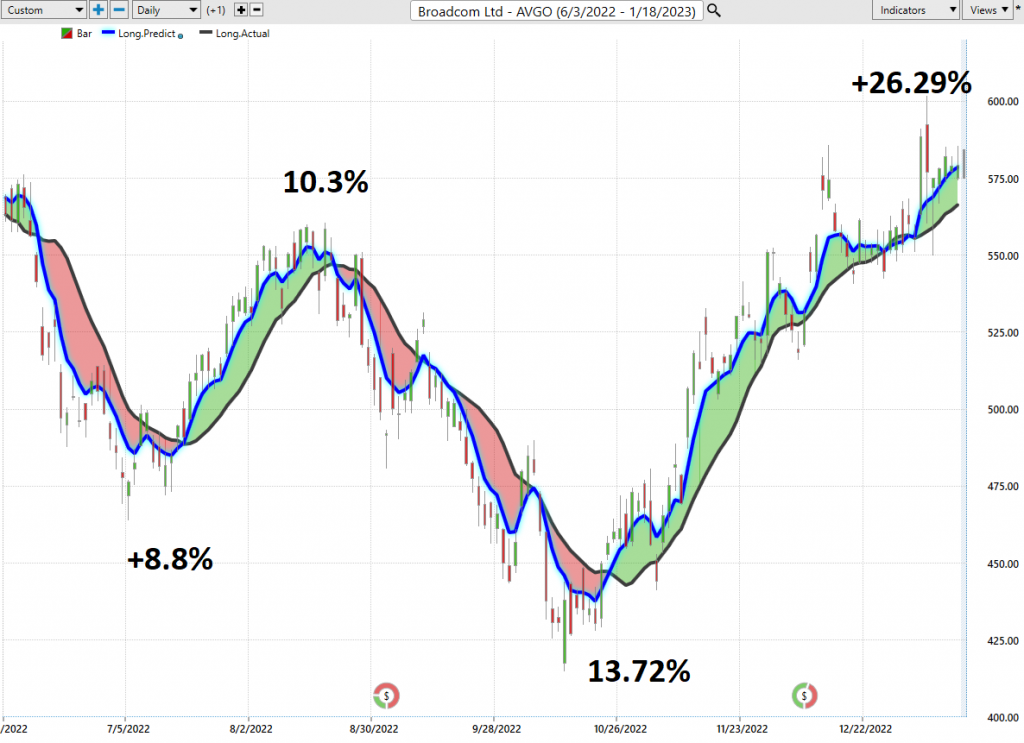
Over the last 8 months there have been 4 trading opportunities. All 4 have been winners.
Trade #1 generated 8.8% in 25 sessions.
Trade #2 generated 10.3% in 25 sessions.
Trade #3 generated 14% in 45 sessions.
Trade #4 is currently open and UP 26.2% in 58 sessions.
Average trade was 14.7% gain in 38 trading sessions.
This is the power and effectiveness of the Vantagepoint A.I. forecast in assisting traders to stay on the right side of the trend at the right time.
The predictive blue line is the initial indicator which Power Traders use to monitor and navigate the trend.
Next traders cross-reference this signal with the historical pattern recognition available with machine learning and the Neural Index.
Neural Network Indicator (Machine Learning)
At the bottom of the chart is the Neural Network Indicator which predicts future short-term strength and/or weakness in the market. When the Neural Net Indicator is green it communicates strength. When the Neural Net is red it forecasts short-term weakness in the market.
A neural network is a computing system that is modeled after the brain. neural networks are composed of input nodes, output nodes, and hidden nodes. Input nodes receive information from the outside world, while output nodes send information to the outside world. Hidden nodes are neither input nor output nodes; rather, they process information internally. neural networks learn by adjusting the weights of the connections between the nodes. The stronger the connection between two nodes, the more influential that connection is. Neural networks can be used for a variety of tasks, including pattern recognition and data classification.
At its essence, a Neural Net is a computational learning system that uses a network of functions to understand and translate massive amounts of data into a desired output, consistently monitoring itself and improving its performance. Neural networks are a type of artificial intelligence that is modeled after the brain. Trading neural networks are used to identify patterns in big data sets, which can then be used to make predictions about future market movements. Traders use neural networks because they are able to perform complex statistical and probability analysis on historical data, as well as multi-variable analysis on current market conditions. This allows them to generate trading signals with a high degree of accuracy. Neural networks have proven to be a valuable tool for traders who are looking to gain an edge in the markets. Neural networks are a type of artificial intelligence that can be employed in trading to simulate the decision-making process and help traders discover profitable trades. Traders use neural networks to analyze and interpret complex data, which can help identify patterns that may otherwise go undetected. Neural networks also provide an extra layer of accuracy for forecasting trades, allowing traders to learn from past successes and mistakes. Using neural networks to trade can give traders an edge over their competition – allowing them to make better decisions while saving time and ultimately improving their bottom line.
Whenever Power Traders are looking for statistically valid trading setups, they look for a DOUBLE confirmation signal. This signal occurs whenever the blue predictive line and the Neural Net at the bottom of the chart suggest the same future expected outcome.
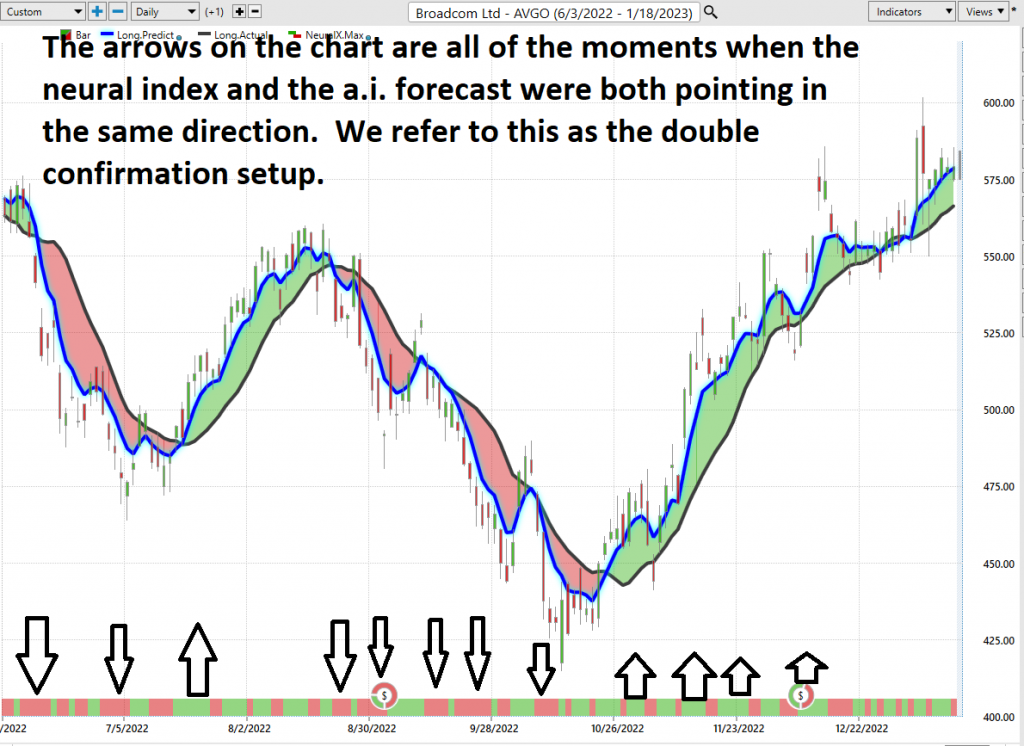
We advocate that Power Traders cross-reference the chart with the predictive blue line and neural network indicator to create optimal entry and exit points.
Traders look for confirmation on the Neural Net to position themselves for LONG or SHORT opportunities in the market. In other words, when the A.I. forecast is green, and The Neural Net is green, that presents a buying opportunity.
The inverse is also true, when the A.I. forecast is red and the Neural Net is red, that is a selling opportunity. The arrows on the chart below highlight the trading zones where Power Traders would’ve been using double confirmation to find a buying opportunity in cross-referencing the A.I. forecast with the Neural Net.
Power Traders are always looking to apply both the Neural Network and A.I. to the markets to find statistically sound trading opportunities.
VantagePoint Software Daily Price Range Prediction
One of the powerful features in the VantagePoint Software which Power Traders use daily is the Price Range prediction forecast.
This forecast is what permits Power Traders to truly fine tune their entries and exits into the market.
Every day traders are faced with the anxiety and frustration of wondering where they should be looking for opportunities to buy and sell the market. VantagePoint’s A.I. makes this decision super easy with the Daily Price Range Forecast. This is where the rubber meets the road.
Many factors can affect the daily price range of stocks, from global political events to the weather. As a result, forecasting the daily price range is a complex task that requires careful analysis. There are several methods that can be used to forecast daily price ranges, including technical analysis, fundamental analysis, and news-based analysis. Technical analysis involves studying past price movements to identify patterns that may provide clues about future price behavior. Fundamental analysis focuses on economic indicators such as company earnings and interest rates. News-based analysis involves tracking breaking news stories that could have an impact on the stock market. Vantagepoint A.I. uses a proprietary algorithm that combines the power of a.i., neural networks and machine learning to provide a daily price range forecast. By using a combination of these methods, it is possible to develop a more accurate forecast of the daily stock market price range.
Analyzing stock prices on a daily basis is an important task for investors of all kinds who are interested in attaining steady gains. Whether an individual or a larger institution, being aware of the factors which may cause daily fluctuations is key to accurately forecasting future trends. Vantagepoint specifically analyzes and tracks patterns through observations over time. By monitoring these elements and anticipating potential influences, it is possible to make informed and statistically sound decisions when investing in the stock market.
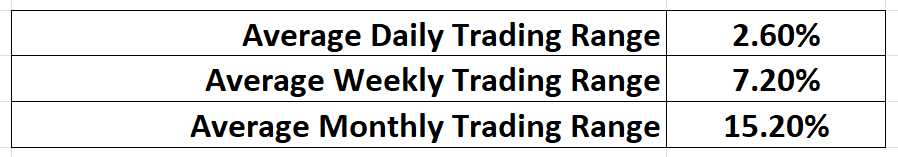
Historically speaking this is what last year’s average trading ranges on the daily, weekly, and monthly time frames look like.
Here is the price chart of $AVGO during the most recent uptrend. The software very clearly delineates the daily forecast by providing an exact lower and upper boundary and specifies the short-term trend.
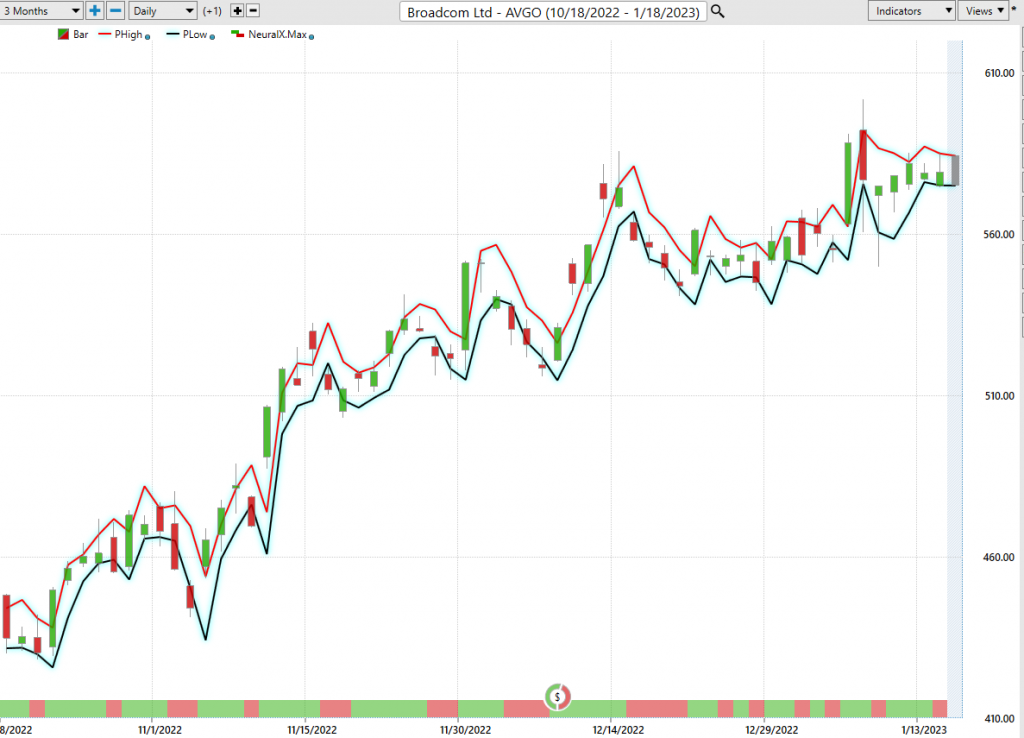
This chart helps traders decide where stop placement should occur. Observe how placing protective sell stops below the dark line on the chart was a powerful way to minimize risk on this trade.
See how the upper and lower bands of the price range forecast for a clear channel of trading activity as well. Swing traders are always looking for opportunities to buy towards the bottom of the predicted channel and selling opportunities above the top band.
Intermarket Analysis
Power lies in the way we respond to the truth we understand.
$AVGO is 70% correlated to the S&P 500 Index.
That is a powerful fact that traders use effectively in their decision-making process.
For example, tech stocks consist of 20% of the Dow Jones Industrial Average.
Approximately one-fourth or 25% of the S&P 500 Index is composed of tech stocks such as Apple, Microsoft, Facebook, and Amazon. This heavy reliance on technology gives the index a dynamic advantage, as tech stocks are often more volatile than other industries and can cause dramatic swings in the stock market. While this can be concerning to some investors, it can also prove beneficial if done strategically and with research. For those looking for greater risk but higher potential rewards, investing in technology stocks could provide a greater return on their investments.
One of the supremely important questions in trading is what is driving the price? Headlines often create interesting narratives. But these “stories” only capture the imagination. Traders want and need to understand the cause and effect of price movement.
The only way to get an answer to this important question is through Intermarket analysis which looks at statistical price correlations of assets.
The following graphic shows you the top 31 drivers of $AVGO’s price action.
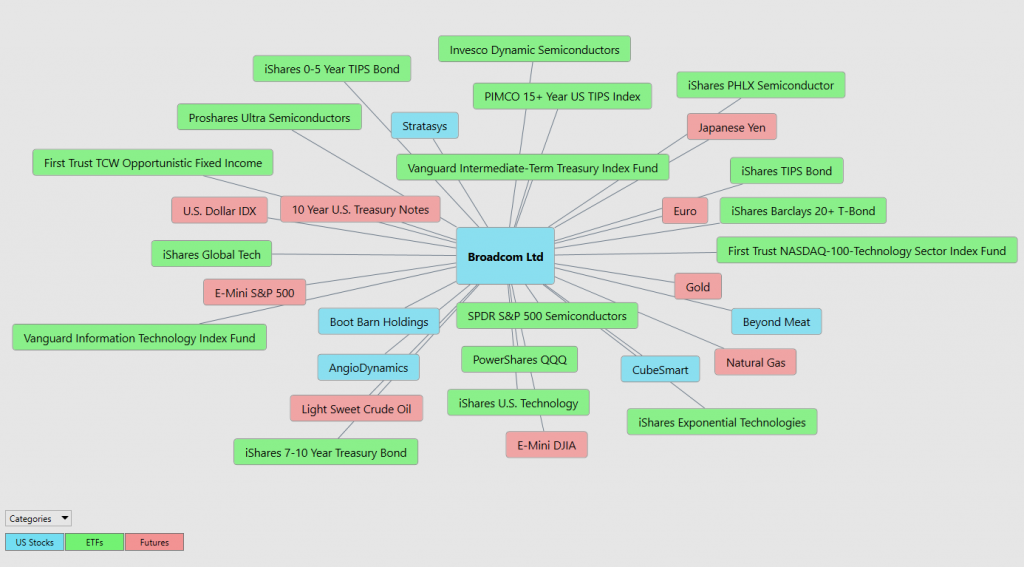
So, a study of the relationship(s) will prove to be beneficial to a trader.
Intermarket analysis is often used by traders to gain insight into the relationships between different asset classes and markets. Three of the most notable leaders in using intermarket analysis in trading financial markets are John Murphy, Martin Pring and Lou Mendelsohn. Murphy wrote “Intermarket Technical Analysis” which is considered by many to be the definitive guide on this subject, including techniques such as correlation studies and divergence interpretations. He especially emphasized stock indexes, commodities, bonds, and currencies as important pieces of investment market data. Pring has written several books on the subject, including “Intermarket Analysis: Profiting from Global Market Relationships”, in which he explains how equity or commodity trends can be explained when looking at correlating movements in different markets like bonds and stock indexes. Lou Mendelsohn is the founder of Vantagepoint Software and the pioneer in delivering a powerful means to quantify and qualify Intermarket relationships for traders.
We live in a global marketplace.
Everything is interconnected.
Interest rates, Crude Oil Prices, and the volatility of the Dollar amongst thousands of other variables affect the decisions companies must make to flourish and prosper in these challenging times. Trying to determine what these factors are is one of the huge problems facing investors and traders.
You always have a choice. You can tune in to the talking heads in the media who spin talking points which promote fear. Or you can rely on facts to base your decision-making on.
Our Suggestion
We like the price action in $$AVGO. Our expectation is volatility will increase, and the stock will challenge its 52-week highs.
But we think that as long as the a.i. is signaling an uptrend in $$AVGO that we should use these pullbacks to scale in small tradeable positions. The 10-year monthly chart of $AVGO looks incredibly positive, and we think that it is very realistic to expect $AVGO to challenge its all-time highs should it continue growing revenue and earnings.
The economic lockdown that was implemented in 2020 had a significant effect on the semi-conductor sector of the stock market. Such companies as Intel, AMD, and Qualcomm all experienced downturns in their financials after governments started implementing various restrictions designed to limit the spread of the virus. Revenue for these companies fell short of expectations as consumers adopted conservative spending habits and business operations also faltered in some cases. Market analysts concluded that many semiconductor stocks had already been overvalued by late February which meant they were more susceptible to fluctuations. Furthermore, supply chain disruption led to manufacturers being unable to fulfil orders from customers in time, further impacting on their bottom line.
When the semiconductor sector of the stock market rebounds sharply, it means good news for the economy as a whole. It shows that investors have faith in the market and are willing to invest their funds in what they see as a promising sector. This encourages more investments from other sectors, making the entire economy healthier. It also creates a more competitive atmosphere in the market, which leads to better products and services. As more people benefit from an improved economy with more buying power, businesses benefit by having more customers who can afford their services and increase revenue. In short, when the semiconductor sector has a sharp rebound, it garners positive effects for everybody involved in the broader economy.
$AVGO is the leader in the semiconductor niche.
PUT $AVGO on your radar and allow the a.i. to guide your trading decisions.
We think it is greatly responsible for the rally we have seen in the broader market.

Practice solid money management on all your trades.
We will re-evaluate based upon:
- New Wall Street Analysts’ Estimates
- New 52-week high and low boundaries
- Vantagepoint A.I. Forecast (Predictive Blue Line)
- Neural Network Forecast
- Daily Range Forecast
Let’s Be Careful Out There!
It’s Not Magic.
It’s Machine Learning.

IMPORTANT NOTICE!
THERE IS SUBSTANTIAL RISK OF LOSS ASSOCIATED WITH TRADING. ONLY RISK CAPITAL SHOULD BE USED TO TRADE. TRADING STOCKS, FUTURES, OPTIONS, FOREX, AND ETFs IS NOT SUITABLE FOR EVERYONE.
DISCLAIMER: STOCKS, FUTURES, OPTIONS, ETFs AND CURRENCY TRADING ALL HAVE LARGE POTENTIAL REWARDS, BUT THEY ALSO HAVE LARGE POTENTIAL RISK. YOU MUST BE AWARE OF THE RISKS AND BE WILLING TO ACCEPT THEM IN ORDER TO INVEST IN THESE MARKETS. DON’T TRADE WITH MONEY YOU CAN’T AFFORD TO LOSE. THIS ARTICLE AND WEBSITE IS NEITHER A SOLICITATION NOR AN OFFER TO BUY/SELL FUTURES, OPTIONS, STOCKS, OR CURRENCIES. NO REPRESENTATION IS BEING MADE THAT ANY ACCOUNT WILL OR IS LIKELY TO ACHIEVE PROFITS OR LOSSES SIMILAR TO THOSE DISCUSSED ON THIS ARTICLE OR WEBSITE. THE PAST PERFORMANCE OF ANY TRADING SYSTEM OR METHODOLOGY IS NOT NECESSARILY INDICATIVE OF FUTURE RESULTS. CFTC RULE 4.41 – HYPOTHETICAL OR SIMULATED PERFORMANCE RESULTS HAVE CERTAIN LIMITATIONS. UNLIKE AN ACTUAL PERFORMANCE RECORD, SIMULATED RESULTS DO NOT REPRESENT ACTUAL TRADING. ALSO, SINCE THE TRADES HAVE NOT BEEN EXECUTED, THE RESULTS MAY HAVE UNDER-OR-OVER COMPENSATED FOR THE IMPACT, IF ANY, OF CERTAIN MARKET FACTORS, SUCH AS LACK OF LIQUIDITY. SIMULATED TRADING PROGRAMS IN GENERAL ARE ALSO SUBJECT TO THE FACT THAT THEY ARE DESIGNED WITH THE BENEFIT OF HINDSIGHT. NO REPRESENTATION IS BEING MADE THAT ANY ACCOUNT WILL OR IS LIKELY TO ACHIEVE PROFIT OR LOSSES SIMILAR TO THOSE SHOWN.

