
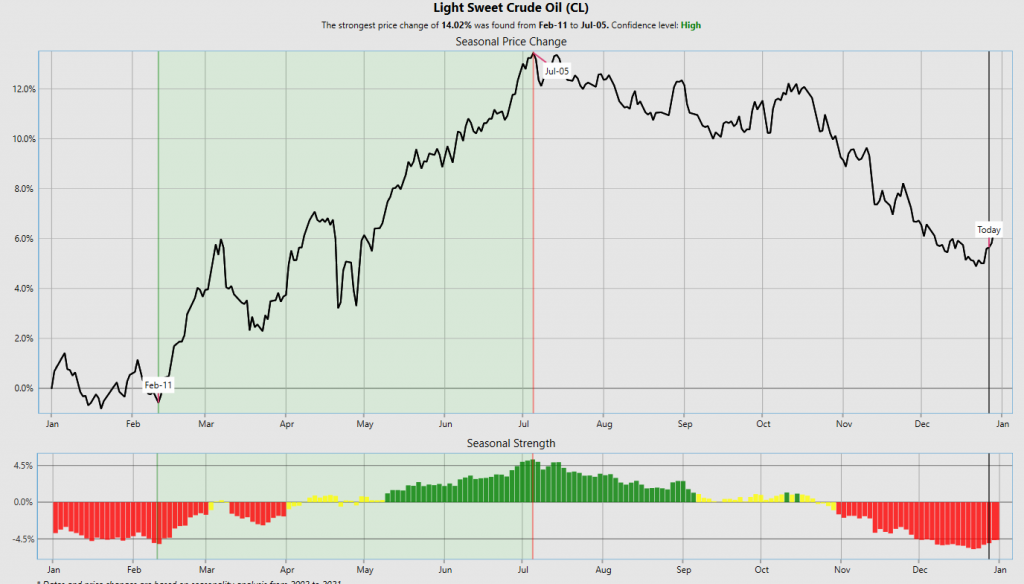
In this Asset Study we are doing a DEP Dive into the Crude Oil Market. As we enter 2023, we are in a seasonal time frame, in the heart of winter when traditionally the Crude Oil market tends to rise. Below is the historical Seasonal tendency chart for Crude Oil which shows that starting in February and continuing until the first week of July, the bias is Crude is UP.
Experienced traders we know never trade based on only one indicator. One of the adages the pro traders we know repeat in our live events is traders need to clearly learn the difference between two words. “IS” and “SHOULD.” Seasonal tendencies clearly are in the SHOULD category. They look at past history and provide a roadmap of what “SHOULD” occur if the current time frame behaves like its historic past.
Seasonal tendencies in trading are patterns of market behavior that occur at a certain time each year due to economic, political, or social influences. The market’s anticipation of events, such as seasonal rushes for goods or services, occurring over a defined period can determine prices and trader activity for that period. Seasonal periods tend to be welcomed by traders as the anticipation of repeating trends makes predicting profits potentially more predictable. However, even with seasonal tendencies, the financial markets are still unpredictable, and caution should be taken when taking advantage of these opportunities. Trading seasonal tendencies in the markets during certain times of the year is one way to make your portfolio grow but careful research needs to be done before jumping on what really seems like a sure thing.

What we find particularly useful when we start studying a seasonal tendency is to cross reference the expectation against what the artificial intelligence, machine learning and neural networks are forecasting at the present time.
Starting with the seasonal tendency you can determine that from January to February the bias is traditionally sideways. However, starting in February the tendency is for prices to rally sharply into the first week of July.
It is from this foundational perspective that we will start our analysis.
When “IS” and “SHOULD” meet, some explosive things can happen in the markets and that is where we want to be as traders. To accomplish this analysis and for it to be effective we need to be guided by what the a.i., machine learning and neural networks are forecasting and be prepared to be nimble and flexible.
We think that the word “SHOULD” is the most expensive word in trading. Our analysis will focus on what the a.i. is informing us that is occurring, and we will cross-reference this information with the upward seasonal bias in the Crude Oil seasonal graphic.
Two powerful fundamental factors which are supporting higher Crude Oil prices are that China has abandoned many of its covid-19 lockdown and quarantine policies. This should boost energy usage in China. Also, the EU has banned imports of all Russian crude oil and petroleum products, which make up 90% of the block’s current oil imports from the country.
In this weekly stock study, we will look at and analyze the following indicators and metrics as are our guidelines which dictate our behavior in deciding whether to buy, sell, or stand aside on a particular stock.
- U.S. Energy Information Administration Estimates
- Crude Oil Seasonal Tendency Analysis
- 52-week high and low boundaries
- Best Case – Worst Case Analysis and Takeaways
- Vantagepoint A.I. Trip[le Cross Forecast (Predictive Blue Line)
- Neural Network Forecast
- Daily Range Forecast
- Intermarket Analysis
- Our trading suggestion
We don’t base decisions on fundamental analysis. However, we do look at them to better understand the financial landscape that a company is operating under.
Fundamental analysts use a variety of methods to analyze and forecast crude oil prices. These include analyzing the economic and geopolitical landscape, studying supply and demand patterns, evaluating energy industry trends, tracking indicators such as capital flows and inventories, monitoring weather forecasts for temperature and hurricane activity in oil producing regions, and more. By surveying all these data points, fundamentals analysts are better able to glean insights into current scenarios as well as predict what’s to come. The objective is to generate actionable ideas that can help investors capitalize on price changes both up and down. In short, fundamental analysis of crude oil prices helps investors make strategic decisions based on sound data rather than speculation.
Fundamental analysis involves analyzing the underlying factors that can affect the supply and demand for crude oil. This can include economic indicators, political events, and natural disasters.
Here are some specific factors that a fundamental analyst might consider when analyzing and forecasting crude oil prices:
Production levels: Changes in production levels, whether due to new discoveries or changes in production practices, can impact on the supply of crude oil and therefore its price.
Economic growth: Strong economic growth typically leads to increased demand for energy, including crude oil, which can push prices higher. Conversely, weak economic growth can lead to lower demand and lower prices. Fundamental analysts may also consider factors such as inflation, exchange rates, and interest rates, as these can impact the demand for oil and the ability of producers to bring it to market.
Geopolitical risks: Political instability or conflicts in oil-producing regions can disrupt production and lead to price fluctuations. The biggest geopolitical event of 2022 was the war in Ukraine and the decision of Western nations to sanction Russia.
Natural disasters: Natural disasters such as hurricanes or earthquakes can also disrupt production and transportation, leading to price fluctuations.
Inventories: Changes in inventory levels can also impact crude oil prices. If inventories are high, it may indicate a surplus of supply, which could lead to lower prices. Conversely, low inventories may indicate tight supplies and potentially higher prices.
By considering these and other factors, a fundamental analyst will make informed forecasts about crude oil prices. It’s important to note, however, that a fundamental analysts forecast can dramatically vary from their peers based upon how much weighting they give to each individual component of their analysis.
U.S. Energy Information Administration Estimates (EIA)
The mission of the U.S. Energy Information Administration (EIA) is to collect, analyze and disseminate independent and impartial energy information to promote sound policymaking, efficient markets and public understanding of energy and its interaction with the economy and the environment. They strive to inform the public about current trends in energy usage as well as future projections to achieve a secure, reliable, and affordable energy system. The EIA collects data from a variety of sources, including companies, states, federal agencies, universities, and organizations across the world to create accurate forecasts on crude oil production. While it may be difficult to anticipate drastic changes or sudden spikes in prices due to market volatility, their forecasts are considered reliable over long periods since they are based on verified data points over time.
The EIA forecasts that in 2023 Brent crude oil prices will average $95.33 per barrel.
They also have forecasted that West Texas Intermediate Crude will average $87.33 per barrel in 2023.
Simply based on these values we can conclude that Crude Oil is undervalued based upon the U.S. Energy Administrations estimates for the coming year.
52-Week High and Low Boundaries
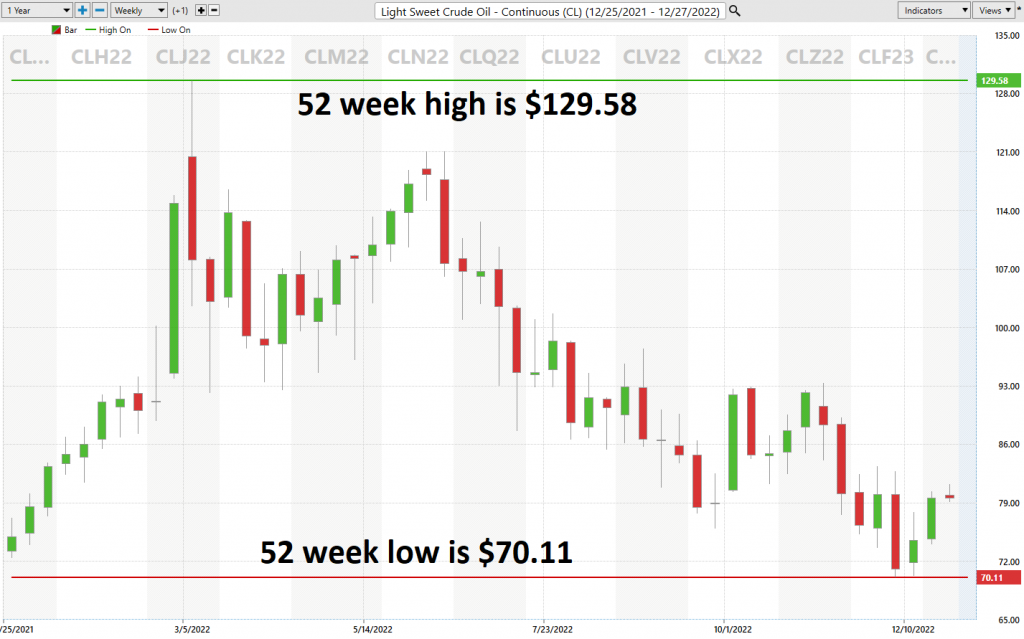
Looking at the Long-Term chart of CRUDE OIL provides us with the 52-week high and low boundaries.
Over the past year we have seen Crude Oil trade as low as $70.11 and as high as $129.58. The annual trading range was $59.47.
Currently, the stock has been trading at its 16th percentile of the last 52 weeks range.
What we would also like to do is to divide the current price by the annual trading range to get a measure of annualized volatility. This metric tells us what we can expect over the next 12 months should it be like the last 12 months. Currently, the annualized volatility in $Crude Oil is 74.8%. What this metric tells us is that if the next 12 months are driven by the exact same factors as the last 12 months, it would be considered normal to see Crude Oil trade as much as 74.8% higher and lower than its current price level.
Equally as important is that being aware of the statistical volatility provides us with a benchmark value that usually hinders rallies and offers support during market declines.
Simply looking at the chart you can see the volatile journey it has been on.
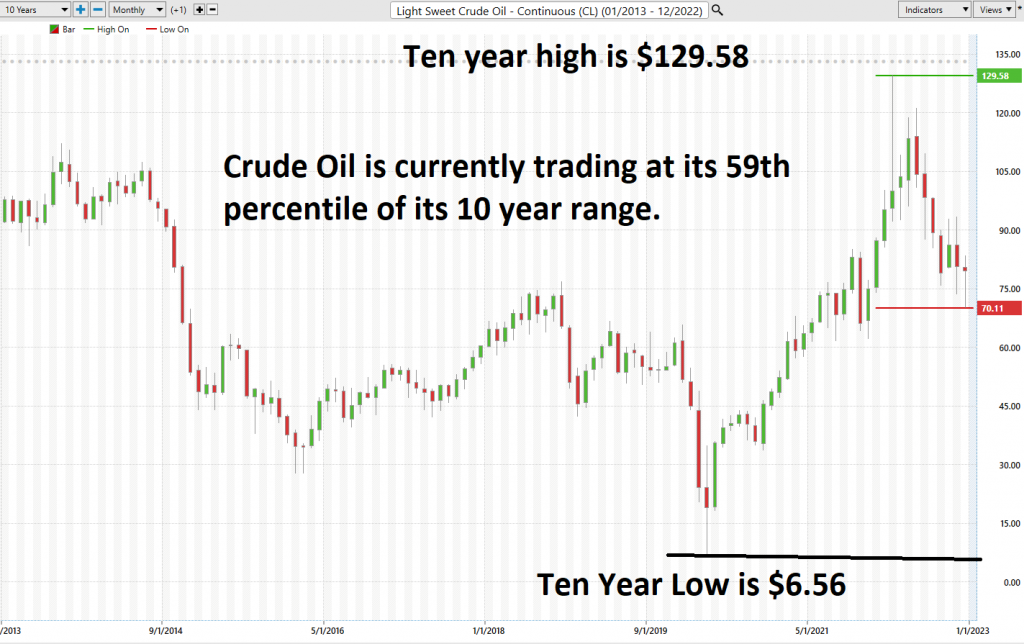
If we look at the longer term 10-year chart we can see that at the present time the 10-year high is the same as the 52-week high. On the 10-year chart Crude Oil is trading at the 59th percentile of its 10-year range.
Our estimate is that the 52-week low is in place and we will see the market consolidate at these levels, however our long-term bias is bullish.
Best Case – Worst Case Scenario
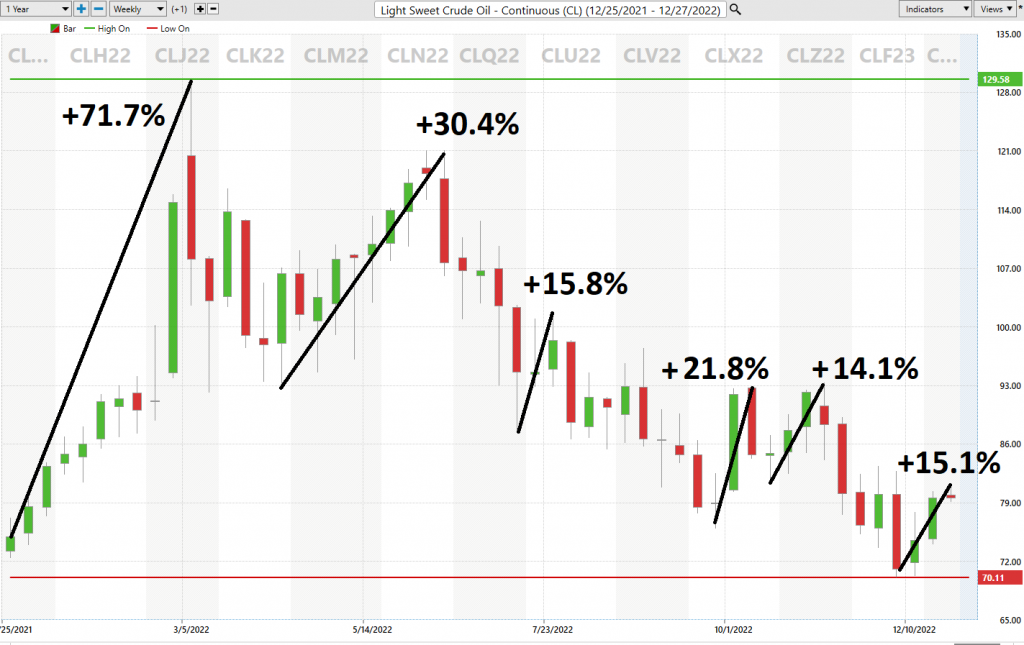
When we study the long-term 52-week chart we can look at the best case and worst-case scenarios just to get an eyeball perspective of the risk and volatility of this asset. This is worth doing anytime you invest or trade to monetarily understand what the potential risks and rewards have been over the past year. All we are looking to analyze is the distance and speed between highs and lows over a given year.
It is worth doing this type of baseline analysis because it allows you to visually ascertain how quickly a stock drops in comparison to the speed with which it moves higher.
First, we do the Best-Case analysis:
Followed by the WORST-CASE Analysis:
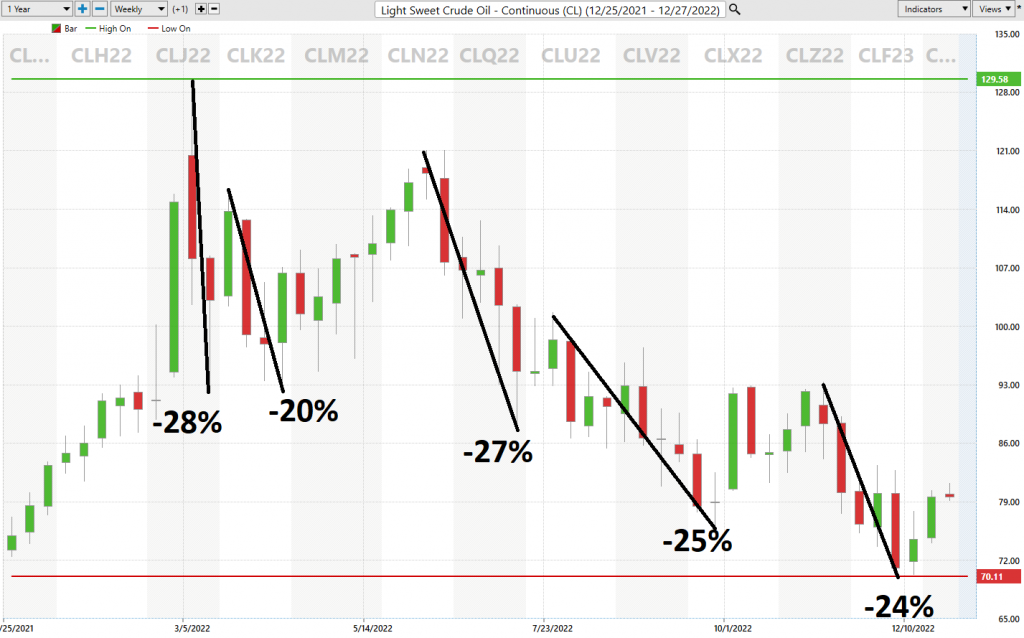
This initial analysis lets us see how quickly Crude Oil falls in comparison to its rallies.
Also note how the statistical volatility which we just reviewed in the previous section capped the rallies and declines over the last year.
Vantagepoint A.I. Forecast (Predictive Blue Line)
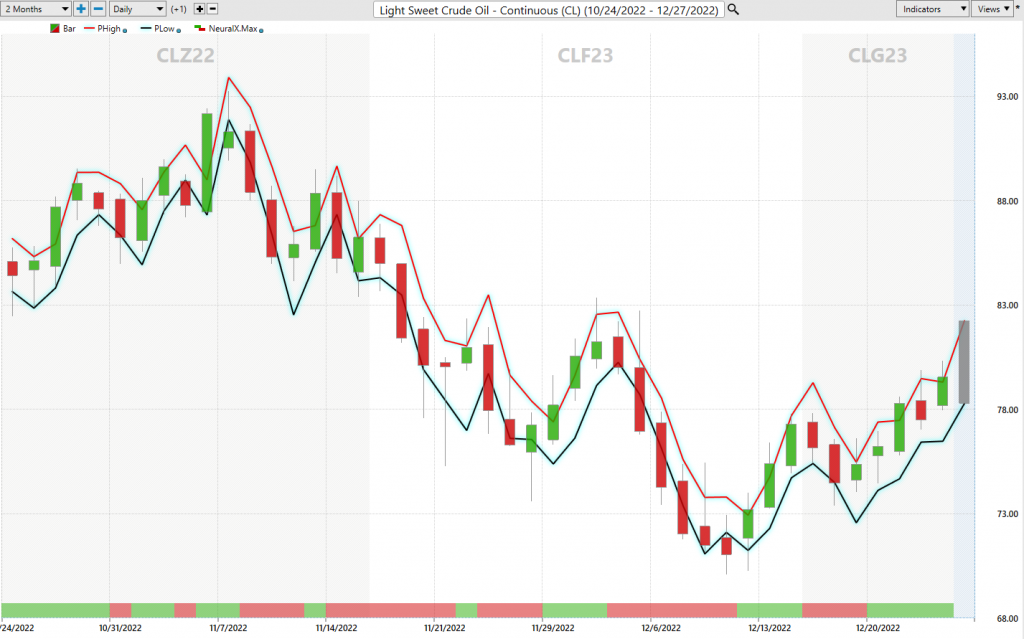
On the following chart you will see the power of the VantagePoint Predictive blue line which determines the medium term trend price forecast.
The guidelines we abide by are as follows:
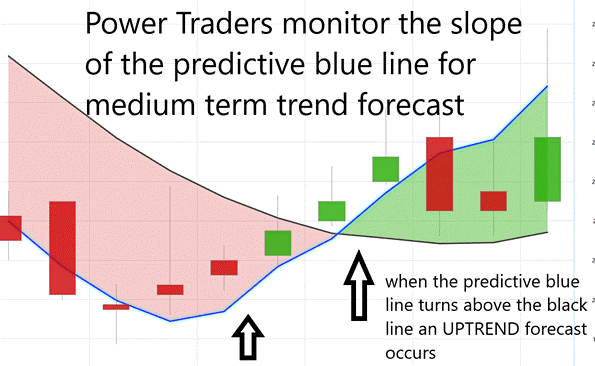
- The slope of the predictive blue line determines the trend forecast and general direction of Crude Oil
- Ideally, the VALUE ZONE is determined to try and find buy opportunities at or below the predictive blue line, or to sell opportunities above the predictive blue line during a downtrend.
Naturally when the predictive blue line slopes lower traders would be anticipating lower prices and either moving to the sidelines or hedging their positions.
Using VantagePoint Software and its artificial intelligence, traders are alerted to trend forecasts by monitoring the slope of the predictive blue line.
The predictive blue line, however, utilizes the VantagePoint-patented Neural Network and Intermarket Analysis to arrive at its value. It looks at the strongest price drivers of an asset through artificial intelligence and statistical correlations to determine its value.
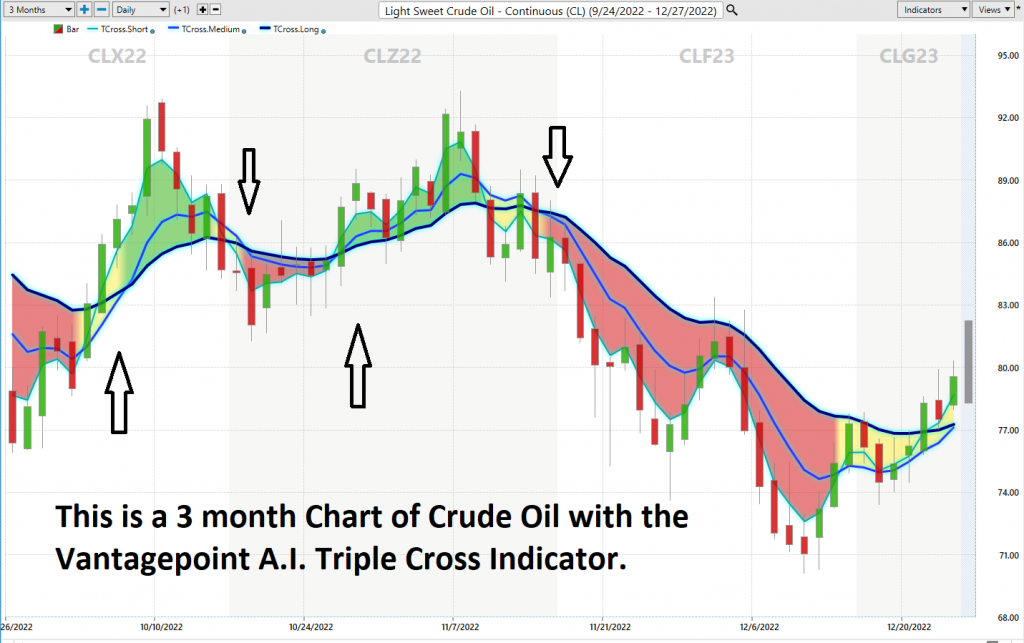
You can quickly understand what artificial intelligence is forecasting by simply looking at the chart. Also, you can observe the duration of each trend forecast was very brief.
Neural Network Indicator (Machine Learning)
At the bottom of the chart is the Neural Network Indicator which predicts future short-term strength and/or weakness in the market. When the Neural Net Indicator is green it communicates strength. When the Neural Net is Red it is forecasting short term weakness in the market. When it is yellow it is anticipating sideways prices.
A Neural Net is a computational learning system that uses a network of functions to understand and translate massive amounts of data into a desired output, consistently monitoring itself and improving its performance. A neural network in trading is a type of artificial intelligence system that uses algorithms to learn patterns in financial markets and make predictions about future market behavior. To establish a neural network, traders must feed historical data into the algorithm so it can recognize predictable trends. Neural networks are then used to analyze large amounts of data quickly so that traders can identify attractive trading opportunities faster than manual analysis. This can give traders a distinct advantage over those not using these systems, as they have access to more precise market insights and opportunities with deeper analysis. Furthermore, neural networks can detect subtle variations in behavior that may be missed by human analysts due to their sheer speed and accuracy in evaluating markets.
Neural Networks are essentially trainable algorithms that emulate aspects of the human brain. This means they can be trained based upon criteria for assessing risk and potential reward to determine the best move forward. This allows them to make high probability forecasts based on available historical information.
We advocate that Power Traders cross reference the chart with the predictive blue line and neural network indicator to create optimal entry and exit points.
For the serious trader, neural networks are a next-generation trading tool that can detect subtle non-linear interdependencies and patterns that traditional methods of technical analysis are unable to uncover.
Traders look for confirmation on Neural Net to position themselves LONG or SHORT in the market. In other words, when the A.I. forecast is green, and The Neural Net is green, that presents a buying opportunity.
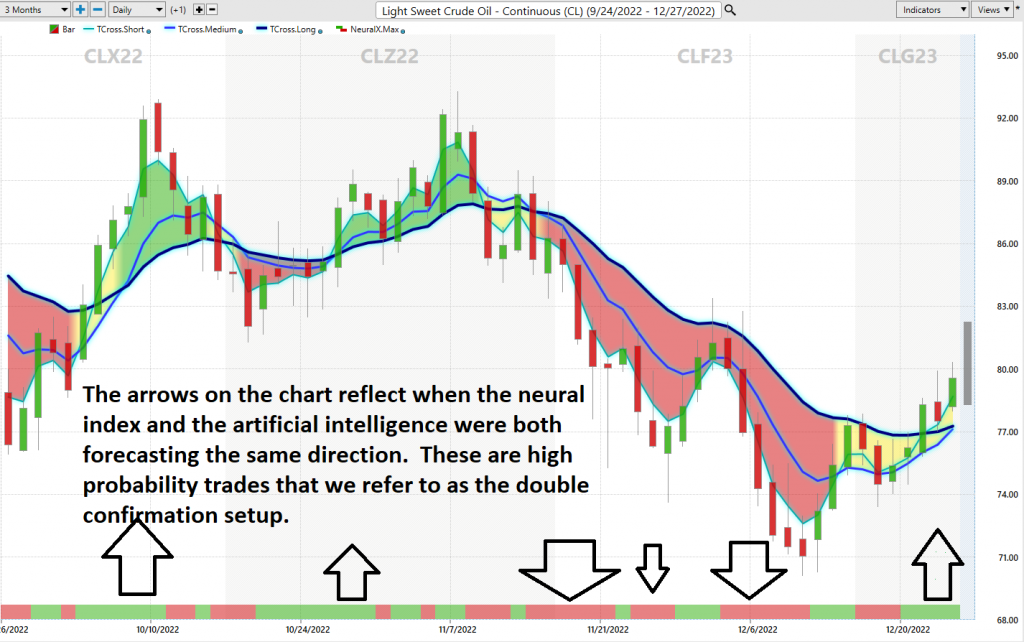
The inverse is also true, when the A.I. forecast is red and the Neural Net is red, that is a selling opportunity. The arrows on the chart below highlight the trading zones where Power Traders could’ve been using double confirmation to find BUYING opportunities in cross-referencing the A.I. forecast with the Neural Net.
The arrows on the chart are the moments when the a.i. and the neural index were both pointing in the same direction.
Power Traders are always looking to apply both the Neural Network and A.I. to the markets to find statistically sound trading opportunities.
VantagePoint Software Daily Price Range Prediction
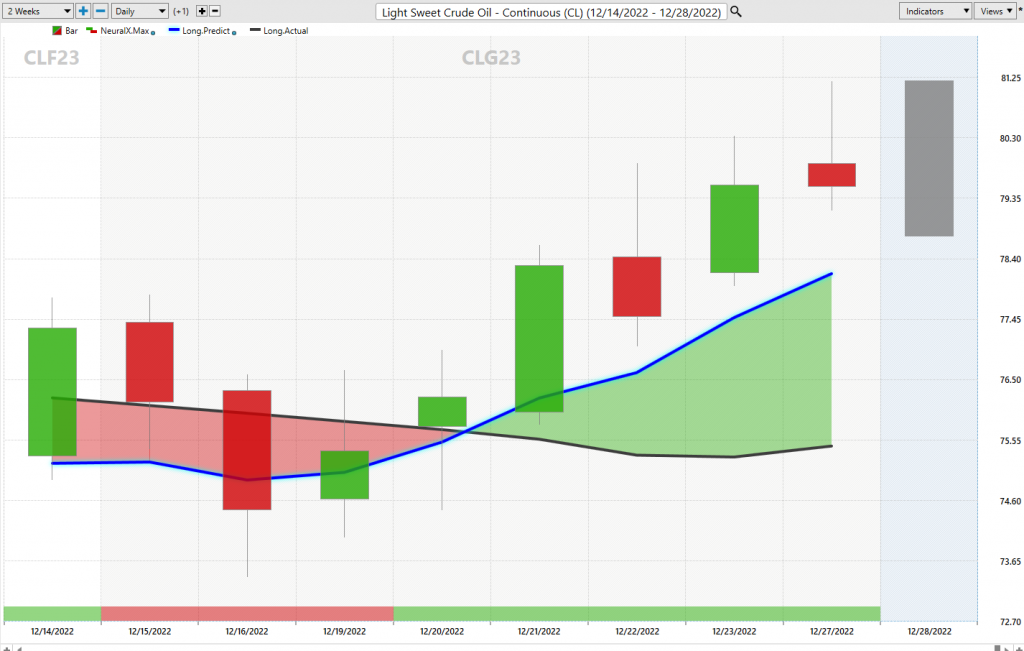
We will zoom in in on the last 2 months of price action so that you can see for yourself how the a.i. and machine learning combine to create a very accurate daily price range forecast that keeps traders focused on optimal trade placement.
One of the powerful features in the VantagePoint Software which Power Traders use daily is the Price Range prediction forecast.
Here are the broad range of trading metrics on Crude Oil over the past year.
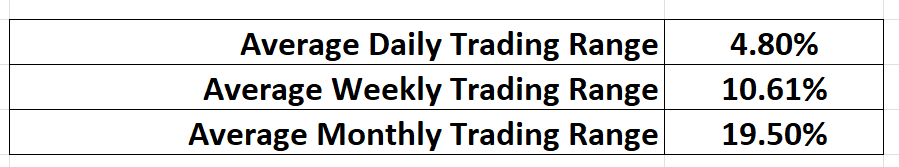
These metrics tell you statistically what has occurred. What traders must always do is determine how to put this knowledge into action.
With volatility comes either huge opportunity or risk.
Volatility, opportunity, and risk are three concepts that are intertwined with one another. Volatility is a measure of the price variation of an asset over time, which can be seen as the potential for gain or loss in the value of a trade. Opportunity, on the other hand, arises when volatility offers traders the chance to take advantage of seemingly profitable divergences.
A market like Crude Oil has an average weekly trading range of 10.6% and a monthly average trading range of 19.5%. We know there is opportunity for profit but first we must manage and understand the risk involved.
The Vantagepoint A.I. daily range forecast is what permits Power Traders to truly fine tune their entries and exits into the market.
Every day traders are faced with the anxiety and frustration of wondering where they should be looking to buy and sell the market. VantagePoint’s A.I. makes this decision super easy with the Daily Price Range Forecast.
This chart helps traders decide where stop placement should occur. Observing how to place protective sell stops below the dark line on the chart was a powerful way to minimize risk on this trade.
See how the upper and lower bands of the price range forecast for a clear channel of trading activity as well. Swing traders are always looking for buying opportunities towards the bottom of the predicted channel and try to find selling opportunities above the top band.
Intermarket Analysis
Power lies in the way we respond to the truth we understand.
One of the supremely important questions in trading is what is driving the price? Headlines often create interesting narratives. But these “stories” only capture the imagination. Traders want and need to understand the cause and effect of price movement.
The only way to get an answer to this important question is through intermarket analysis which looks at the key drivers of an asset and the statistical price correlations of assets.
We live in a global marketplace.
Everything is interconnected.
Analyzing intermarket relationships is a complex process that leaves no stone unturned.
Intermarket analysis is a concept used in trading where relationships between different financial markets are analyzed to detect opportunities. The objective of this analysis slants towards how one specific market affects another, providing an underlying understanding of how various instruments are impacted by shifts in supply and demand. Developed by esteemed economist John Murphy in the 1980s, as well as Vantagepoint A.I. founder, Lou Mendelsohn, intermarket analysis is used by traders to predict movement in markets by considering the correlation between different asset classes, such as bonds and stocks. Traders make decisions based on factors that relate to the overall direction of the market or economy – for example, when looking at commodities, traders include interest rates, currency trends and inflation. Due to its uniqueness and potential practical applications in trading strategies, intermarket analysis has thrived among investors for decades.
Interest rates, Crude Oil Prices, and the volatility of the Dollar amongst thousands of other variables affect the decisions companies must make to flourish and prosper in these particularly challenging times. Trying to determine what these factors are is one of the huge problems facing investors and traders.
You always have a choice. You can tune in to the talking heads in the media who spin talking points which promote fear. Or you can rely on facts to base your decision making on.
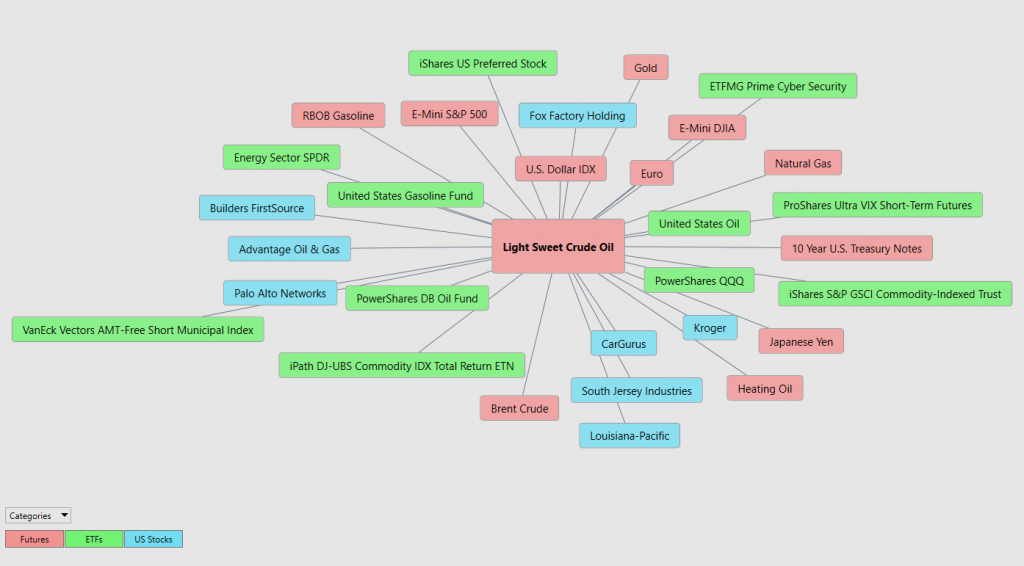
Within the Intermarket Analysis graphic, you will see the 31 markets that are the key drivers of Crude Oil’s price.
There is great value to be had in studying and understanding the key drivers of Crude Oil’s price action.
Trading Suggestion
Energy is needed for any type of production and manufacturing to occur. The challenge today with rising prices is that many analysts and traders are also focusing on energy affordability.
As we enter the heart of the winter season the price bias for Crude Oil is to trade sideways into February and then rise sharply into July.
According to analysts surveyed by Bloomberg news, the expectations are that Crude Oil prices will average $98 a barrel in 2023 and gradually decline from those levels in 2024.
With Light Sweet Crude Oil trading at $79 per barrel as I write these words, we think Crude will present tremendous opportunity in 2023.
Newly implemented European sanctions have had very little impact on the price of Crude so far. Russia has responded to EU sanctions by pursuing selling their Oil to countries like India and China.
In the interim the markets are also looking for support in Crude at the $67 to $72 barrel price level as this is the area where the United States has stated that they will start refilling its strategic petroleum reserve.
So, with the market trading at $79 a barrel we see far less downside risk than upside potential.
We expect over the next 2 months for declines to be very short lived and will look at them as positioning opportunities. Simply, if global demand remains stable as economic activity slows, our expectation is that prices are is a long-term secular bull market and will move higher from current levels.
The trend is UP.
Strong support exists at $75.
Seasonal Tendency is looking positive.
Artificial Intelligence. The forecast is positive.
The Neural Network forecast is positive.
Based upon these realities we will use the daily range forecast to position ourselves on the long side for short-term swing trading opportunities.
Place crude oil on your radar for numerous trading opportunities in 2023.
Our recommendation is to follow the A.I. trend analysis as outlined in this stock study and practice good money management on all trades.
We will re-evaluate daily based upon:
- New EIA Estimates
- New 52-week high and low boundaries
- Vantagepoint A.I. Forecast (Predictive Blue Line)
- Neural Network Forecast
- Daily Range Forecast
The short trend in Crude Oil is UP. We expect the 52-week law to provide long-term support.
Let’s Be Careful Out There!
It’s Not Magic.
It’s Machine Learning.
BOOK YOUR FREE LIVE TRAINING TODAY!
2 TRADING STRATEGIES TO HELP YOU DOMINATE 2023!
CLICK HERE TO REGISTER!
IMPORTANT NOTICE!
THERE IS SUBSTANTIAL RISK OF LOSS ASSOCIATED WITH TRADING. ONLY RISK CAPITAL SHOULD BE USED TO TRADE. TRADING STOCKS, FUTURES, OPTIONS, FOREX, AND ETFs IS NOT SUITABLE FOR EVERYONE.
DISCLAIMER: STOCKS, FUTURES, OPTIONS, ETFs AND CURRENCY TRADING ALL HAVE LARGE POTENTIAL REWARDS, BUT THEY ALSO HAVE LARGE POTENTIAL RISK. YOU MUST BE AWARE OF THE RISKS AND BE WILLING TO ACCEPT THEM IN ORDER TO INVEST IN THESE MARKETS. DON’T TRADE WITH MONEY YOU CAN’T AFFORD TO LOSE. THIS ARTICLE AND WEBSITE IS NEITHER A SOLICITATION NOR AN OFFER TO BUY/SELL FUTURES, OPTIONS, STOCKS, OR CURRENCIES. NO REPRESENTATION IS BEING MADE THAT ANY ACCOUNT WILL OR IS LIKELY TO ACHIEVE PROFITS OR LOSSES SIMILAR TO THOSE DISCUSSED ON THIS ARTICLE OR WEBSITE. THE PAST PERFORMANCE OF ANY TRADING SYSTEM OR METHODOLOGY IS NOT NECESSARILY INDICATIVE OF FUTURE RESULTS. CFTC RULE 4.41 – HYPOTHETICAL OR SIMULATED PERFORMANCE RESULTS HAVE CERTAIN LIMITATIONS. UNLIKE AN ACTUAL PERFORMANCE RECORD, SIMULATED RESULTS DO NOT REPRESENT ACTUAL TRADING. ALSO, SINCE THE TRADES HAVE NOT BEEN EXECUTED, THE RESULTS MAY HAVE UNDER-OR-OVER COMPENSATED FOR THE IMPACT, IF ANY, OF CERTAIN MARKET FACTORS, SUCH AS LACK OF LIQUIDITY. SIMULATED TRADING PROGRAMS IN GENERAL ARE ALSO SUBJECT TO THE FACT THAT THEY ARE DESIGNED WITH THE BENEFIT OF HINDSIGHT. NO REPRESENTATION IS BEING MADE THAT ANY ACCOUNT WILL OR IS LIKELY TO ACHIEVE PROFIT OR LOSSES SIMILAR TO THOSE SHOWN.

