
When I was in school one of the major problems I had as a student was taking things at face value. I often struggled to see things the same way as my teachers and would fixate on ideas that I found troublesome. Now all these years later I sometimes find myself in a similar situation pondering the condition of the financial markets as we enter 2023.
What is most worrisome to me as we enter a new trading year is the performance of the U.S. Treasury market. The U.S. Treasury Bond Market is one of the largest and most liquid markets in the world. Domestically, its estimated size has surpassed $20 trillion and is growing rapidly with its total market risk exposure reaching $30 trillion in 2022. This enormous capital flow includes transactions from hedge funds, pension plans, and other institutional investors as well as households that are seeking a safe portfolio diversification strategy. On an international level, foreigners account for more than a third of all outstanding U.S Treasuries held today – representing an impressive amount of confidence by global markets in the U.S economy. Furthermore, sovereign debt issued by the US Treasury has become a popular benchmark for emerging economies to calculate their own bond yields, a testament to America’s economic position and stability on the global stage.
Here are the performance metrics for the stock market indexes, the U.S. Treasury market and the US. Dollar Index.
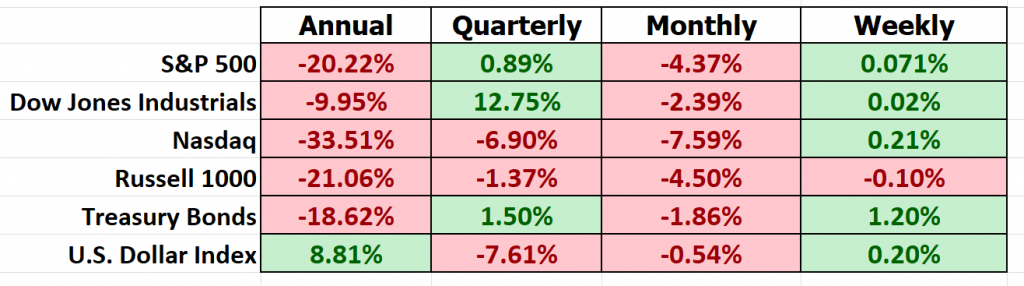
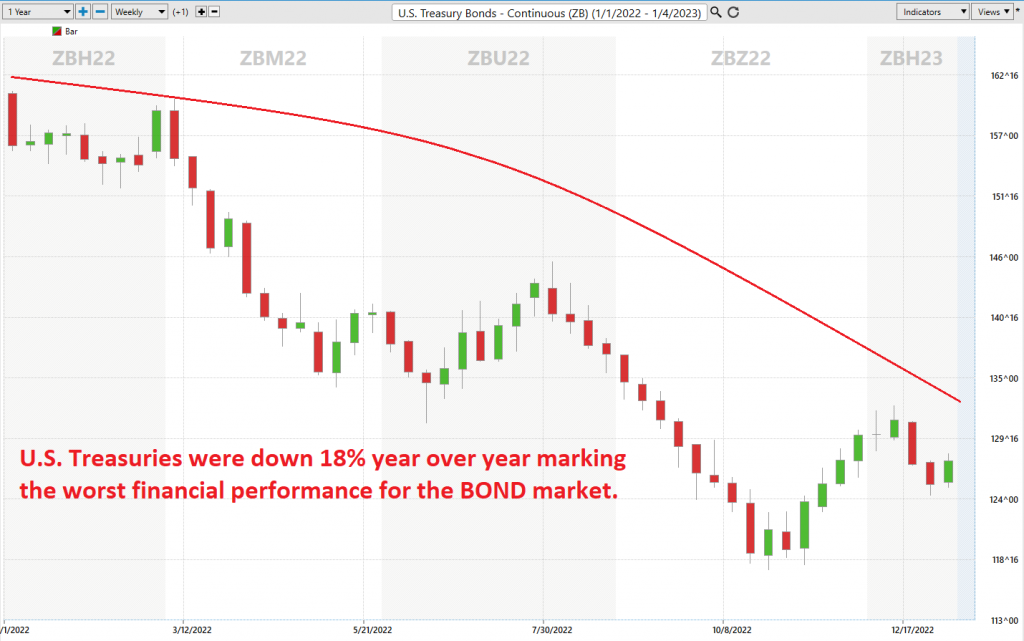
Regardless of how you look at the financial markets in 2022 the performance for the buy and hold investor was horrendous! What is most troublesome is the performance of the U.S. Treasury market which was down 18.62%. This metric is the worst in its entire history. This is where my attention has been fixed over the last several months.
When you look at those performance metrics what do you see?
The first thing that I see is the suffering of the financial planning industry.
Let me explain.
The entire focus on financial planners is wealth preservation. What they preach is that a diversified portfolio of 60% stocks and 40% bonds is the best and most efficient way to preserve and grow wealth. This concept worked brilliantly over the last 40 years when interest rates were falling. The underlying foundational concept behind this perspective is that a balanced portfolio of 60% stocks and 40% bonds is recommended by financial planners because it offers potential returns while also providing stability. Generally, stocks provide higher potential returns over a longer-term period but come with greater market risk; bonds, on the other hand, are less risky but provide lower potential returns. A balance of the two gives investors the opportunity to potentially capitalize on market growth while also not being unduly influenced by fluctuations in the stock market. Moreover, through diversification, losses in one type of investment can be offset by gains in another – thus minimizing risk while maximizing potential return. For these reasons, a balanced portfolio of both stocks and bonds is seen as sound financial planning for most investors.
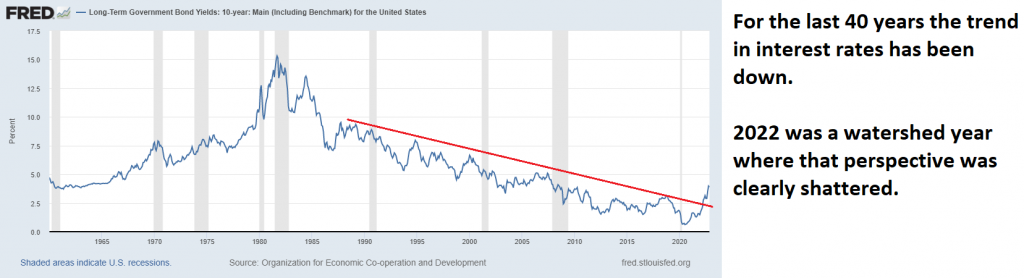
Financial planners for the last 40 years could count on bonds offering a positive return when the stock market was in decline. However, this strategy and philosophy proved disastrous in 2022. For the last 40 years the secular long-term trend in interest rates was down. That has clearly changed when you look and study the long-term U.S. Treasury yield chart.
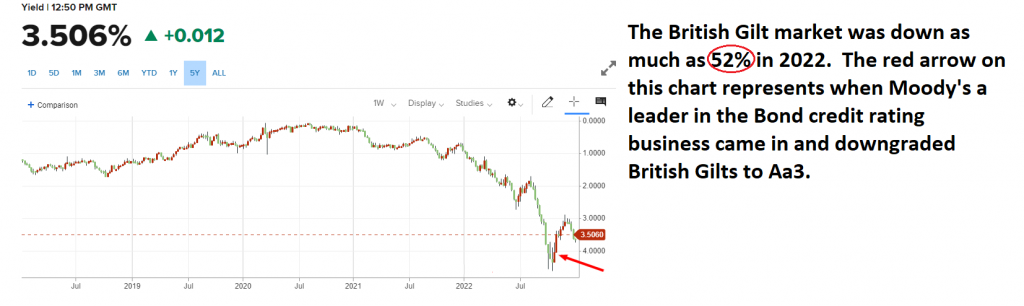
But here is the chart and price action that bothers me the most of everything that happened in 2022. Below is the price chart of the United Kingdom’s Long Term GILT market.
GILTS are debt securities issued by the UK government to raise money which is used to finance spending. These instruments are also known as Treasury Securities and carry zero risk of default due to the huge financial backing of the British Government, making them an attractive investment choice for many investors. The GILT market is one of the largest in Europe, with a current value in excess of £1.3 trillion. This puts the market second only to that of Germany in terms of number and amount invested. The size, liquidity and low risk associated with GILTS make them a popular choice for investment portfolios around the world and explain their position as a major force in global finance markets.
In 2022- GILTS were down as much as 52%!
I consider this chart to be SIGNIFICANT for several reasons.
The UK has a GDP of $3.479 trillion. They are a member of the G8 nations. The G8 nations are the world’s leading economic powers, and they include Canada, France, Germany, Italy, Japan, Russia, the United Kingdom, and the United States. Collectively, these nations contribute roughly half of the globe’s gross domestic product (GDP). Specifically, the U.S., China, and Japan make up over 50 percent of this figure collectively. Moreover, can you remember a time when a G8 sovereign nation lost as much as 52% of its value in a year? How can a BOND offering have a AAA rating when its performance was this poor? What does this say about the Treasury market in general? What does it say about the rating agencies?
Aa3 is a credit rating given to bonds offered by Moody’s – one of the largest independent credit rating agencies. This designation indicates that according to the rating agency, the bond issuer has a high-quality debt obligation of average risk with a strong capacity to meet their financial obligations. In comparison, AAA is Moody’s highest-quality mark and indicates that a company’s debt obligation carries very little risk and is highly likely to be paid in full on its due date. Companies that receive lower ratings such as Aa3 are more likely to experience greater volatility in their stock prices as these firms are not seen as reliable or trustworthy. Ultimately, investors should keep an eye on Aa3 bonds – while they may be relatively safe investments, they aren’t necessarily sure bets. Why was the bond only downgraded to Aa3?
The U.K. is the sixth largest economy in the world.
The bond rating system is an important tool that is used to measure the quality of a particular bond. It denotes the risk associated with investing in the bond and helps investors determine how likely it is that they will receive return payments on their investment. A higher rating means a lower risk, while a lower rating means a higher risk. Bonds are typically divided into six categories, ranging from AAA (considered “high grade”) to CCC (considered “very speculative”). Many factors such as management team strength, capital structure and debt coverage ratios are evaluated when determining a bond’s rating. In general, bonds rated AAA-BBB are considered investment grade, while those rated BB or lower are considered noninvestment grade. For a municipality to receive an increased credit/bond rating from its current one, policymakers must take actionable steps to reduce financial risks. These steps include improving surplus levels and reducing interest rate obligations. Bond ratings from sovereign nations are of great importance in the world of investing and finance. Rating agencies such as Moody’s, Standard & Poor’s, and Fitch assess countries’ debt obligations based on creditworthiness. Sovereign bonds are rated on a scale ranging from AAA (the safest) to C (outright default). This rating system can influence financial markets by providing investors with additional information that can help them understand the risk associated with any given country or issuer. Ultimately, these ratings determine which nations can borrow or access capital markets and have wide-ranging political, social, and economic implications for both lenders and borrowers alike.
The phrase “the seeds of crisis always begin in the bond market” provides insight into the workings of financial markets and why trading bonds and understanding them is such a necessary part of managing risk. At its core we are talking about money, specifically the cost of money. Historically, when a company or country begins to have issues with credit and solvency, these troubles always appear in the bond market.
In essence, bond markets are seen as harbingers of economic trouble. When an analyst says that problems first appear in the bond market, it means that they can anticipate downturns based on discrepancies between borrowing costs, yields set by the central bank, and the prices at which bonds are bought and sold. In other words, financial analysts monitor changes in government-issued debt as an indication of future instability or volatility – when something doesn’t look right in terms of what investors are willing to lend money for, it can be a sign of potential danger down the line. Therefore, examining trends in the bond market is one key tool that analysts use to gain an early understanding of present and future macroeconomic conditions – with the goal being to stay ahead of any damaging effects before they materialize.
More importantly, is the concern of financial contagion. The biggest investors in the bonds are individuals and institutions who are risk averse. They are looking for the safe, guaranteed preservation of their savings. These are widows, orphans, pension funds and retirees. When the GILT market, which is long considered to be one of the safest and most secure investments in the world, is down 52% the long-term effects of this debasement are evident to all conscious market participants.
Currently, the inflation rate in the UK is 10.672%.
The GILT market is yielding 3.5%.
The difference is a negative real rate of return of -7.172%.
Want to understand why the U.S. dollar was up strong last year?
Would you invest in British Bonds guaranteeing you a loss of 7% a year?
I cannot imagine that the Pension Fund system is solvent based upon the performance of the British Gilt market!
Compound that reality with the fact that the British Pound also lost 11% year over year against the dollar, and it is not hard to visualize all of the ingredients of a sovereign debt crisis.
When American Bonds are down 18% year over year and UK Bonds lost as much as 52%, how is this performance anything less than a cataclysmic crisis?
The bond bulls are people who think that bond prices will go up in the next year. They think this because they feel interest rates will go down. This happens when inflation is not a problem, and the economy is slowing down. If you agree with the bond bulls, it makes sense to buy bonds now while the interest rates are still high. However, if you disagree with this premise, buckle up!
When I look at the charts, I see trouble on the horizon.
First let’s look at the yield curve. This is the chart of the 10 years minus the 3-month Treasury Note spread. Observe how it is the deepest negative value since the index has been maintained by the Federal Reserve.
For the last 2 years we have been warning about the implications on the markets of a negative yield curve. You can read our previous articles here:
A Recession by Any Other Name Would Still Be Bad!
How Can We Tell if the Economy is in a Recession?
How important is the Yield Curve Today?
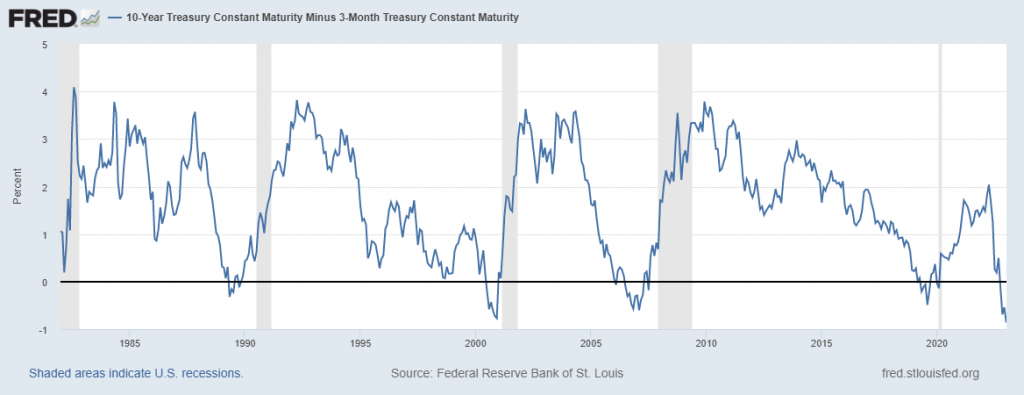
When this spread falls into negative territory, economists take notice as it is typically a harbinger of an oncoming recession in the economy. This phenomenon is caused by investors turning to safer investments in response to a drop in confidence in the economy – as investor confidence drops, they favor shorter-term bonds over those running for longer periods of time. When 3-month notes invest at higher yields than 10-year notes, it becomes clear that investors are increasingly skeptical about where the economy will be in the long term. It thus serves an important purpose as a warning sign that recession could be imminent, and investors should approach markets with caution.
Nobody wants to mention this reality!
The way I look at the financial markets is that if the BOND markets are in trouble, there are no safe havens any longer. It is analogous to visiting a casino and being forced to play before your chips get devalued. I recognize that sounds harsh and grim but show me a healthy company or country that has an unhealthy bond market, and I will quickly change my mind!
In the early part of 2022, a rapidly evolving world economy saw an unprecedented shift away from the U.S. dollar as the standard global reserve currency. The trend toward de-dollarization was spearheaded by nations classified as BRICS: Brazil, Russia, India, China, and South Africa and recently Saudi Arabia. These economic powerhouses had long sought to increase their own financial standing and stability, so when the opportunity arose for them to collectively work together against the dollar’s dominance in international markets, they jumped at it. Although America’s position as a powerful economy was not seriously compromised by this move, it certainly made investors pause and look for new opportunities in other countries’ currencies and securities. The trend created ripples throughout international markets that continue to be felt today even after gradual economic stabilization returned.
Moving forward the battle lines have clearly been drawn.
You have leaders like Vladimir Putin backing his currency with precious metals. You have the B.R.I.C.S nations forming their own hard asset/resource-based currency to settle trade with one another. Meanwhile you have Western Nations having major issues in the debt markets debasing currency as the required flavor of the day.
Markets are always attempting to discount the future.
With the benefit of hindsight, we can see that the entirety of 2022 was a bear market in stocks potentially anticipating the recession which the yield curve was anticipating.
Fundamentally speaking I am BEARISH the stock market. But, I never let my fundamental opinions get in the way of my trading decisions. The things that I see and have described I believe to be true. But the only thing that matters in trading is price. If you do what price is doing you make money. If you don’t, you lose money.
It is a very simple binary game. Yet we all tend to complicate it with our ideas of significance and stories.
I was talking with a friend recently about the last 3 years in the financial markets. He made the following analogy. Imagine that you are in a bad car accident and both of your legs are broken. You go to the hospital and in the emergency room before they reset your legs, they have to load you up with morphine and other painkillers. As the painkillers take hold you are no longer in pain. As a matter of fact, you are feeling pretty good. So much so, that in the very back of your mind you are thinking that maybe I should break my legs more often. But deep down you know and understand that when the painkillers wear off that the reality of what occurred will eventually set in. There will be pain, healing, physical therapy and re-educating your body in learning how to do the fundamental things that were once second nature.
This analogy makes a lot of sense to me today with regards to looking back at the financial world through the damage that occurred with the economic lockdowns and pandemic. In 2020 and 2021 the stimulus was cure-all anesthetic that would send markets higher.
In 2022 the one phrase you did not hear from the Fed was the stimulus. It did not occur, and the markets withered. Assuming the Fed resolve stays strong and they continue their path to raising interest rates further, I cannot see higher prices in the stock market. There is still a lot of repair that has to occur for the malfeasance of manipulating interest rates to ZERO over the last 14 years. As a trader, you need to make sure that you are not on the wrong side of the wrong trend at the wrong time.
The EVERYTHING BUBBLE has burst.
There are no Safe Havens any longer.
The trend in de-dollarization is accelerating.
The rating agencies appear to be asleep at the wheel again.
Moving forward you better get a handle on risk because it’s going to be a volatile ride.
All this spells massive volatility for the days, weeks, and months ahead and continued troubles in the Treasury market as governments are forced to print currency to fund their operations.
It may take months, years, or decades for valuations to normalize. Until it does there will be plenty of short-term swing trading opportunities for traders armed with the right information at the right time.
As you know, the real education in trading always lies in learning from the losers. Most humans have a really hard time learning from bad experiences.
The ego gets in the way each and every time.
This is what makes Artificial Intelligence so powerful and unique.
Machine Learning is designed to learn from experience and make the best statistically relevant decision moving forward. A.I. outperforms humanoid analysis hands down every time.
We live in very exciting times.
What hurts can instruct us.
Mistakes are financially costly but for machine learning, it is the pathway to mastery and excellence. The real education in trading always lies in learning from the losers.
Since artificial intelligence has beaten humans in Poker, Chess, Jeopardy and Go! do you really think trading is any different?
Why should trading be any different?
I invite you to learn how to forecast the stock market at our Next Free Live Training.
It’s not magic. It’s machine learning.
Make it count.

IMPORTANT NOTICE!
THERE IS SUBSTANTIAL RISK OF LOSS ASSOCIATED WITH TRADING. ONLY RISK CAPITAL SHOULD BE USED TO TRADE. TRADING STOCKS, FUTURES, OPTIONS, FOREX, AND ETFs IS NOT SUITABLE FOR EVERYONE.
DISCLAIMER: STOCKS, FUTURES, OPTIONS, ETFs AND CURRENCY TRADING ALL HAVE LARGE POTENTIAL REWARDS, BUT THEY ALSO HAVE LARGE POTENTIAL RISK. YOU MUST BE AWARE OF THE RISKS AND BE WILLING TO ACCEPT THEM IN ORDER TO INVEST IN THESE MARKETS. DON’T TRADE WITH MONEY YOU CAN’T AFFORD TO LOSE. THIS ARTICLE AND WEBSITE IS NEITHER A SOLICITATION NOR AN OFFER TO BUY/SELL FUTURES, OPTIONS, STOCKS, OR CURRENCIES. NO REPRESENTATION IS BEING MADE THAT ANY ACCOUNT WILL OR IS LIKELY TO ACHIEVE PROFITS OR LOSSES SIMILAR TO THOSE DISCUSSED ON THIS ARTICLE OR WEBSITE. THE PAST PERFORMANCE OF ANY TRADING SYSTEM OR METHODOLOGY IS NOT NECESSARILY INDICATIVE OF FUTURE RESULTS. CFTC RULE 4.41 – HYPOTHETICAL OR SIMULATED PERFORMANCE RESULTS HAVE CERTAIN LIMITATIONS. UNLIKE AN ACTUAL PERFORMANCE RECORD, SIMULATED RESULTS DO NOT REPRESENT ACTUAL TRADING. ALSO, SINCE THE TRADES HAVE NOT BEEN EXECUTED, THE RESULTS MAY HAVE UNDER-OR-OVER COMPENSATED FOR THE IMPACT, IF ANY, OF CERTAIN MARKET FACTORS, SUCH AS LACK OF LIQUIDITY. SIMULATED TRADING PROGRAMS IN GENERAL ARE ALSO SUBJECT TO THE FACT THAT THEY ARE DESIGNED WITH THE BENEFIT OF HINDSIGHT. NO REPRESENTATION IS BEING MADE THAT ANY ACCOUNT WILL OR IS LIKELY TO ACHIEVE PROFIT OR LOSSES SIMILAR TO THOSE SHOWN.

