
Sometimes when analyzing the markets, the best thing you can do is to look very closely at who is winning and who is losing. Success and failure leave huge footprints and the long-term price action of individual stocks and sectors of the marketplace provides very distinct clues as to where the money is flowing.
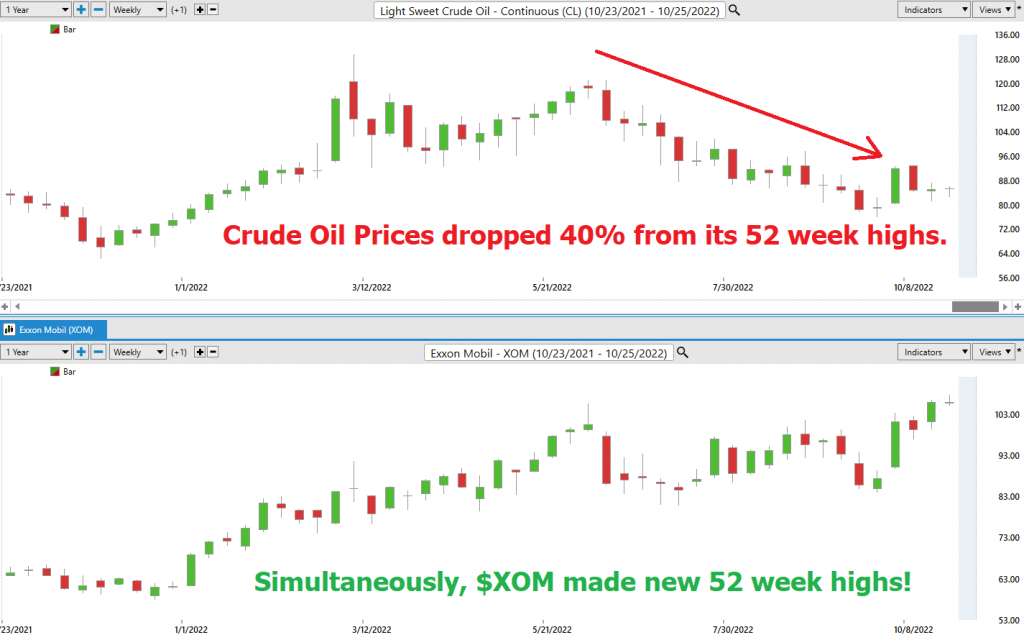
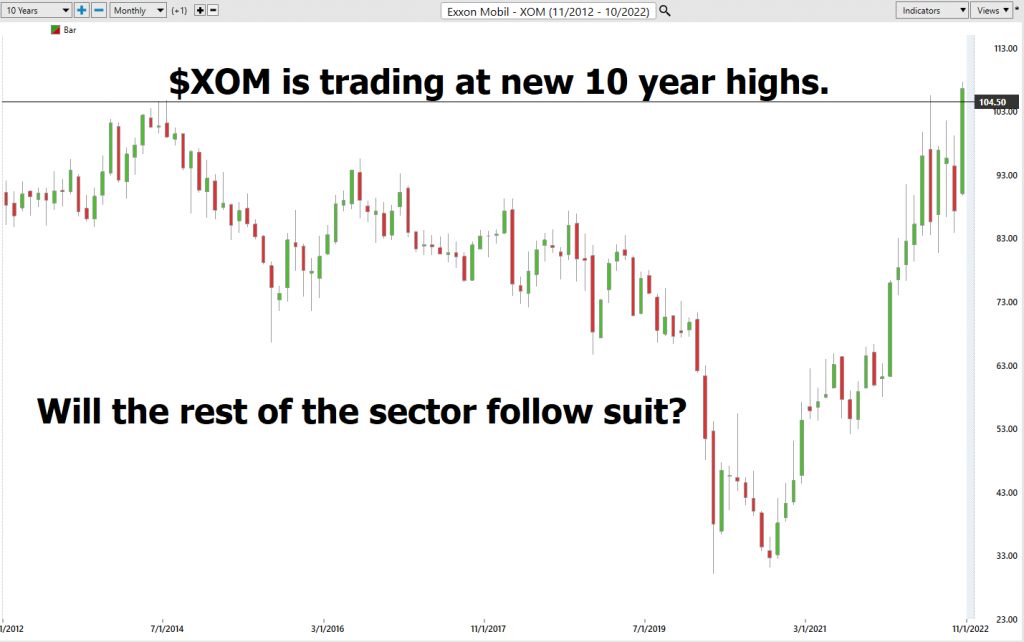
Over the past few weeks, we have seen the Energy commodities collapse in price while the energy related stocks moved to NEW 52-week highs and 10-year highs. One of our favorite sayings is “PAY ATTENTION whenever you see any asset make a new 10 year high.” You may not understand it. You may not agree with it. But you must acknowledge that something BIG is happening in that asset.
Exxon Mobil Corporation has an Earnings release On Friday October 28. Trading earnings can be treacherous. But this week we decided to do a DEEP DIVE into the energy sector to explore trading and investing opportunities based upon the performance of market leader $XOM. Our analysis is on the Energy Sector SPDR – $XLE.
The Energy Select Sector SPDR $XLE is an exchange traded fund (ETF) that tracks the energy sector of the S&P 500. The fund holds a variety of stocks in the energy sector, including oil, gas, and coal companies. While the energy sector is known for being volatile, it can also offer investors high rewards. What makes $XLE an interesting analysis is that it demonstrates the principle that money moves wherever it is treated best. $XLE pays a 4.1% divided. This yield is comparable to the 10-year U.S. Treasury Note. Traditionally investors seeking a safe haven would run into government securities in normal times. But with inflation having registered at 9% these are not normal times. So many investors seeking a safe haven have opted for the Energy sector because many of the top dividend aristocrats are energy companies. A dividend aristocrat is a company that has increased its dividend payout for at least 25 consecutive years. While there are many companies that have paid dividends for decades, only a few have been able to consistently increase their dividend payouts year after year. Some of the most well-known dividend aristocrats include Exxon (XOM) and Chevron (CVX). These companies have both increased their dividend payouts for over 30 consecutive years. These dividend payouts can be received as income or re-invested in additional shares withing the ETF.
Dividend aristocrats typically have strong balance sheets and generate a lot of cash flow. This enables them to weather economic downturns and maintain their dividend payouts even when times are tough. As a result, dividend aristocrats can be an attractive option for income-seeking investors. They tend to have higher dividend yields than the market average, and their dividend payments are more likely to be sustainable over the long term. A 4% dividend yield on $XLE allows an investor to enter the investment perceiving that they have 4% protection to the downside.
Here is a listing of the top holdings in the SPDR Energy Sector ($XLE):
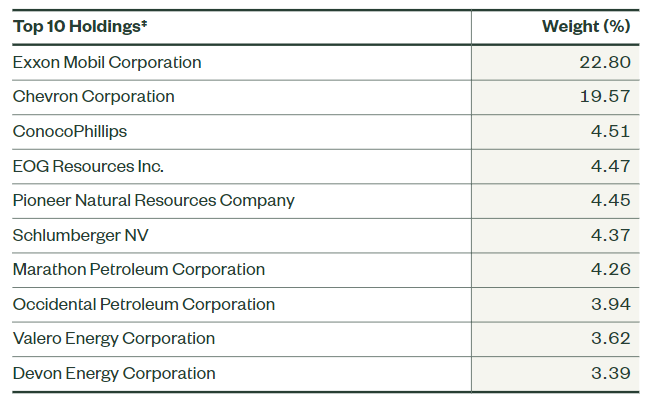
As you will see these companies all have extraordinarily strong balance sheets and are very widely traded. As the market leader $XOM moves to new highs we suspect that after some volatility that the rest of the sector will follow suit. In this analysis we will look at and evaluate the following criteria:
- Annual Performance of $XLE top holdings
- 52-week high and low boundaries
- Vantagepoint A.I. Forecast (Predictive Blue Line)
- The Best Case – Worst Case Scenarios
- Neural Network Forecast
- Daily Range Forecast
- Intermarket Analysis
- Our trading suggestion
We don’t base our trading decisions on things like earnings or fundamental cash flow valuations. However, we do look at them to better understand the financial landscape that a company is operating under.
Annual Performance of $XLE top holdings
Look at how the top holdings within $XLE have performed over the past year. ‘Nuff said.
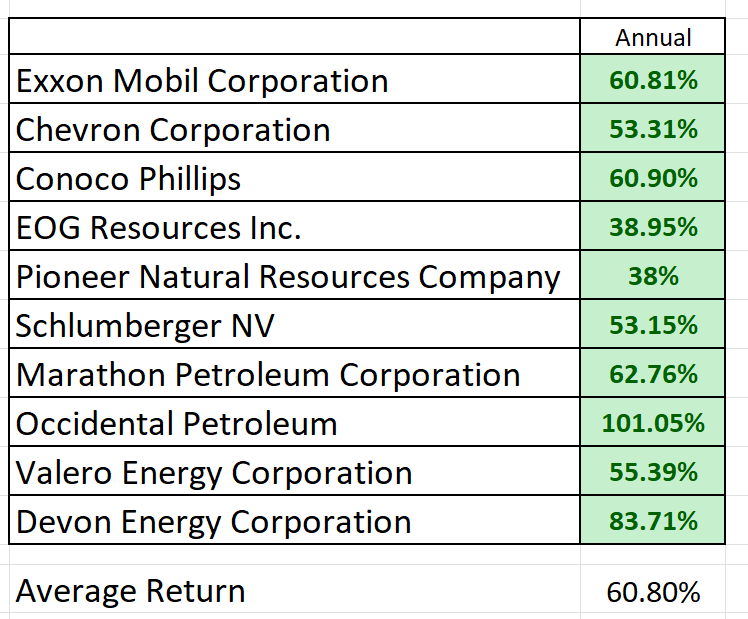
As we have written about previously, SOMETIMES all you need to do to be successful on Wall Street is know what is WINNING and what is LOSING. The idea is that trends in motion tend to remain in motion until they change.
52-week High-Low Chart
Looking at the Long-Term chart of $XLE provides us with the 52-week high and low boundaries.
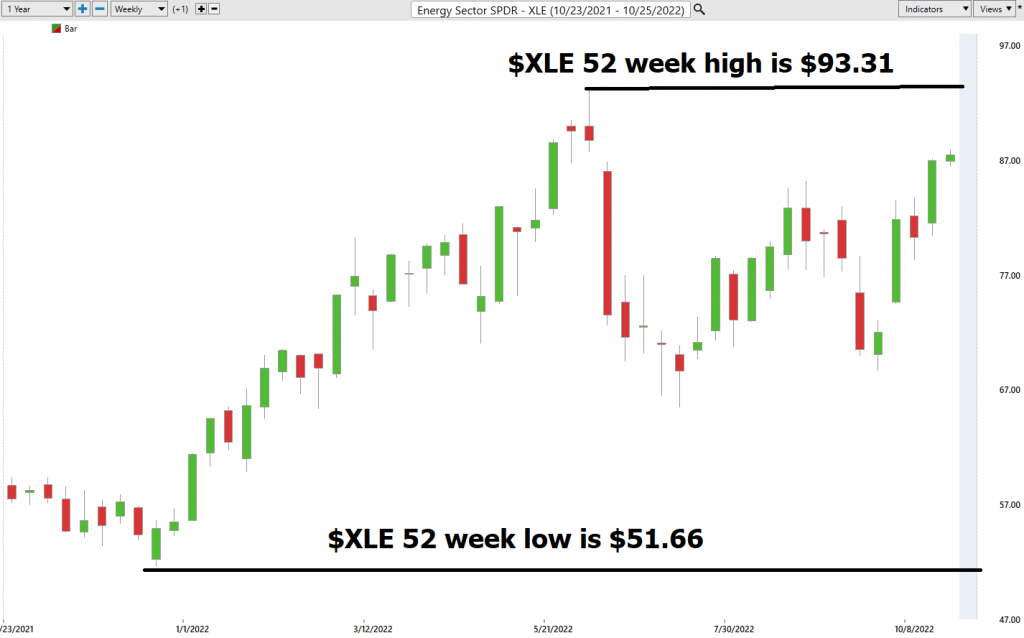
Over the past year we have seen $XLE trade as low as $93.31 and as high as $51.66. This represents an annualized volatility of 47%% which is high. We calculate this base measurement of volatility by dividing the annual trading range by the most recent close.
The 52-week chart on $XLE looks like it is in the process of challenging its yearly highs.
If we zoom out to see how the company has performed over the last 10-year timeframe we see a tremendous boom followed by a downtrend which bottomed out during the beginning of the pandemic
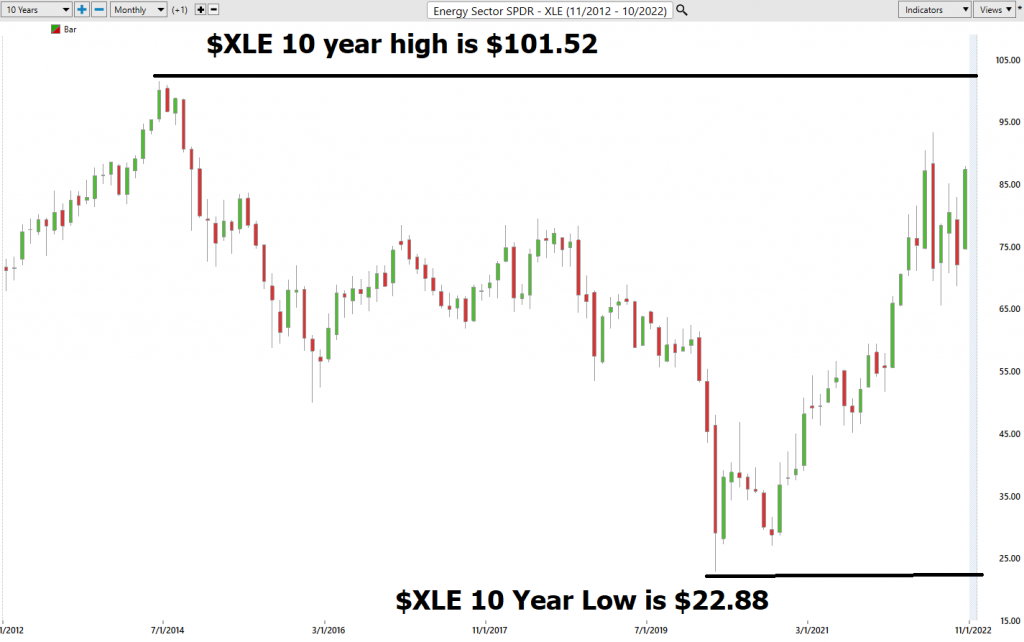
Place these boundaries on your radar and pay attention. The probabilities favor that the energy sector will challenge its 52 weeks highs shortly and then move up to challenge its 10-year highs.
Best Case – Worst Case Analysis
A very practical approach for traders and investors to study is simply to look at all the rallies and declines in an asset over the past year to get a very realistic perspective of volatility.
Volatility is not just a number. It is the variance around the average over a given period. By looking at the best-case rallies and then evaluating those gains against the declines you can quickly see expectations. This is paramount for short-term traders
The chart below shows the numerous sharp declines that $XLE had over the past year..
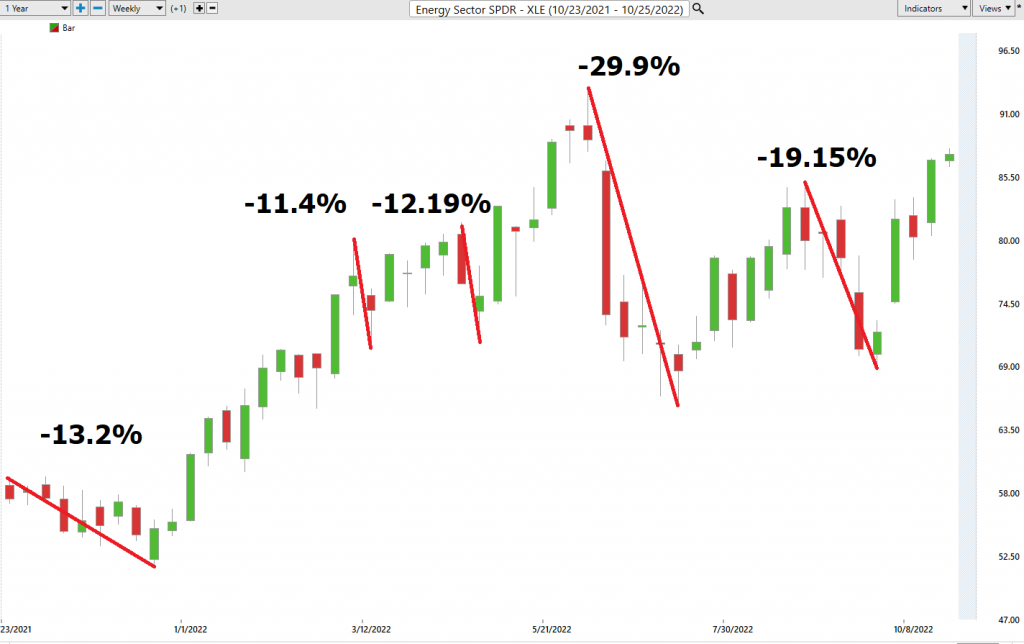
The declines ranged from 11% and as much as 29.9%.
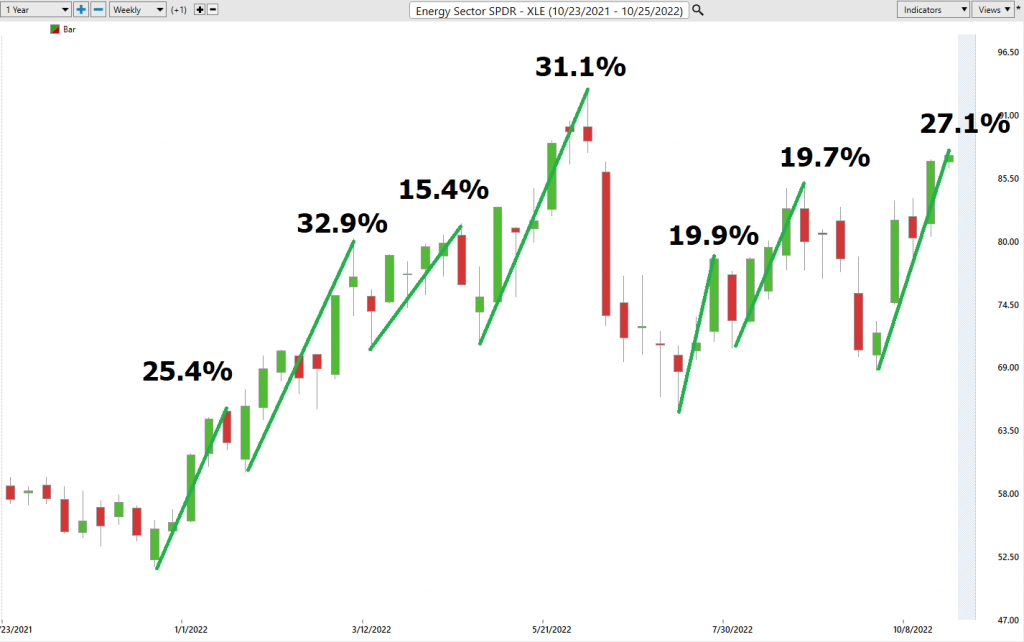
Market rallies ranged from 15.4% to 31.1%.
What we can learn from this basic worst-case analysis is that $XLE could EASILY fall 29.9% in a period of weeks which would be considered normal based upon what has happened in the past 52 weeks.
This price volatility is ideal for SWING traders who can exploit the upside without having to experience the steep declines.
$XLE moves very sharply with great conviction. It deserves to be on your radar.
Next, we compare $XLE to the performance of the broader stock market indexes.
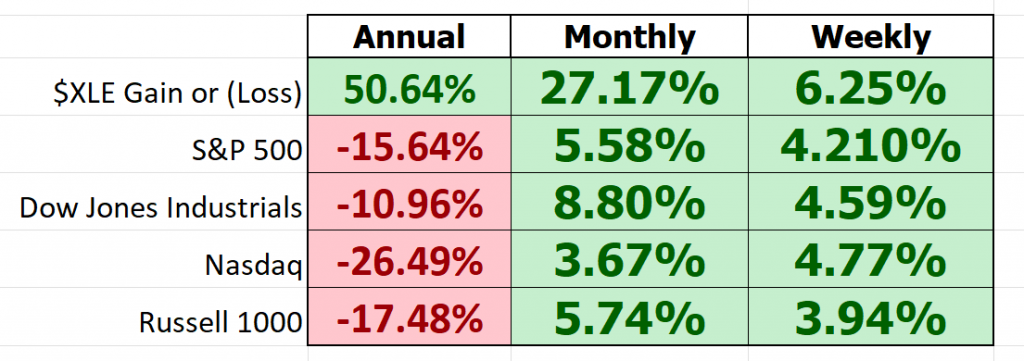
$XLE has outperformed the broader markets by a very wide margin on the weekly, monthly, and annual time frames. We would expect some short-term consolidation based upon these metrics but the UPTREND across the energy sector is certainly solid.
Vantagepoint A.I. Forecast (Predictive Blue Line)
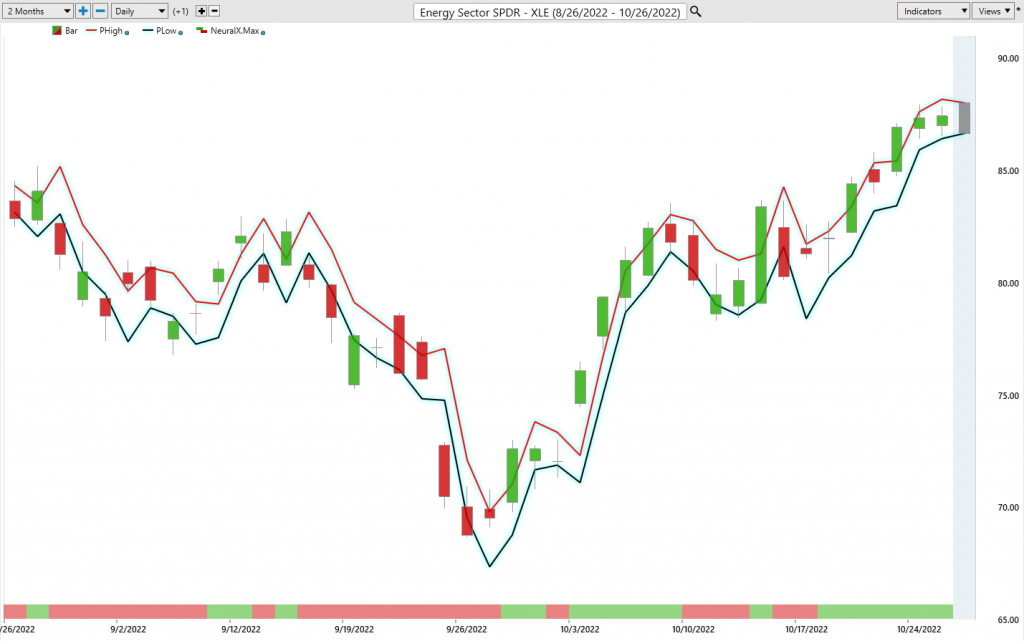
On the following chart you will see the power of the VantagePoint Predictive blue line which determines the medium term trend price forecast.
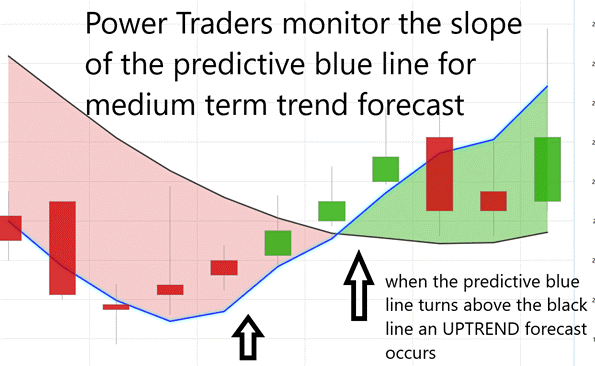
The guidelines we abide by are as follows:
- The slope of the predictive blue line determines the trend and general direction of $XLE
- Ideally, the VALUE ZONE is determined to try and buy the asset at or below the predictive blue line.
Here is a snapshot of the last few months’ price action.
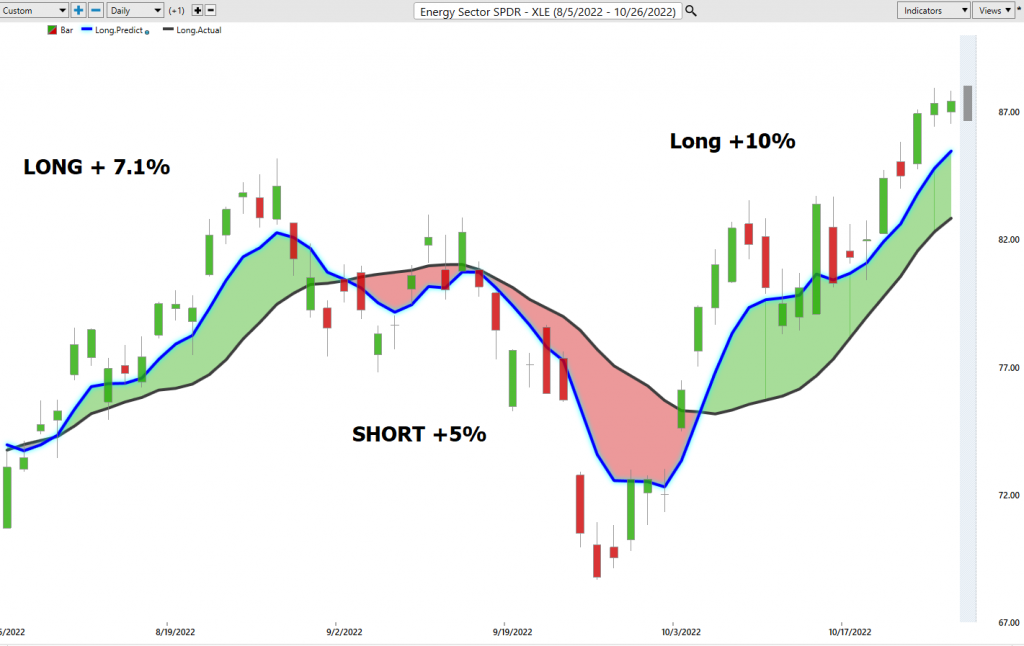
Over the last 3 months there were three trend forecasts. Cumulative gains were 22.1%. The average gain was 7.36%.
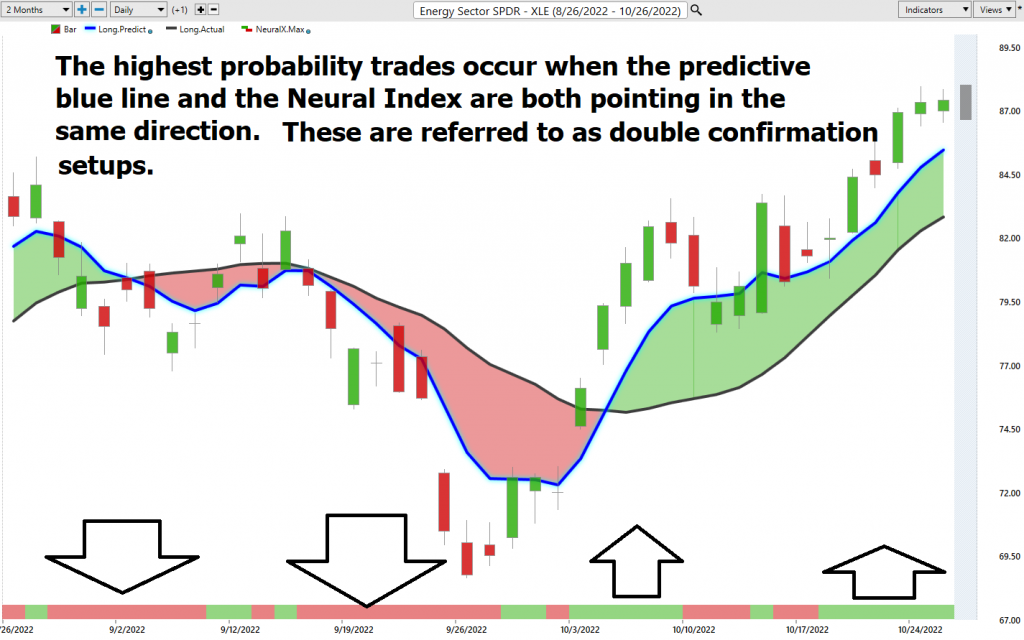
Fine Tuning Entries with The Neural Net Indicator
At the bottom of the chart is the Neural Network Indicator which predicts future short-term strength and/or weakness in the market. When the Neural Net Indicator is green it communicates strength. When the Neural Net is red it forecasts short term weakness in the market.
A Neural Net is a computational learning system that uses a network of functions to understand and translate massive amounts of data into a desired output, consistently monitoring itself and improving its performance.
A neural network is a computer system modeled after the neural structure of the brain. This system is designed to recognize patterns and interpret data in a way that mimics the way humans learn. Neural networks are composed of interconnected neurons, which process information and relay it to other neurons in the network. The strength of the connections between neurons determines how well the network can learn from data. Neural networks were developed in the early 1950s, but only began to gain popularity in the 1990s with the advent of big data and machine learning. Today, neural networks are used in a variety of fields, including trading. Power traders use neural networks to help them make decisions based on large amounts of market data. The neural network’s ability to learn from data makes it an invaluable tool for traders who want to stay ahead of the market.
Whenever Power Traders are looking for statistically valid trading setups, they look for a DOUBLE confirmation signal. This signal occurs whenever the blue predictive line and the Neural Net at the bottom of the chart suggest the same future expected outcome.
We advocate that Power Traders cross reference the chart with the predictive blue line and neural network indicator to create optimal entry and exit points.
Traders look for confirmation on the Neural Net to position themselves LONG or SHORT in the market. In other words, when the A.I. forecast is green, and The Neural Net is green, that presents a buying opportunity.
VantagePoint Software Daily Price Range Prediction
One of the powerful features in the VantagePoint Software which Power Traders use daily is the Price Range prediction forecast.
This forecast is what permits Power Traders to truly fine tune their entries and exits into the market.
Every day traders are faced with the anxiety and frustration of wondering where they should be looking to buy and sell the market. VantagePoint’s A.I. makes this decision super easy with the Daily Price Range Forecast.
For short term traders the important question that they have to confront every day is where should I buy? Where should I place my stop? Where should I sell? The VantagePoint Daily Price Range forecast can help them answer this question.
Here is what the $XLE trading landscape looks like on a daily, weekly and monthly basis.
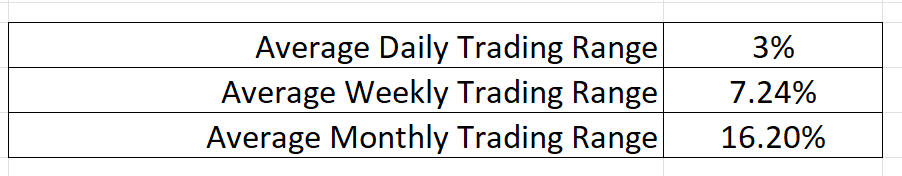
The Vantagepoint A.I. Daily Range forecast operates within this volatility to provide very exact trading boundaries on a daily basis.
Observe how the channel is very clearly delineated and it is very easy to observe where anticipated support and resistance over the short terms are. Short term traders look to buy near the bottom of the channel and sell at or above the top of the channel.
See how the upper and lower bands of the price range forecast form a noticeably clear channel of trading activity as well. Swing traders are always looking for opportunities to buy towards the bottom of the predicted channel and selling opportunities above the top band.
Intermarket Analysis
Power lies in the way we respond to the truth we understand.
One of the supremely important questions in trading is what is driving the price? Headlines often create interesting narratives. But these “stories” only capture the imagination. Traders want and need to understand the cause and effect of price movement.
The only way to get an answer to this important question is through intermarket analysis which looks at statistical price correlations of assets.
We live in a global marketplace.
Everything is interconnected.
Intermarket analysis is a trading analysis technique that looks at the correlation between different asset classes in order to make better-informed trading decisions. By considering the relationships between different markets, intermarket analysis can give traders a more complete picture of the overall market environment. For example, by analyzing the relationship between $XLE and other markets, traders can get a better sense of whether the market is bullish or bearish. By looking at the correlation between $XLE and crude oil, traders can get a better sense of which way prices are likely to move. By considering these and other relationships, intermarket analysis can help traders to make more informed trading decisions.
Intermarket analysis is the branch of technical analysis that examines correlations between different asset classes to identify opportunities for trade. By understanding how different markets interact, traders can make more informed decisions about where to invest their money.
By spotting patterns in these charts, traders can gain insights into how different markets move in relation to each other.
Some of the most successful traders in the world use intermarket analysis as part of their trading strategy. George Soros is one notable example along with John Murphy, and Vantagepoint A.I. founder Lou Mendelsohn. Soros is a billionaire hedge fund manager who is renowned for his ability to profit from market crashes. He achieved this by correctly identifying correlations between different asset classes and then taking trades accordingly.
By understanding correlations between different markets, traders can make more informed decisions about where to invest their money.
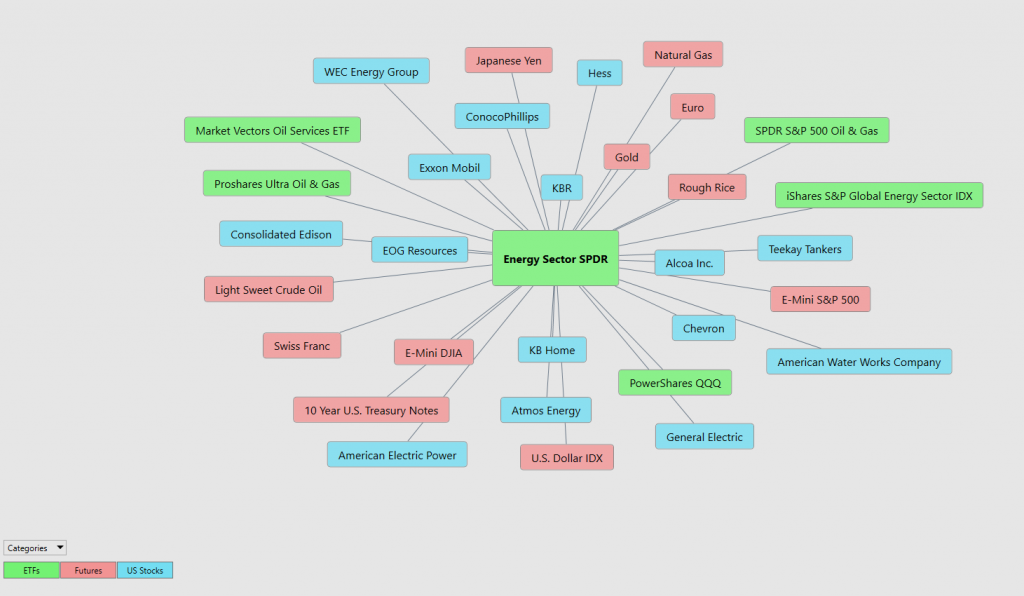
Interest rates, Crude Oil Prices, and the volatility of the Dollar amongst thousands of other variables affect the decisions companies must make to flourish and prosper in these challenging times. Trying to determine what these factors are is one of the huge problems facing investors and traders.
You always have a choice. You can tune in to the talking heads in the media who spin talking points which promote fear. Or you can rely on facts to base your decision making on. There is immense value to be had in studying and understanding the key drivers of $XLE’s price action. This graphic provides a microcosmic view of what factors have been driving $XLE’s price higher.
Suggestion for Traders
What caused us to take another look at $XLE was the reality that Exxon ($XOM) went on to make new 52-week highs and new 10 year highs. $XOM is the market leader in Energy. When the leaders lead our suggestion is to PAY ATTENTION.
$XLE is trading inversely to the broader stock market, and we think this also bodes well over the medium term.
The following table illustrates that the Energy sector and specifically $XLE has been the big winner over the past week, month, and year. Pay attention to the a.i. forecast, but I see no reason this trend will not continue.

Over the next several days earnings will be released for Exxon and Chevron. This normally creates a lot of initial volatility and sharp selloffs to the lower band of the daily range forecast should present good buying opportunities.
Energy is in a long-term bull market. It will be interesting to see how energy stocks perform moving forward once the underlying energy commodities rebound in price. While there is great price risk by investing in XLE it is fascinating that it is offering a dividend which is comparable to the 10-year U.S. Treasury Note. My suspicion is that investors and traders would rather own a strong company with strong cash flow than U.S. Debt.
We will re-evaluate based upon:
- New 52-week high and low boundaries
- Vantagepoint A.I. Forecast (Predictive Blue Line)
- Neural Network Forecast
- Daily Range Forecast
Let’s Be Careful Out There!
Remember, It’s Not Magic.
It’s Machine Learning.

IMPORTANT NOTICE!
THERE IS SUBSTANTIAL RISK OF LOSS ASSOCIATED WITH TRADING. ONLY RISK CAPITAL SHOULD BE USED TO TRADE. TRADING STOCKS, FUTURES, OPTIONS, FOREX, AND ETFs IS NOT SUITABLE FOR EVERYONE.
DISCLAIMER: STOCKS, FUTURES, OPTIONS, ETFs AND CURRENCY TRADING ALL HAVE LARGE POTENTIAL REWARDS, BUT THEY ALSO HAVE LARGE POTENTIAL RISK. YOU MUST BE AWARE OF THE RISKS AND BE WILLING TO ACCEPT THEM IN ORDER TO INVEST IN THESE MARKETS. DON’T TRADE WITH MONEY YOU CAN’T AFFORD TO LOSE. THIS ARTICLE AND WEBSITE IS NEITHER A SOLICITATION NOR AN OFFER TO BUY/SELL FUTURES, OPTIONS, STOCKS, OR CURRENCIES. NO REPRESENTATION IS BEING MADE THAT ANY ACCOUNT WILL OR IS LIKELY TO ACHIEVE PROFITS OR LOSSES SIMILAR TO THOSE DISCUSSED ON THIS ARTICLE OR WEBSITE. THE PAST PERFORMANCE OF ANY TRADING SYSTEM OR METHODOLOGY IS NOT NECESSARILY INDICATIVE OF FUTURE RESULTS. CFTC RULE 4.41 – HYPOTHETICAL OR SIMULATED PERFORMANCE RESULTS HAVE CERTAIN LIMITATIONS. UNLIKE AN ACTUAL PERFORMANCE RECORD, SIMULATED RESULTS DO NOT REPRESENT ACTUAL TRADING. ALSO, SINCE THE TRADES HAVE NOT BEEN EXECUTED, THE RESULTS MAY HAVE UNDER-OR-OVER COMPENSATED FOR THE IMPACT, IF ANY, OF CERTAIN MARKET FACTORS, SUCH AS LACK OF LIQUIDITY. SIMULATED TRADING PROGRAMS IN GENERAL ARE ALSO SUBJECT TO THE FACT THAT THEY ARE DESIGNED WITH THE BENEFIT OF HINDSIGHT. NO REPRESENTATION IS BEING MADE THAT ANY ACCOUNT WILL OR IS LIKELY TO ACHIEVE PROFIT OR LOSSES SIMILAR TO THOSE SHOWN.

