
![]()
This week’s stock analysis is International Business Machines ($IBM).
International Business Machines Corporation (IBM) is an American multinational technology corporation headquartered in Armonk, New York, with operations in over 171 countries. For many years it earned the nickname “BIG BLUE” and was considered to be the perfect investment. IBM produces and sells computer hardware, middleware, and software, and provides hosting and consulting services in areas ranging from mainframe computers to nanotechnology.
Incredible innovations and inventions by IBM include the automated teller machine (ATM), the floppy disk, the hard disk drive, the magnetic stripe card, the relational database, the SQL programming language, the UPC barcode, and dynamic random-access memory (DRAM). IBM is one of 30 companies included in the Dow Jones Industrial Average and one of the world’s largest employers, with over 345,000 employees.
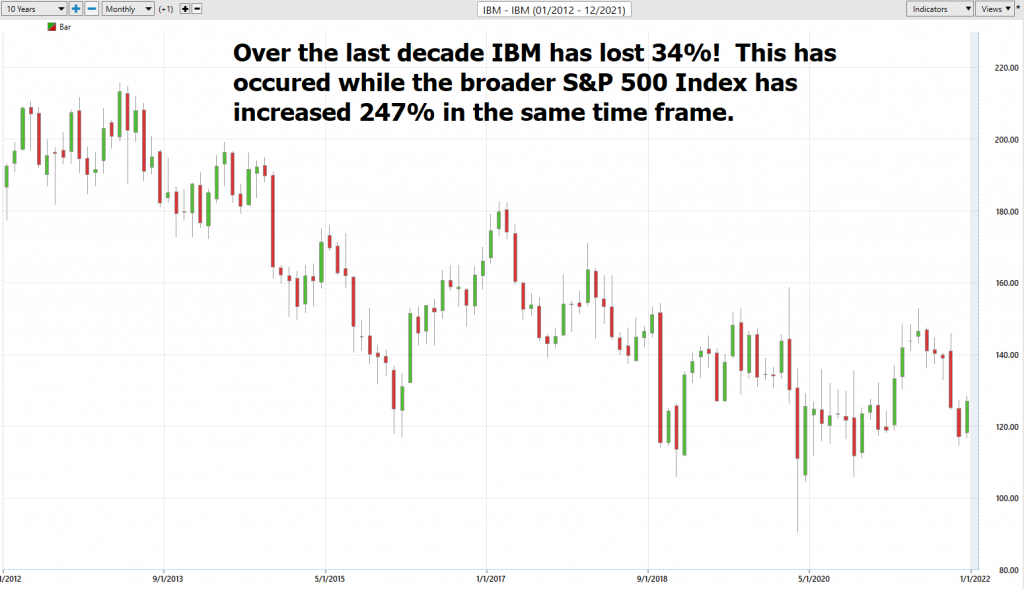
What is stunning about IBM today is that it has been a giant lackluster performer for the last decade. Despite its history of very impressive accomplishments, you can simply look at the 10-year chart of IBM and discover that over the last decade this former blue-chip standout has lost 34%. Meanwhile the broader S&P 500 Index has gained 247% during the same time frame. Bulls on IBM claim it is a “value” play which on Wall Street has become a curse word for companies which massively underperform.
IBM has a massive portfolio of products and services. These offerings fall include cloud computing, artificial intelligence, commerce, data and analytics, Internet of things (IoT), IT infrastructure, mobile, digital workplace, and cybersecurity.
IBM’s stock trades at 12 times forward earnings, making it much cheaper than other high-tech competitors like Amazon, Microsoft, and Alphabet. The Bears are quick to point out that its sluggish growth justifies its steep discount. The biggest challenge for IBM in the recent path is that it has been unable to generate stable revenue growth. Wall Street analysts look upon IBM as a yesteryear darling who has lost its luster and refer to it as a Dog of the Dow.
The other head scratching aspect of IBM’s performance is that it has doubled its dividend over the last decade from .71 cents per share to $1.56. Even with the generous dividend compensation the stock has underperformed all of its competitors.
IBM has a market cap of $115.9 billion. Expected sales for 2021 are around $74 billion. It trades on average 6 million shares a day.
The iconic IBM brand is in a turnaround after years of revenue declines. The company has shifted its focus toward cloud computing and artificial intelligence (AI).
In early November 2021, IBM spun off a subsidiary Kyndryl, which provides managed infrastructure services. Major critics of IBM claim that the company is a huge bureaucracy pretending to be a technology player.
In this weekly stock study, we will look at and analyze the following indicators and metrics as are our guidelines:
- Wall Street Analysts’ Estimates
- 52-week high and low boundaries
- Best Case – Worst Case Analysis
- Vantagepoint A.I. Forecast (Predictive Blue Line)
- Neural Network Forecast
- Daily Range Forecast
- Intermarket Analysis
- Our trading suggestion
We don’t base decisions on things like earnings or fundamental cash flow valuations. However, we do look at them to better understand the financial landscape that a company is operating under.
Wall Street Analysts’ Estimates
Based on 8 Wall Street analysts offering 12-month price targets for International Business Machines in the last 3 months. The average price target is $155.16 with a high forecast of $172.00 and a low forecast of $125.00. The average price target represents a 20.31% change from the last price of $128.97.
These levels provided by Wall Street Analysts provide us with a fundamental valuation of where they think IBM is undervalued, valued, and overvalued. We pay attention to these price levels because the price action in these zones allows us to position ourselves intelligently when guided by the a.i.
52-Week High and Low Boundaries
There is a slight anomaly in the IBM data that you need to be aware of. In early November 2021, IBM spun off its subsidiary Kyndryl ($KD) to operate independently. To account for this, some data providers treated this similarly to a stock split. For these data providers, the 52-week range of IBM is $112.20 on the low and $146.12 on the high. On the Vantagepoint chart, we did not extract the Kyndryl valuation, so our 52-week range is $114.56 to $152.84. We may adjust in the future. But we wanted to let you know that this anomaly does exist in pricing platforms online.
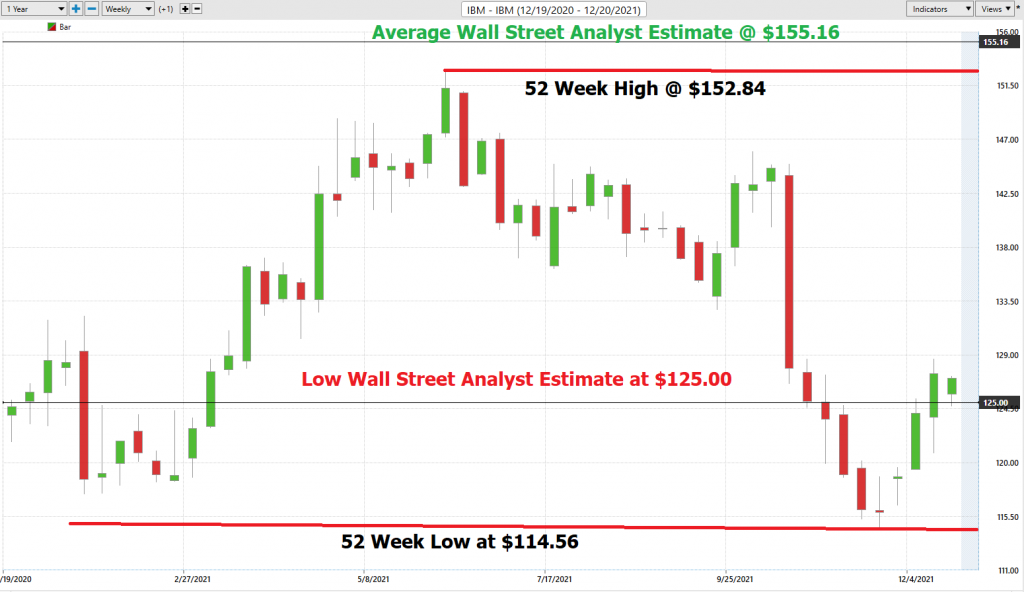
Over the past 52 weeks, IBM has traded as high as $152.84 and as low as $114.56.
That provides us with an annual trading range of $38.28. This tells us that the average weekly trading range for IBM stock is .73 cents. We also like to divide the annual trading range by the current price to get a better idea of a broad-based volatility measure. Currently, volatility is 29.9% which means that it would be normal should current volatility to continue for prices one year from now to be 29.9% higher or lower from their current level.
The chart above is a one-year chart of IBM ($IBM). Observe how important the 52-week high boundary has been in anticipating price movement. More importantly, look at how prices briefly went below the Lowest Wall Street Analyst estimate on two instances. We have found that, when guided by the a.i., amazing opportunities to find value appear.
The chart above shows us that IBM has been rangebound for the entire year. After making its 52-week low about 5 weeks ago it staged an impressive rally.
Our expectation is that the Low Wall Street Analysts estimate at $125 will provide support moving forward.
Best Case – Worst Case Scenario $PLD
Next, we want to evaluate $IBM is in comparison to the performance of the major stock market indexes which we have greater familiarity with and then look at the drawdowns of the stock over the past year to get a worst-case scenario idea for any conclusions that we might reach when we trade this asset.
- Over the past year $IBM is up 4.6%
- The Dow Jones Industrials are up 18.25% over the past year.
- S&P 500 is UP 26.09% over the last year.
- Russell 1000 Small Cap is up 23.57% in the past year.
- The NASDAQ is up 55.69%
You can see with IBM ($IBM) we have an asset that has massively underperformed the broader stock market indexes by a huge factor and has had correspondingly large drawdowns. Big Blue’s long-term performance has offered black and blue results.
These poor performance results are magnified even further when you look at comparison to the broader market indexes over the last decade.
Vantagepoint A.I. Forecast (Predictive Blue Line)
Let’s do some basic trend forecasting analysis based upon looking at the VantagePoint predictive blue line over the last year. On the following chart you will see the power of the VantagePoint Predictive blue line which determines the medium term trend price forecast.
The guidelines we abide by are as follows:
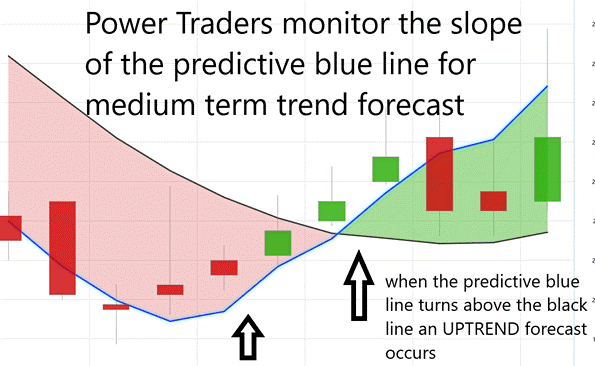
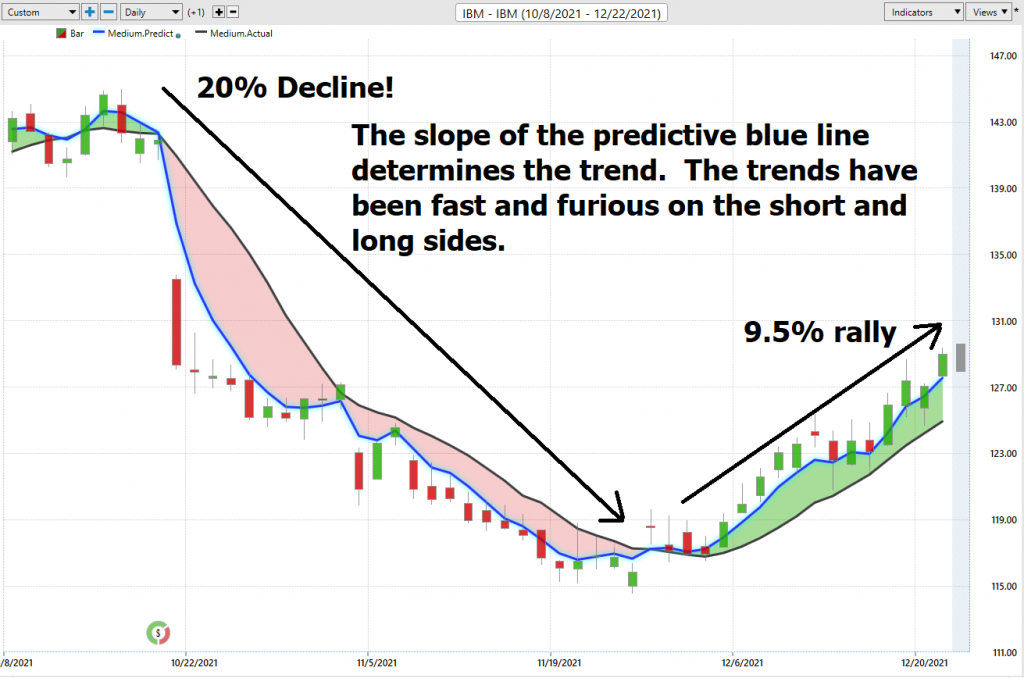
- The slope of the predictive blue line determines the trend and general direction of IBM
- When the blue line turns above the black line an UP opportunity occurs
- When the blue line turns below the black line a DOWN opportunity occurs
- Ideally, the VALUE ZONE is determined to try and buy the asset at or below the predictive blue line
This is the power and effectiveness of the Vantagepoint A.I. forecast in assisting traders to stay on the right side of the trend at the right time.
Using VantagePoint Software and the artificial intelligence, traders are alerted to trend forecasts by monitoring the slope of the predictive blue line. The black line is a simple 10 day moving average of price which simply tells you what has occurred in the market. The predictive blue line also acts as value zone where in uptrends traders try to purchase the asset at or below the blue line. The blue line is computed through Vantagepoint’s patented technology which looks at the artificial intelligence, neural networks as well as the intermarket to arrive at the best move forward.
In studying the chart above pay close attention to the relationship between the black line and predictive blue line.
The predictive blue line, on the other hand utilizes that Vantagepoint patented Neural Network and Intermarket Analysis to arrive at its value. It looks at the strongest price drivers of an asset through artificial intelligence and statistical correlations to determine its value.
Whenever we see the predictive blue line move above the black line, we are presented with an UP-entry opportunity. Power traders use the predictive blue line in helping to determine both the value zone as well as the trend direction.
Observe how the SLOPE of the predictive blue line started acts like a GPS in determining future trend direction.
Neural Network Indicator (Machine Learning)
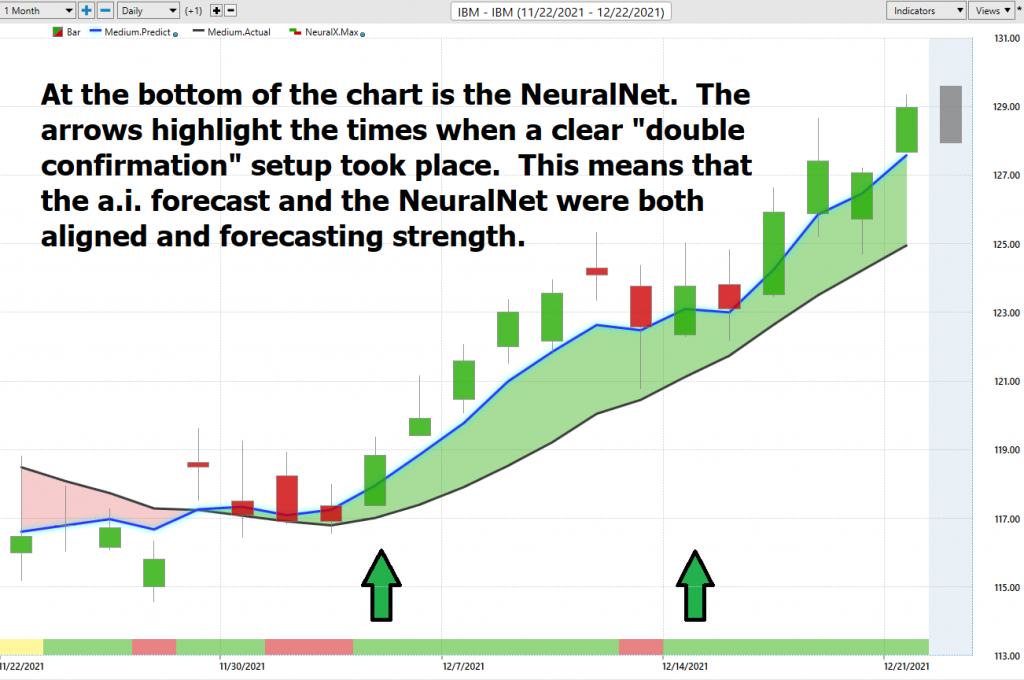
At the bottom of the chart is the Neural Network Indicator which predicts future strength and/or weakness in the market. When the Neural Net Indicator is Green it communicates strength. When the Neural Net is Red it is forecasting short term weakness in the market.
We advocate that Power Traders cross reference the chart with the predictive blue line and neural network indicator to create optimal entry and exit points. A Neural Net is a computational learning system that uses a network of functions to understand and translate massive amounts of data into a desired output, consistently monitoring itself and improving its performance.
Power Traders are always looking to apply both the neural network and A.I. to the markets to find statistically sound trading opportunities. We refer to this as a “double confirmation” setup and look for the predictive blue line to slope higher and to be confirmed by the Neural Net at the bottom of the chart.
On the chart below, the UP arrows show all the times when the double confirmation setup between the a.i. and the neural network occurred.
VantagePoint Software Daily Price Range Prediction
One of the powerful features in the Vantagepoint A.I. Software which Power Traders use daily is the Daily Price Range prediction forecast.
This forecast is what permits Power Traders to truly fine tune their entries and exits into the market.
Here is the price chart of IBM ($IBM) during the most recent runup featuring the Daily Price Range forecast and the Neural Net Indicator.
In summary, the trend turned up. Prices have surged since that forecast and the trend remain firmly UP. Traders have had numerous opportunities to purchase $IBM towards the lower end of the daily price forecast to fine tune their entries.
For short term traders the guidance that the Daily Price range forecast provides is invaluable. The trading channel is very clearly delineated and very accurate.
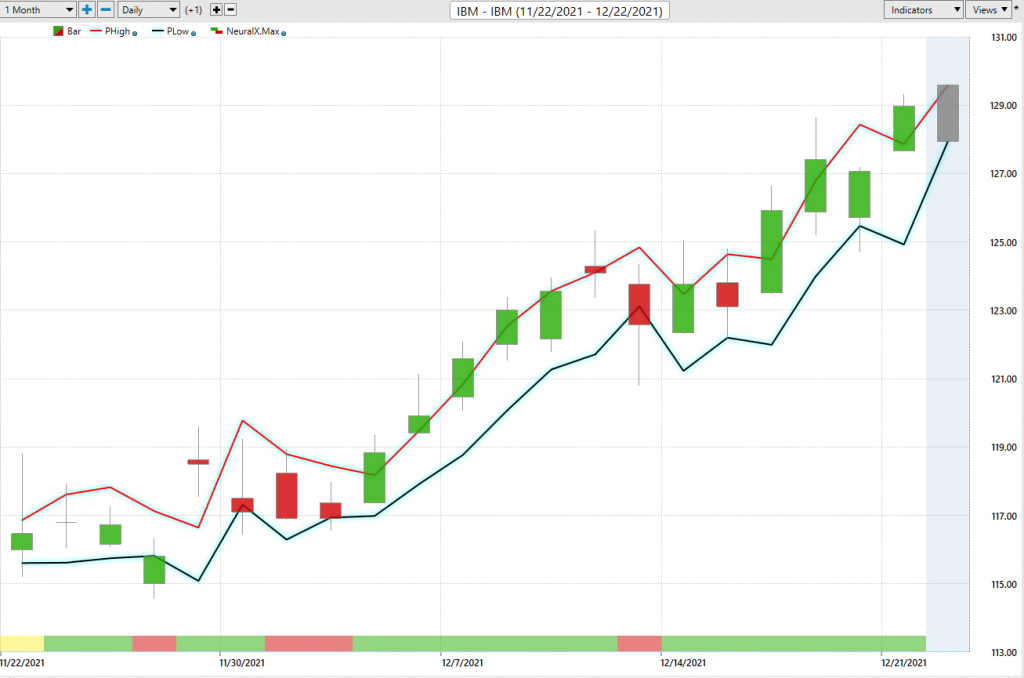
Power Traders use a price level below the predictive low price and may place their protective sell stops in the market in case a sudden reversal was to occur.
Observe how the predictive price low also provided numerous short term entry opportunities for traders to buy IBM as it was trending higher.
Intermarket Analysis
What makes the Vantagepoint Software truly unique is its ability to perform Intermarket analysis and to locate those assets which are most interconnected that are responsible for driving the price of IBM ($IBM) higher or lower.
As we have seen in this analysis IBM has been rangebound for all of 2021. It has also been a lackluster performer for the past decade. However, recently when the Fed announced that it would taper bond purchases and raise interest rates 3 times in 2022, we saw IBM stage an impressive rally.
Is this because IBM is perceived as a safe haven? Are the worst days behind IBM and its healthy dividend is attracting funds that would normally go to BOND purchases?
Studying the charts can always provide objective realities in terms of locating support and resistance levels which become very clear on a chart. But we live in a global marketplace. Everything is interconnected. The billion-dollar question for traders is always what are the key drivers of price for the underlying asset that I am trading?
These intangibles are invisible to the naked eye yet show very high statistical correlations. If you ask ten Wall Street Analysts why Ford is rising you will get 10 different responses.
Small changes in Interest rates, Crude Oil Prices, and the Volatility of the dollar amongst thousands of other variables affect the decisions companies must make to survive in these very challenging times. Trying to determine what these factors are is one of the huge problems facing investors and traders.
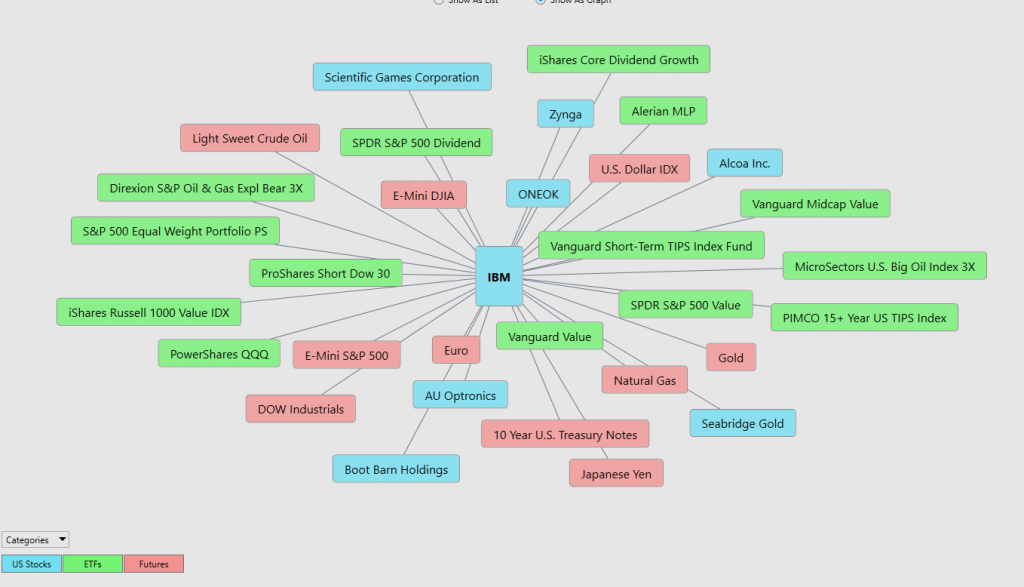
The following graphic allows you to see the key drivers of IBM price. These include stocks, futures, and ETF’s. Studying this graphic on a regular basis often uncovers other relevant trading opportunities.
By doing so you can often see which ETFs are most likely acquiring IBM as well as uncovering other industries which affect IBM’s ($IBM) price movement.
When we look at the Intermarket Analysis for IBM stock, we get a bird’s eye view of what assets are most interconnected to driving price. The key players in these sectors will often show up and present other relevant trading opportunities worth exploring.
Our Suggestion
IBM is up 4.4% over the past year. However, it is down 4.7% over the last two years. Over a three-year time frame, it is up 16.5%.
I think that IBM’s low earnings multiple and strong dividend is attracting funds that would normally allocate to the Bond market. As we have postulated in previous Stock studies that with inflation raging at 6.8%, it is very hard to make a good case for putting your money into an investment where you are guaranteed to lose yield. IBM by comparison offers low downside potential in terms of stock price and a strong dividend. As a YIELD opportunity it may be more attractive than the U.S. Bond market.
We however are not investors nor give investing advice.
The TREND is Up.
Momentum is UP.
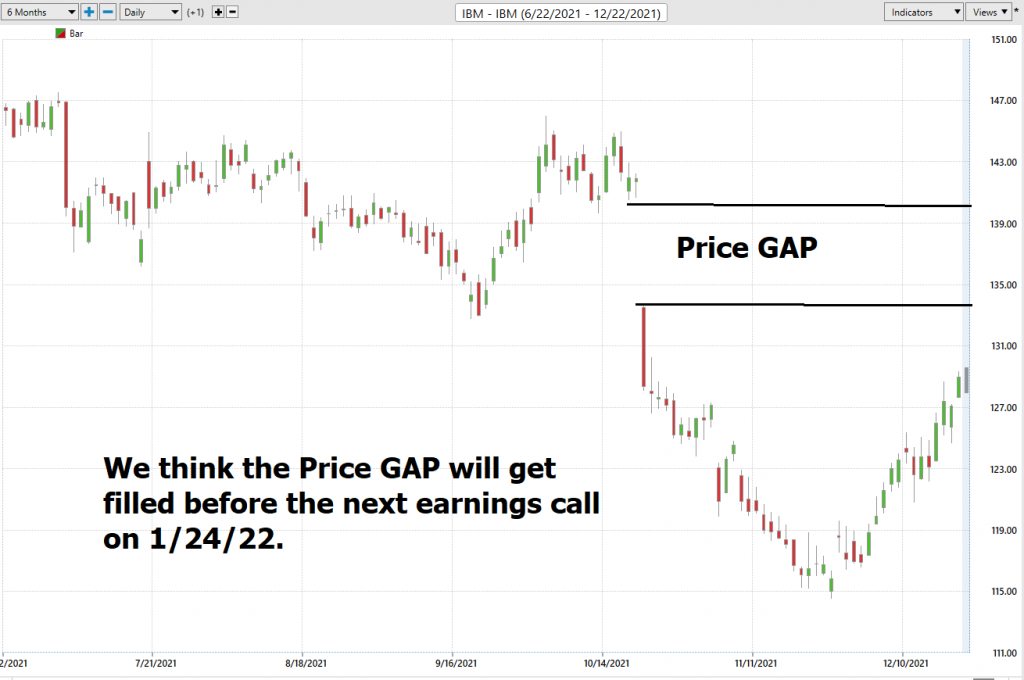
The Gap on the price charts is the next major area of resistance.
Aggressive Power Traders should follow the a.i. daily price range forecast and could look for opportunities to buy towards the bottom of the channel.
Our suggestion: Follow the A.I. trend analysis and practice good money management on all of your trades. Look for pullbacks in the stock if the overall a.i. guidance is bullish.
We will re-evaluate our opinion based upon new data that affects the following which we have elaborated on in this study:
- Wall Street Analysts’ Estimates
- 52-week high and low boundaries
- Vantagepoint A.I. Forecast (Predictive Blue Line)
- Neural Network Forecast
- Daily Range Forecast
- Intermarket Analysis
IBM ($IBM) deserves to be on your trading radar – we think there will be numerous swing opportunities in IBM.
Let’s Be Careful Out There!
Remember, It’s Not Magic.
It’s Machine Learning.

IMPORTANT NOTICE!
THERE IS SUBSTANTIAL RISK OF LOSS ASSOCIATED WITH TRADING. ONLY RISK CAPITAL SHOULD BE USED TO TRADE. TRADING STOCKS, FUTURES, OPTIONS, FOREX, AND ETFs IS NOT SUITABLE FOR EVERYONE.
DISCLAIMER: STOCKS, FUTURES, OPTIONS, ETFs AND CURRENCY TRADING ALL HAVE LARGE POTENTIAL REWARDS, BUT THEY ALSO HAVE LARGE POTENTIAL RISK. YOU MUST BE AWARE OF THE RISKS AND BE WILLING TO ACCEPT THEM IN ORDER TO INVEST IN THESE MARKETS. DON’T TRADE WITH MONEY YOU CAN’T AFFORD TO LOSE. THIS ARTICLE AND WEBSITE IS NEITHER A SOLICITATION NOR AN OFFER TO BUY/SELL FUTURES, OPTIONS, STOCKS, OR CURRENCIES. NO REPRESENTATION IS BEING MADE THAT ANY ACCOUNT WILL OR IS LIKELY TO ACHIEVE PROFITS OR LOSSES SIMILAR TO THOSE DISCUSSED ON THIS ARTICLE OR WEBSITE. THE PAST PERFORMANCE OF ANY TRADING SYSTEM OR METHODOLOGY IS NOT NECESSARILY INDICATIVE OF FUTURE RESULTS. CFTC RULE 4.41 – HYPOTHETICAL OR SIMULATED PERFORMANCE RESULTS HAVE CERTAIN LIMITATIONS. UNLIKE AN ACTUAL PERFORMANCE RECORD, SIMULATED RESULTS DO NOT REPRESENT ACTUAL TRADING. ALSO, SINCE THE TRADES HAVE NOT BEEN EXECUTED, THE RESULTS MAY HAVE UNDER-OR-OVER COMPENSATED FOR THE IMPACT, IF ANY, OF CERTAIN MARKET FACTORS, SUCH AS LACK OF LIQUIDITY. SIMULATED TRADING PROGRAMS IN GENERAL ARE ALSO SUBJECT TO THE FACT THAT THEY ARE DESIGNED WITH THE BENEFIT OF HINDSIGHT. NO REPRESENTATION IS BEING MADE THAT ANY ACCOUNT WILL OR IS LIKELY TO ACHIEVE PROFIT OR LOSSES SIMILAR TO THOSE SHOWN.

