

As 2021 comes to an end, what traders, investors and portfolio managers do is evaluate their performance.
- How did they do in comparison to the broader Stock Market Indexes?
- How did they do in comparison to Money Supply Growth?
- How did they do in comparison to Inflation?
- Did they successfully navigate the potholes and landmines by avoiding bad trades and investment decisions?
These are the important questions that traders and investors face as they contemplate the future.
So, let’s do a very quick recap of some of the important economic metrics of 2021.
Throughout 2021, the Fed told us that their inflation target was 2%. As we hit the 4th quarter the CPI showed 6.8% inflationary growth. This metric is vitally important to constantly monitor because it directly communicates the loss of purchasing power that has occurred in the economy. So, the very first thing that you need to concern yourself with is that 6.8% inflation means you need to have made that much of a return just to break even on your portfolio. Another way, to look at this metric is subtract this amount from whatever your gains or losses were for the year to determine what your real rate of return actually was.
Next, we look at Money Supply growth. The Federal Reserve has changed some of the transparency on Money Supply metrics; what we do know is that Money Supply as measured by M2 grew at over 12% for the entire year. What this metric tells us is that 12% more dollars were added to the economy. If those dollars do not produce any new economic growth that would imply that we would have 12% inflation in the future. If those dollars produce an equivalent amount of economic growth that would imply that we would have zero inflation in the future. Here’s a good thought exercise: simply assume a worst-case scenario that 12% more money becomes a baseline inflation probability. Now you can plan your finances accordingly. This exercise brings into clear focus that you need a minimum 12% growth in your investments and portfolio growth just to break even. While this estimate initially sounds fatalistic, its purpose is to brace your
finances for a worst-case scenario. In other words, let’s plan for the future assuming that if inflation were to grow to 12% that you would need this much more money just to maintain your purchasing power.
Next, let’s look at the balance sheet of the Federal Reserve and compare its growth year over year.
- Throughout 2021, the Fed was purchasing $120 billion of Treasury Bonds every month along with corporate and junk bond debt in their efforts to support the economy.
- In December 2020 the Fed Balance sheet was $7.324 trillion.
- Today it stands at $8.4 trillion.
That represents a growth rate of 14.8%. This number becomes vitally important because in recent Fed announcements they have said that they are planning to taper their bond purchases within the next 4 months entirely and are planning three interest rate increases in 2022.
Long time readers of this blog know that I consider interest rate manipulation by the Fed to be a malignancy on the economy. Currently, the 10-year Treasury Note is yielding 1.539%. If inflation is printing at 6.8% that results in a negative yield of -5.261%! This metric, which is the real risk-free rate of return, tells investors and traders how much money they will make when they invest in the full faith and credit of the United States Government. Who do you know that will put their money into U.S. Treasuries when they are guaranteed a loss?
In my opinion, this metric also explains why we are seeing a melt up in financial assets. Since savers are penalized for trying to save their only option is to enter into the stock market to chase yield and return.
“As we move into 2022, there is great uncertainty on whether the Fed will be able to raise interest rates.“
From the last Federal Reserve Open Market Committee meeting, announcements were made that three interest rate increases are planned for 2022 and two additional increases for 2023. What traders and investors need to ponder moving forward is how these interest rate increases EXPONENTIALLY increase the cost of servicing the
government debt moving forward. Consider this: when interest rates rise from 1.5% to 2% that is a 33% increase in interest expense needed to pay the debt. Ponder for a minute how your finances would be affected if your interest expenses on your mortgage, credit cards, etc. were raised by 33%!
I mention this important consideration not to be negative or bearish. Over the last 13 years, the Fed has been unable to taper bond purchases successfully nor have they been able to raise rates over any longer period of time. There is an equal degree of uncertainty as to who will buy government debt if the Fed no longer decides to do so.
This is a time to be honest with yourself. All of these considerations are vitally important to confront as you establish a macroeconomic thesis moving into 2022.
Lastly, you need to look at how the broader Stock Market Indexes did in 2021 and compare that value to your portfolio’s performance.
Here are the returns:
NASDAQ +63.61%
S&P 500 Index +28.49%
Russell 1000 Small Cap 26.11%
Dow Jones Industrials 20.34%
I know this is a lot of information to digest. But with inflation increasing exponentially, the bottom line can only be evaluated by constantly comparing it to the loss of purchasing power.
By engaging in this process 24/7 you can keep your finances out of harm’s way.
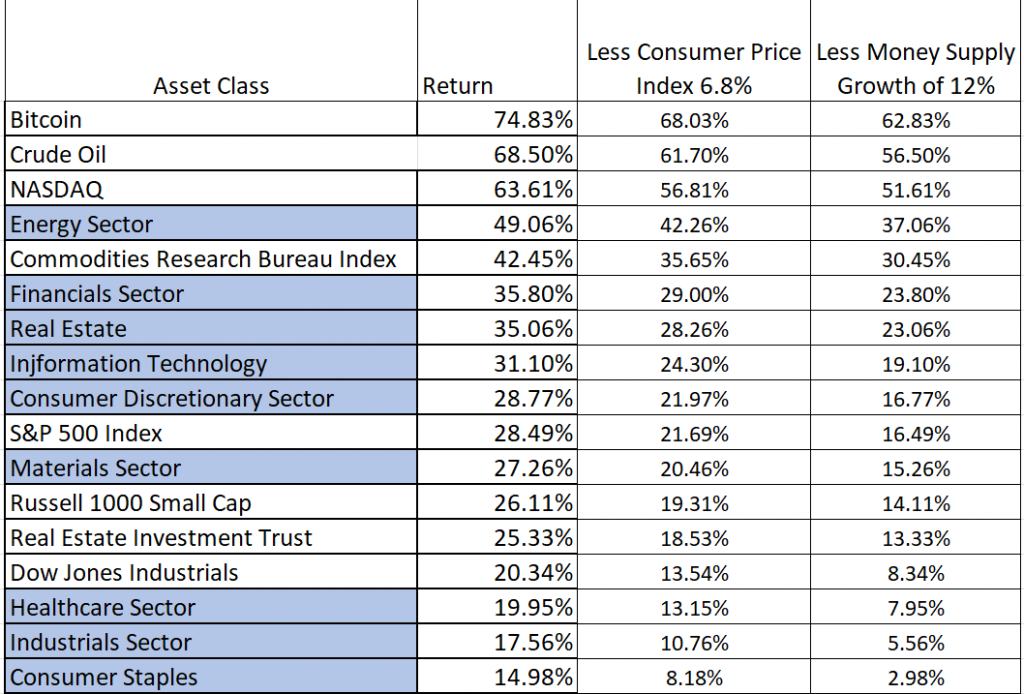
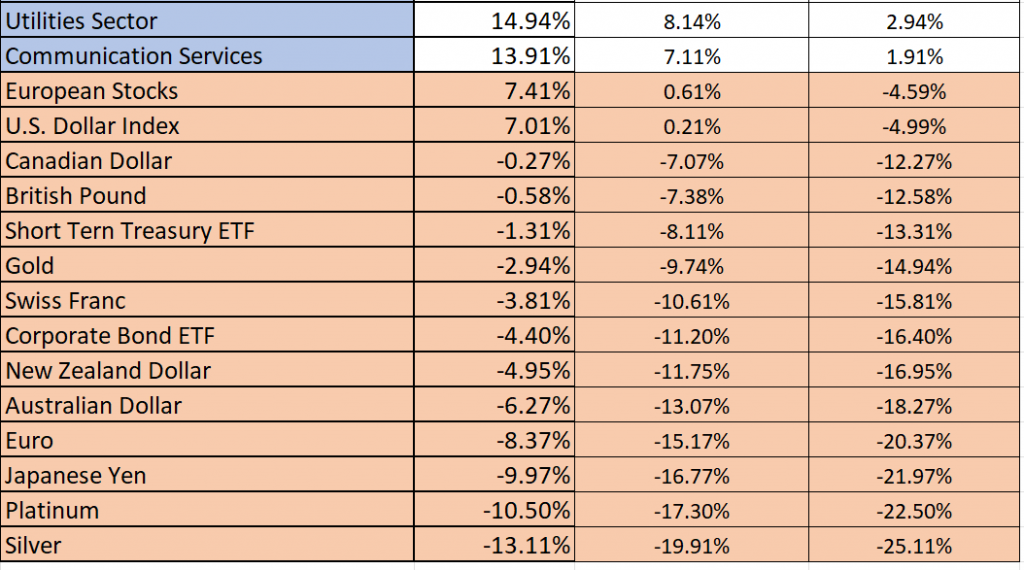
Here are the returns posted by the different asset classes and broad market sectors during 2021. I have taken the liberty of subtracting the Consumer Price Index of 6.8% in the first column and subtracting the Money Supply growth of 12% in the second column. The performance tells a very interesting story that you need to evaluate for yourself.
What are your observations as you look over those performance metrics?
How do they compare to your returns?
Opinions about the future can be very dangerous today. You need a proven method that keeps you on the right side of the right trend at the right time.
What is patently obvious is that Bitcoin, even with its massive volatility is still the fastest horse in the race. I did not include Ethereum in this analysis. Its performance was 426% which should tell you how important and vital the crypto economy has become. Ethereum is the second largest cryptocurrency, and it will be foundational for the building of decentralized finance smart contracts throughout all of the cryptocosm.
The Bigger Picture
What every individual wants to accomplish in their life is to be able to save their money and then retire when they have done the effective economic planning for their future. Retirement planning at its essence has always been about buying cash flow. Traditionally this has been done by purchasing U.S. government bonds. Just a decade ago a retiree would scrape together their life savings and if they wanted $50,000 a year in income, they would buy one million dollars of U.S. government bonds at 5%. Today with inflation at 6.8% and bonds yielding 1.5% that reality has been vaporized.
So, how are you going to navigate the terrain of the financial markets?
The race to debase is very real.
Our current economic environment is forcing traders into much shorter time frames as everyone in the marketplace chases yield.
Real asset prices will keep rising as the yield chase intensifies. Cheap capital will keep flooding the market. And our economy will continue its addiction to a horrible monetary stimulus drug that has been handed out like candy by the Federal Reserve.
Do you have the tools and ability to find the strongest trends at right time in this economic environment to protect your purchasing power as we move into 2022?
What is your plan for maintaining your purchasing power as this trend in financial uncertainty accelerates?
A.I., through advanced pattern recognition, analyzing tens of thousands of data points, and crunching millions of computations, finds the highest probability trades; it is indispensable in separating fact from fiction.
The power of artificial intelligence is designed to keep you focused on the right side of the market at the right time. A.I. is also a steadying hand in trading so that you are never trading on hope or toxic emotions.
Isaac Newton stated that “a trend in motion, tends to remain in motion until it is stopped.” The risk is too high for opinions or guesswork.
I’d like to invite you to visit with us at one of our live trainings where we show how artificial intelligence is the only means to stay consistently up to date on the risk and reward opportunities in this environment.
What all traders and investors want is an accurate, proven solution that alerts you when a high probability trend is unfolding. Vantagepoint A.I. forecasts have proven to be up to 87.4% accurate in determining the trend three days in advance.
Check out the A.I. at our Next Live Training.
It’s not magic. It’s machine learning.
Make it count.

IMPORTANT NOTICE!
THERE IS SUBSTANTIAL RISK OF LOSS ASSOCIATED WITH TRADING. ONLY RISK CAPITAL SHOULD BE USED TO TRADE. TRADING STOCKS, FUTURES, OPTIONS, FOREX, AND ETFs IS NOT SUITABLE FOR EVERYONE.
DISCLAIMER: STOCKS, FUTURES, OPTIONS, ETFs AND CURRENCY TRADING ALL HAVE LARGE POTENTIAL REWARDS, BUT THEY ALSO HAVE LARGE POTENTIAL RISK. YOU MUST BE AWARE OF THE RISKS AND BE WILLING TO ACCEPT THEM IN ORDER TO INVEST IN THESE MARKETS. DON’T TRADE WITH MONEY YOU CAN’T AFFORD TO LOSE. THIS ARTICLE AND WEBSITE IS NEITHER A SOLICITATION NOR AN OFFER TO BUY/SELL FUTURES, OPTIONS, STOCKS, OR CURRENCIES. NO REPRESENTATION IS BEING MADE THAT ANY ACCOUNT WILL OR IS LIKELY TO ACHIEVE PROFITS OR LOSSES SIMILAR TO THOSE DISCUSSED ON THIS ARTICLE OR WEBSITE. THE PAST PERFORMANCE OF ANY TRADING SYSTEM OR METHODOLOGY IS NOT NECESSARILY INDICATIVE OF FUTURE RESULTS. CFTC RULE 4.41 – HYPOTHETICAL OR SIMULATED PERFORMANCE RESULTS HAVE CERTAIN LIMITATIONS. UNLIKE AN ACTUAL PERFORMANCE RECORD, SIMULATED RESULTS DO NOT REPRESENT ACTUAL TRADING. ALSO, SINCE THE TRADES HAVE NOT BEEN EXECUTED, THE RESULTS MAY HAVE UNDER-OR-OVER COMPENSATED FOR THE IMPACT, IF ANY, OF CERTAIN MARKET FACTORS, SUCH AS LACK OF LIQUIDITY. SIMULATED TRADING PROGRAMS IN GENERAL ARE ALSO SUBJECT TO THE FACT THAT THEY ARE DESIGNED WITH THE BENEFIT OF HINDSIGHT. NO REPRESENTATION IS BEING MADE THAT ANY ACCOUNT WILL OR IS LIKELY TO ACHIEVE PROFIT OR LOSSES SIMILAR TO THOSE SHOWN.

