
Throughout all of 2021 Vantagepoint A.I. has been recommending that traders and investors take a good hard look at Cybersecurity companies. Early in 2021, we evaluated this sector as one of the areas that we felt had huge upside potential and very little downside. As we approach the end of 2021, we still think this sector is ripe with opportunity.
In this analysis, we will be studying Radware (RDWR). Radware Ltd. engages, develops, manufactures, and markets cyber security and application delivery solutions for applications in physical, virtual, cloud, and software defined data centers. The company’s expected earnings growth rate for the 2021 is 20.3%. Since COVID-19 and the pandemic began the company has increased in share price by 90%. Radware is a global leader in the field, and boasts over 12,500 enterprise and carrier customers globally
Radware has recently started negotiations to sell the company to the private equity firm Siris Capital. As cyber threats continue to surge by the day, Venture Capital and Hedge Funds see the upside potential that cybersecurity represents. Wall Street is monitoring these discussions closely and could lead to buyouts of other cybersecurity companies in 2022.
In a nutshell, ransomware is big business.
Ransomware attacks cause downtime, data loss, possible intellectual property theft, and in certain industries an attack is considered a data breach. Everything you have stored in a digital format is vulnerable.
Radware ($RDWR) has a market cap of $1.84 billion and trades 376,000 average volume on the NASDAQ. They generate about $250 million in revenue each year. Radware went public in September 1999 at 13.25 per share.
In this weekly stock study, we will look at and analyze the following indicators and metrics as are our guidelines which dictate our behavior in deciding whether to buy, sell, or stand aside on a particular stock.
- Wall Street Analysts’ Estimates
- 52-week high and low boundaries
- Best Case-Worst Case Analysis
- Vantagepoint A.I. Forecast (Predictive Blue Line)
- Neural Network Forecast
- Daily Range Forecast
- Intermarket Analysis
- Our trading suggestion
We don’t base our trading decisions on things like earnings or fundamental cash flow valuations. However, we do look at them to better understand the financial landscape that a company is operating under.
Analysts Ratings
Analysts on Wall Street have recently upgraded their ratings and estimates on Radware. Based on 4 Best Performing Wall Street analysts offering 12-month price targets for Radware in the last 3 months. The average price target is $41.83 with a high forecast of $42.50 and a low forecast of $41.00. The average price target represents a 4.44% change from the last price of $40.05.
52-week High-Low Chart
Readers of this blog will attest to the fact that we are huge believers in monitoring where a stock is trading in relation to its 52-week range. Our perspective is that winners continuously make new 52-week highs, and we want to be on board for those types of moves.
Over the last 52 weeks RDWR has traded as high as 41.37 and as low as 24.93. This means provides us with an annual trading range of $16.44 When we divide this metric by 52 weeks, we can determine that the average weekly trading range for RDWR is $.31. What we often like to do as well is to divide the annual trading range (16.44) by the current price ($41.93) this gives us a very basic estimate of annualized volatility. Current annualized volatility is 39.2%. This metric essentially tells us that in one year, we can expect RDWR to be trading 39% higher of lower from current levels.
We refer to these as the commonsense metrics which we use as baseline measurements of understanding normal value. When using artificial intelligence, we look to amplify our returns based upon these baseline measurements.
Whenever we trade, we always pay attention to where we are in relation to the 52-week trading range. It is very common to see the 52-week high provide very strong resistance to the market until it is breached. Often when the 52-week high is breached we will see the stock price explode higher very quickly over a very short period.
The chart below is a two-year weekly chart of Radware ($RDWR) This chart gives us a very good longer term perspective of the longer-term trend and areas of support and resistance on the chart.
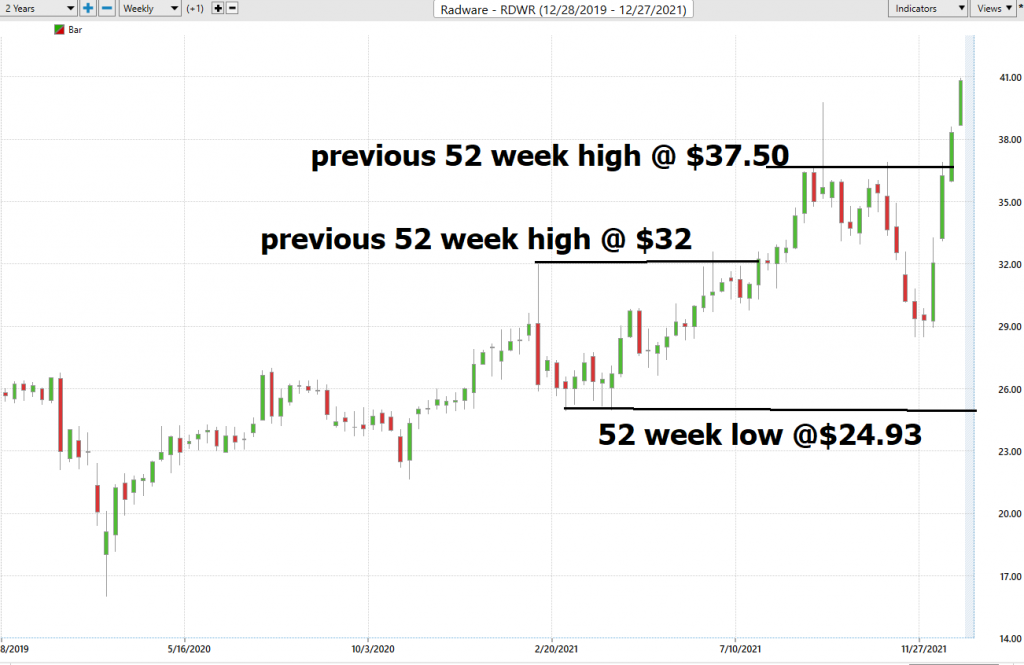
Just a quick eyeballing of the chart and you can see that the recent 52 week high at $37.50 was major resistance to RDWR price advancing.
What we like about this situation is threefold.
Wall Street Analysts are aggressively raising their estimates.
RDWR just made a new 52 week high. (It is trading at new all-time highs.)
The company is in discussions to sell itself to Siris Capital.
Combine all three of these and you have a potentially explosive price advance.
Best Case – Worst Case Scenarios
Next, we want to look at the trend over the past year and then compare RDWR to the major stock market indexes.
Over the past year:
RDWR is UP + 48.3%
S&P 500 Index +28.9%
Down Jones Industrials +19.7%%
NASDAQ +63.05%
Russell 1000 Stock Index is up + 25.09%
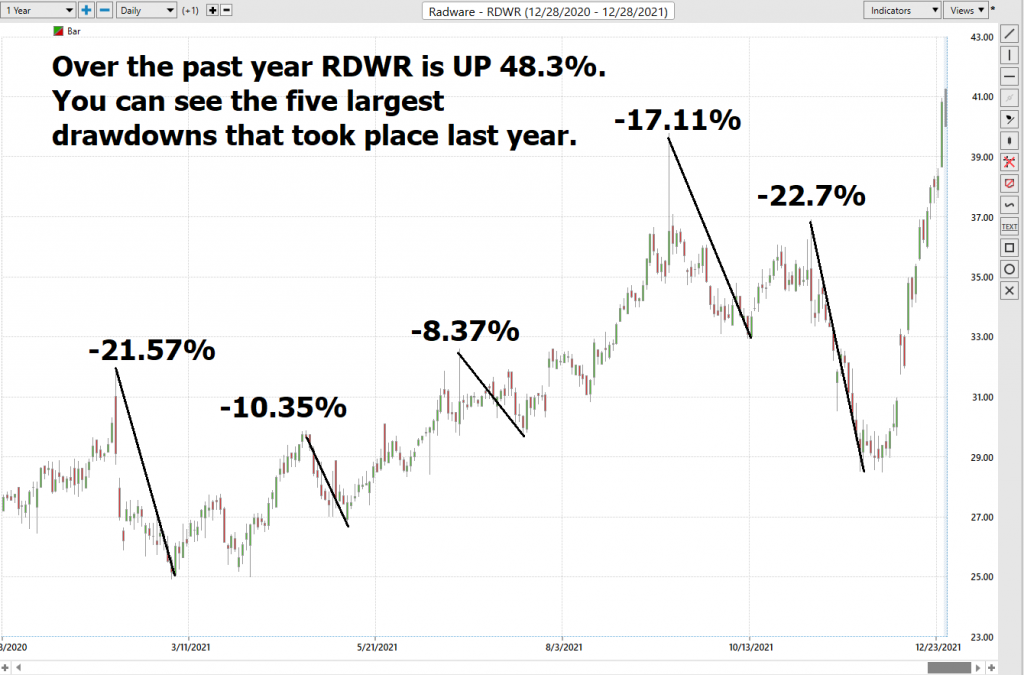
So, in RDWR we have an asset which has outperformed everything but the NASDAQ. In the past year the worst-case downside was -22.7%.
What can we learn from these drawdowns? Anytime the market dips 15% peak to trough, have this asset on your radar and wait for guidance from the artificial intelligence.
The Vantagepoint A.I. Analysis
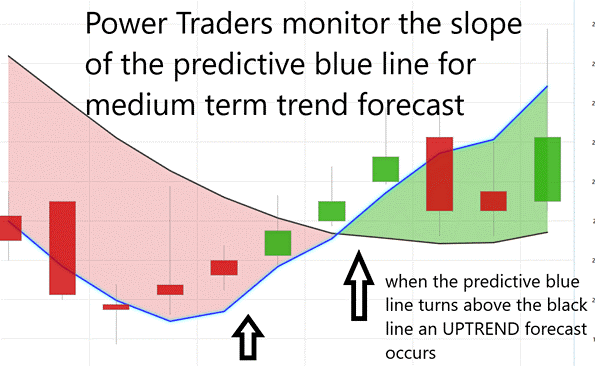
Using VantagePoint Software and the artificial intelligence, traders are alerted to trend forecasts by monitoring the slope of the predictive blue line. The black line is a simple 10 day moving average of price which simply tells you what has occurred in the market. The predictive blue line also acts as value zone where in uptrends traders try to purchase the asset at or below the blue line.
Alvin Toffler the famous futurist once observed “that in the future, change will happen faster and faster.” This statement has proven to be very true in financial markets. Investors who want to eliminate unnecessary drawdowns are becoming traders and looking at very short-term horizons to exploit price changes.
In studying the chart below pay close attention to the slope of the blue line. Anytime the blue line crosses the zero intercept is a trend signal. If the line crosses from down to up, an UP-trading opportunity exists. If the line crosses from Up to down the down trading opportunity exists.
You can see that over the last 6 months there were 5 trend forecasts. During a DOWN trend forecast a trader would either HEDGE their position or move to the sidelines.
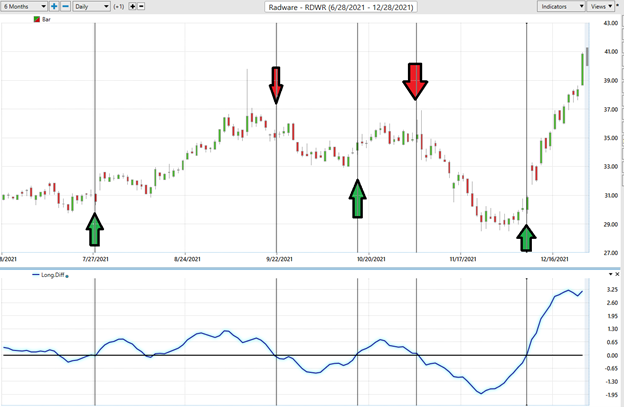
The SELL forecast on 11/3/21 resulted in prices declining 12.5% in 25 trading sessions.
The most recent UP forecaston 12/9/21 resulted in a 24.1% price increase in the last 12 days.
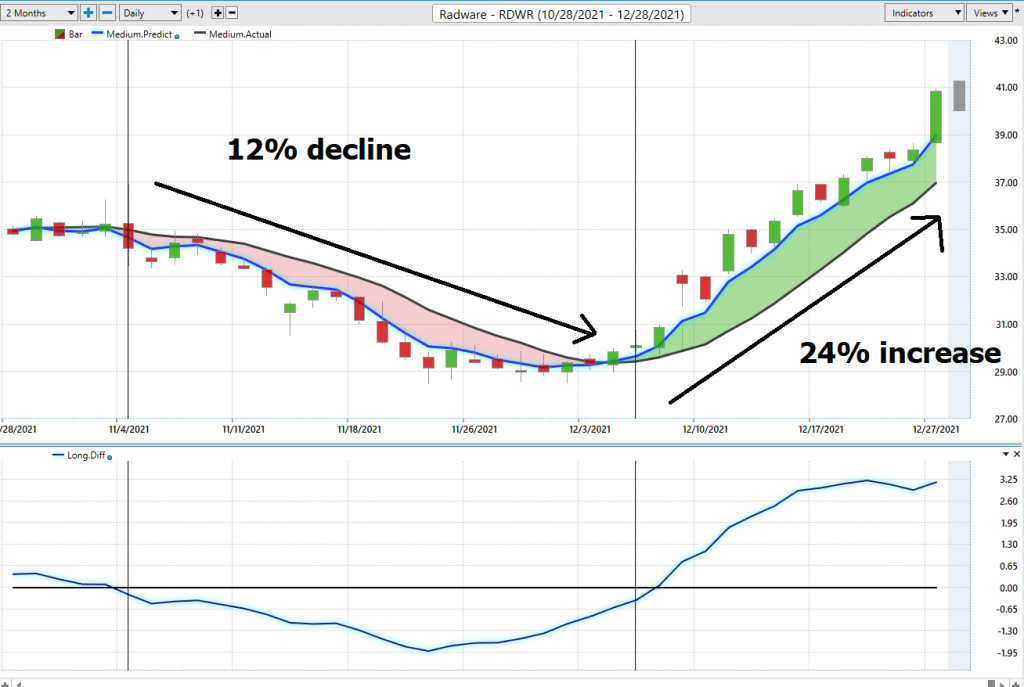
Whenever we see the predictive blue line move above the black line, we are presented with an UP-forecast entry opportunity.
Power traders use the predictive blue line in helping to determine both the value zone as well as the trend direction.
Observe how the SLOPE of the predictive blue line started moving higher a few days before its moving above the black line. A very strong trend was evidenced by seeing that price was consistently closing above the predictive blue line.
Fine Tuning Entries with The Neural Net Indicator
At the bottom of the chart is the Neural Network Indicator which predicts future strength and/or weakness in the market with a 48-to-72-hour time horizon.
A Neural Net is a computational learning system that uses a network of functions to understand and translate massive amounts of data into a desired output, consistently monitoring itself and improving its performance.
When the Neural Net Indicator is green it communicates strength. When the Neural Net is Red it is forecasting short term weakness in the market.
We advocate that Power Traders cross-reference the chart with the predictive blue line and neural network indicator to create optimal entry and exit points.
Power Traders are always looking to apply both the neural network and a.i. to the markets to find statistically sound trading opportunities.
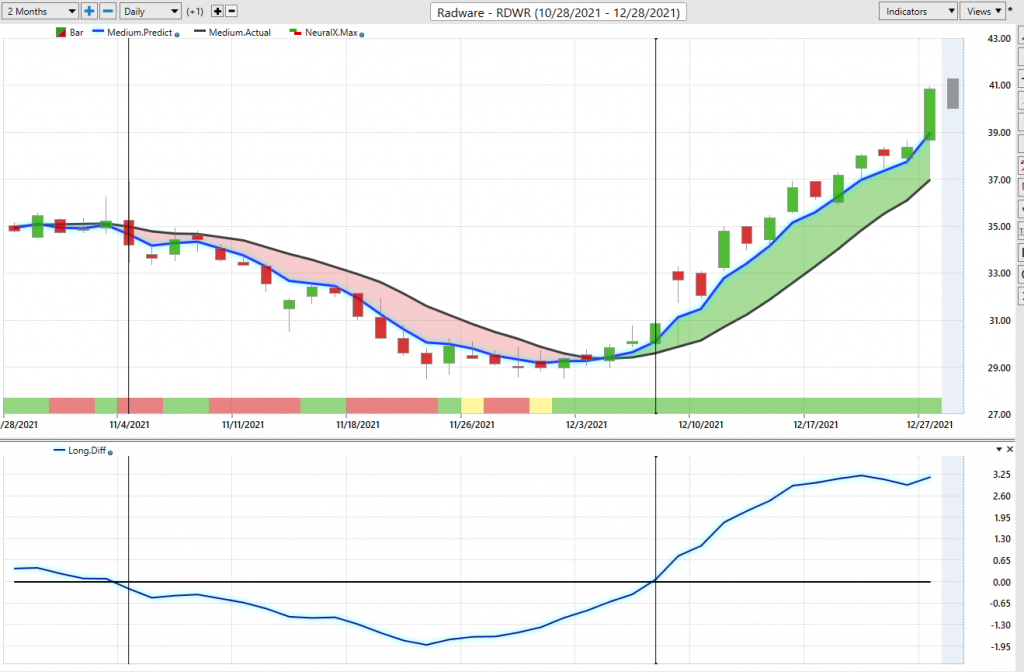
We advise Power Traders to cross reference the predictive blue line with the Neural Net for the best entry opportunities. Observe how by simply waiting for the green Neural Net to align with the predictive blue line the trading opportunity unfolded beautifully generating 24% gains in just the past few weeks.
VantagePoint Software Daily Price Range Prediction
The purpose of all these indicators so far is to help traders stay on the right side of the right trend at the right time.
One of the powerful features in the Vantagepoint A.I. Software which Power Traders use daily is the Daily Price Range prediction forecast.
This forecast is what permits Power Traders to truly fine tune their entries and exits into the market often looking for smaller time frames and more granular trading opportunities.
Here is the price chart of $RDWR during the most recent runup featuring the Daily Price Range forecast and the Neural Net Indicator.
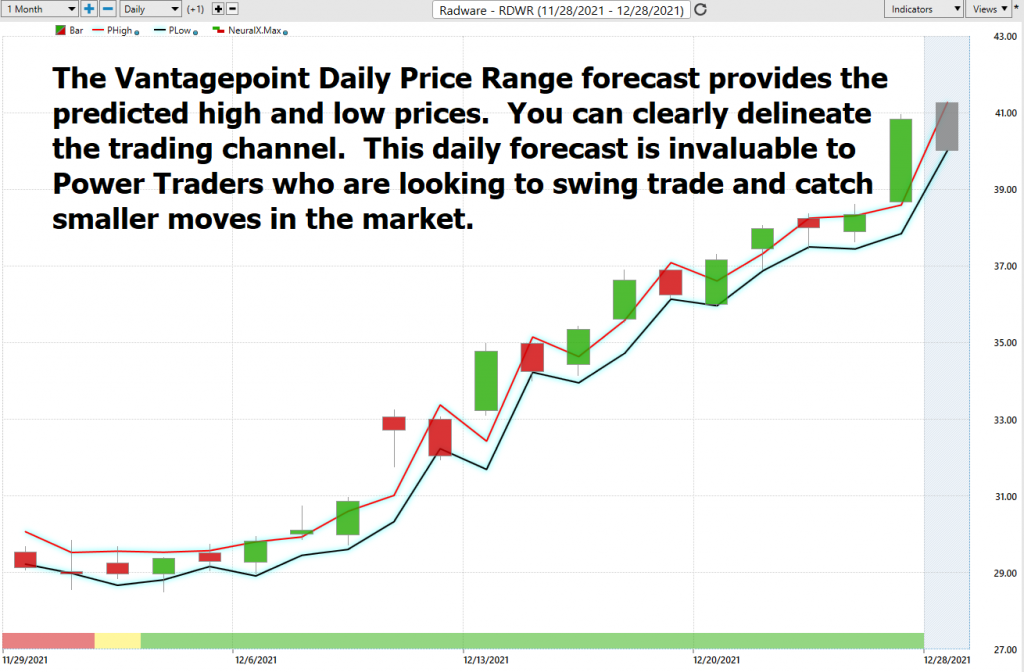
In summary, the trend turned up. Prices have surged since that forecast and the trend remained firmly UP. Traders have had numerous opportunities to purchase $RDWR towards the lower end of the daily price forecast to fine tune their entries.
Intermarket Analysis
What makes the Vantagepoint Software truly unique is its ability to perform Intermarket analysis and to locate those assets which are most interconnected that are responsible for driving the price of $RDWR higher or lower.
Studying the charts can always provide objective realities in terms of locating support and resistance levels which become very clear on a chart. But we live in a global marketplace. Everything is interconnected. The billion-dollar question for traders is always what are the key drivers of price for the underlying asset that I am trading?
These intangibles are invisible to the naked eye yet show very high statistical correlations.
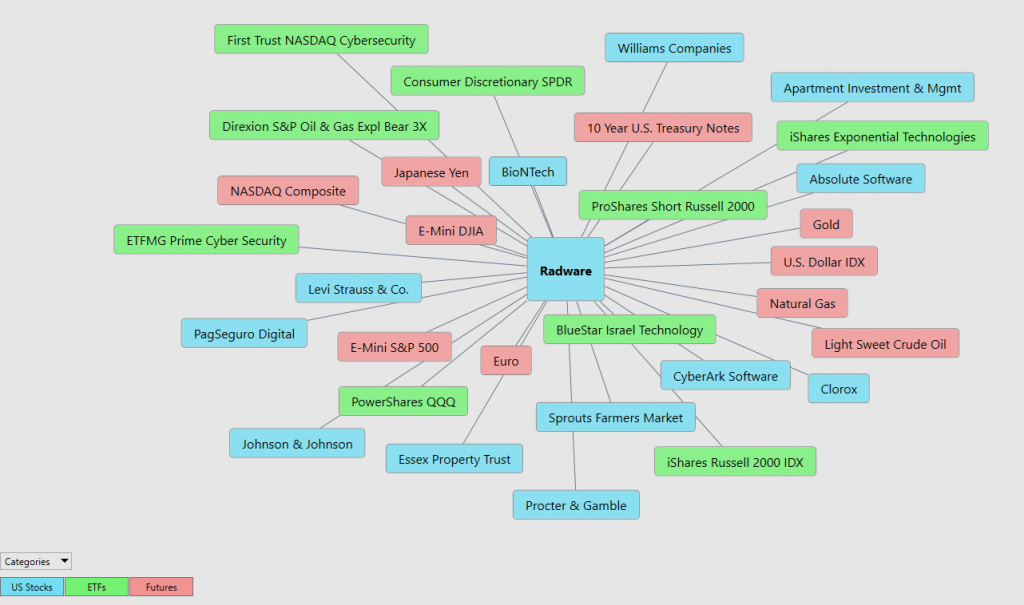
Small changes in Interest rates, Crude Oil Prices, and the Volatility of the dollar amongst thousands of other variables affect the decisions companies must make to survive in these very challenging times. Trying to determine what these factors are is one of the huge problems facing investors and traders.
There is great value to be had in studying and understanding the key drivers of $RDWR price action. As mentioned earlier in this stock analysis $RDWR is in talks to sell itself. By looking at the intermarkets regularly you can quickly find the ETF’s that own $RDWR as well as locate other cybersecurity opportunities that are faring equally well in this environment.
This is an amazing research tool that consistently uncovers future gems.
Our Suggestion
The one factor that separates great traders from amateurs is money management.
An amateur trader will risk their entire portfolio on one trade and lives for the adrenalin rush that the risk creates.
We like $RDWR.
It is trading at all-time highs.
It might get bought out.
The next earnings call is scheduled for February 9, 2022. Momentum is very strong on this asset. Earnings are forecasted to grow by 20% next year.
Buy any breaks in the price action. Whenever you trade a highflyer like $RDWR we recommend extreme money management. You must brace yourself for massive volatility. This is a perfect stock for experienced swing traders.
We will look for opportunities of sudden breaks in the market if the a.i. forecast remains UP to scale in small positions with tight stop losses.
Let’s Be Careful Out There!
Remember, It’s Not Magic.
It’s Machine Learning.

IMPORTANT NOTICE!
THERE IS SUBSTANTIAL RISK OF LOSS ASSOCIATED WITH TRADING. ONLY RISK CAPITAL SHOULD BE USED TO TRADE. TRADING STOCKS, FUTURES, OPTIONS, FOREX, AND ETFs IS NOT SUITABLE FOR EVERYONE.
DISCLAIMER: STOCKS, FUTURES, OPTIONS, ETFs AND CURRENCY TRADING ALL HAVE LARGE POTENTIAL REWARDS, BUT THEY ALSO HAVE LARGE POTENTIAL RISK. YOU MUST BE AWARE OF THE RISKS AND BE WILLING TO ACCEPT THEM IN ORDER TO INVEST IN THESE MARKETS. DON’T TRADE WITH MONEY YOU CAN’T AFFORD TO LOSE. THIS ARTICLE AND WEBSITE IS NEITHER A SOLICITATION NOR AN OFFER TO BUY/SELL FUTURES, OPTIONS, STOCKS, OR CURRENCIES. NO REPRESENTATION IS BEING MADE THAT ANY ACCOUNT WILL OR IS LIKELY TO ACHIEVE PROFITS OR LOSSES SIMILAR TO THOSE DISCUSSED ON THIS ARTICLE OR WEBSITE. THE PAST PERFORMANCE OF ANY TRADING SYSTEM OR METHODOLOGY IS NOT NECESSARILY INDICATIVE OF FUTURE RESULTS. CFTC RULE 4.41 – HYPOTHETICAL OR SIMULATED PERFORMANCE RESULTS HAVE CERTAIN LIMITATIONS. UNLIKE AN ACTUAL PERFORMANCE RECORD, SIMULATED RESULTS DO NOT REPRESENT ACTUAL TRADING. ALSO, SINCE THE TRADES HAVE NOT BEEN EXECUTED, THE RESULTS MAY HAVE UNDER-OR-OVER COMPENSATED FOR THE IMPACT, IF ANY, OF CERTAIN MARKET FACTORS, SUCH AS LACK OF LIQUIDITY. SIMULATED TRADING PROGRAMS IN GENERAL ARE ALSO SUBJECT TO THE FACT THAT THEY ARE DESIGNED WITH THE BENEFIT OF HINDSIGHT. NO REPRESENTATION IS BEING MADE THAT ANY ACCOUNT WILL OR IS LIKELY TO ACHIEVE PROFIT OR LOSSES SIMILAR TO THOSE SHOWN.

