
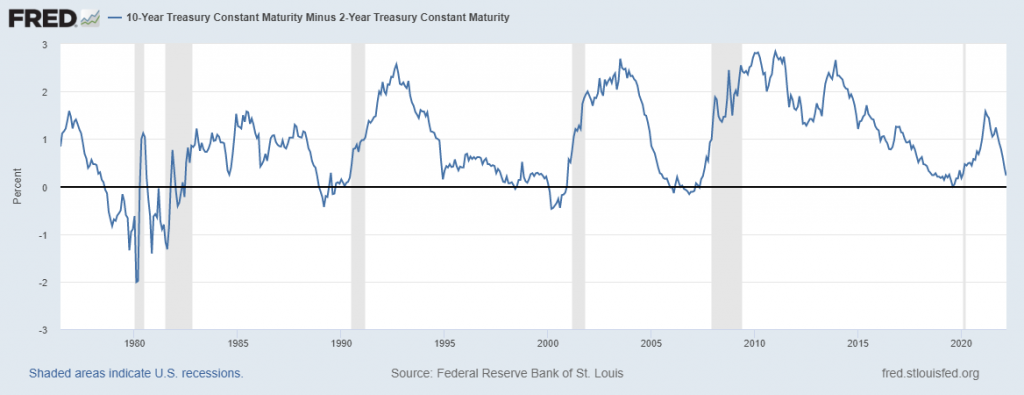
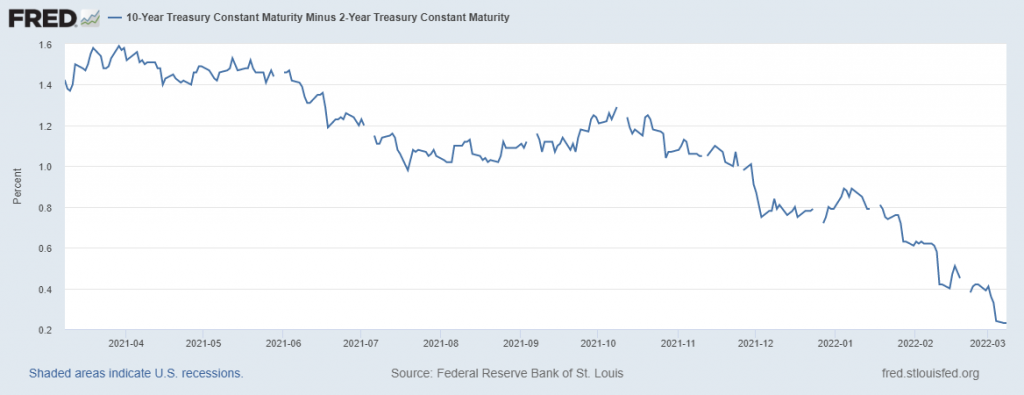
There are a handful of charts which are intimidating the world financial markets at present. The first is the spread between the 2-year t-note and the 10-year t-note. Recently this vital sector of the yield curve traded at 22 basis points. What this means is that if the Federal Reserve raises interest rates as they have promised, the yield curve will invert which has always been a precursor to a recession. The graph below shows the history of this spread for the last 45 years. The areas in gray are the time frames when the economy went into recession.
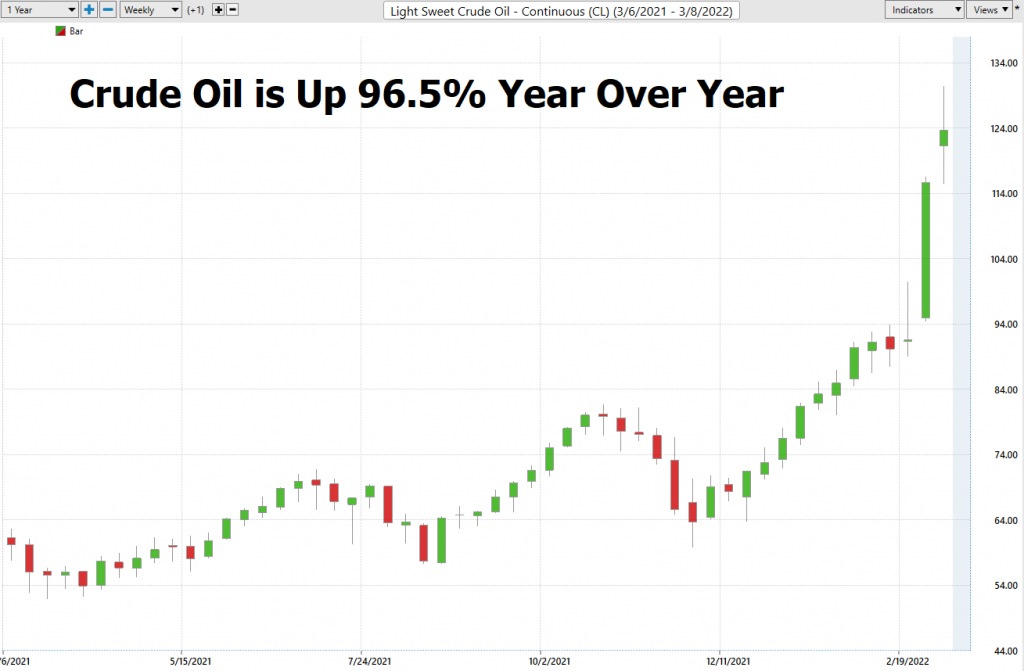
The second chart which is worthy of consideration right now is Crude Oil. With the war breaking out in Ukraine and uncertainty on the supply side of the market prices have continued moving higher. Traditionally when Crude Oil markets move higher it is a strong inflationary signal.
When we look at the economic statistics released by the government, we see an environment of increasing inflation and decreasing growth. Traditionally this is defined as STAGFLATION. It’s a treacherous economic environment. Should the Fed raise rates in this environment you will see volatility in the markets like we had during the beginning of the pandemic and lockdown.
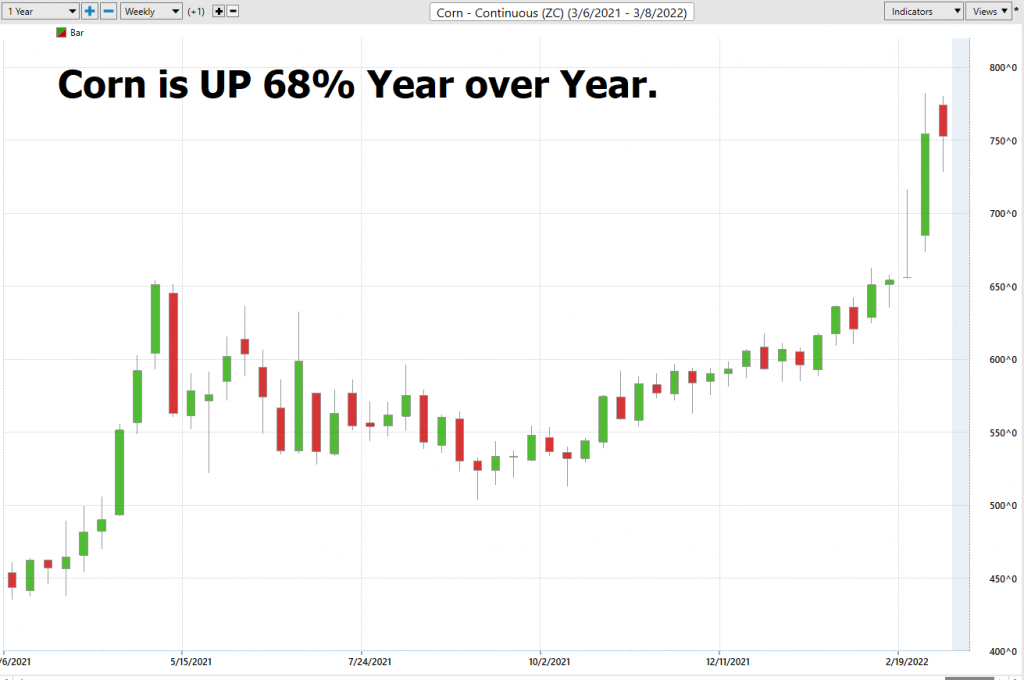
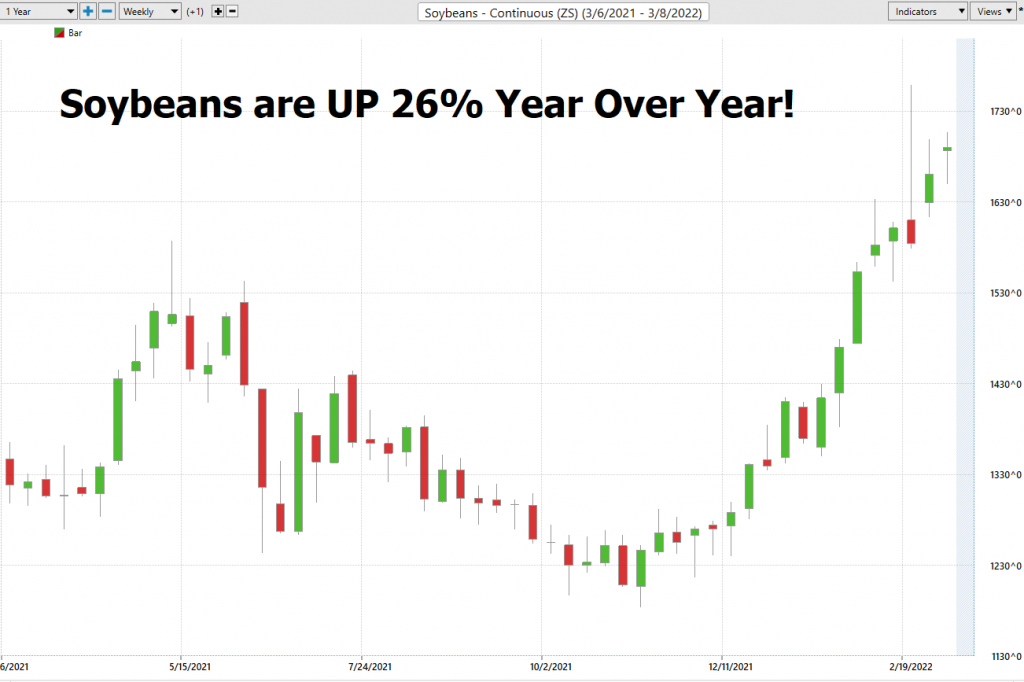
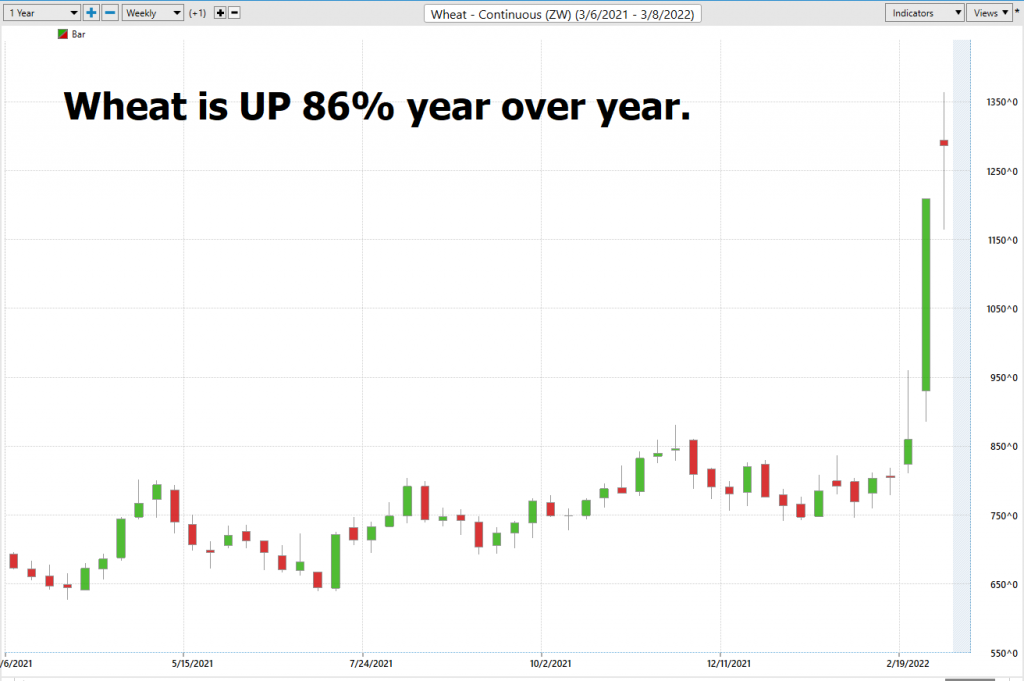
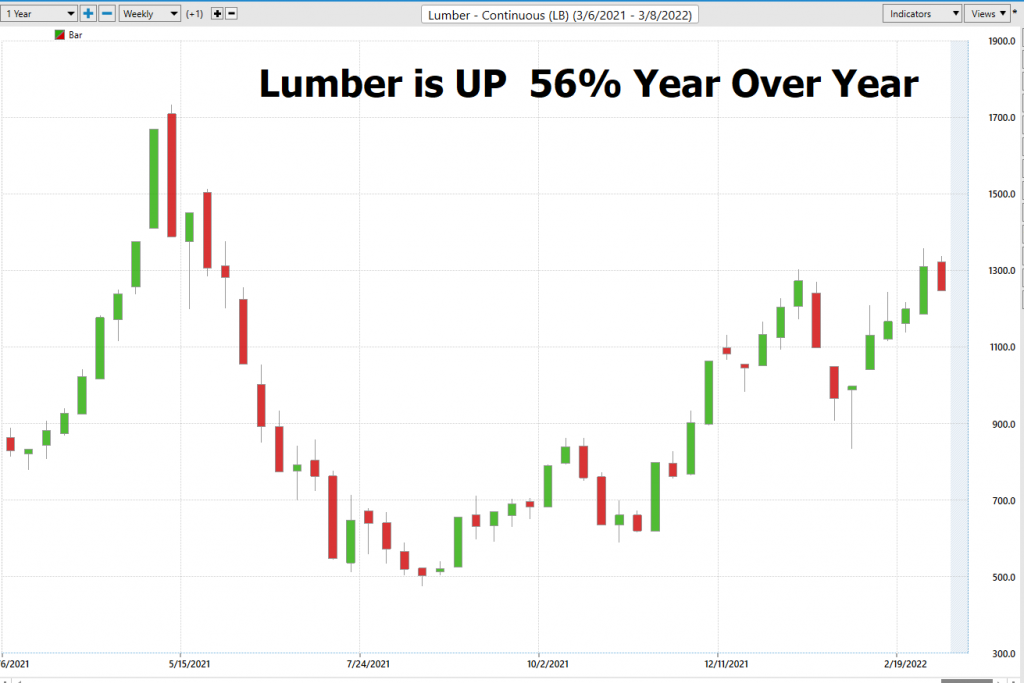
The simplest way to effectively chase yield in this kind of environment is to be very aware of what is working and what is not. Here are what the year over year returns look like at present time:
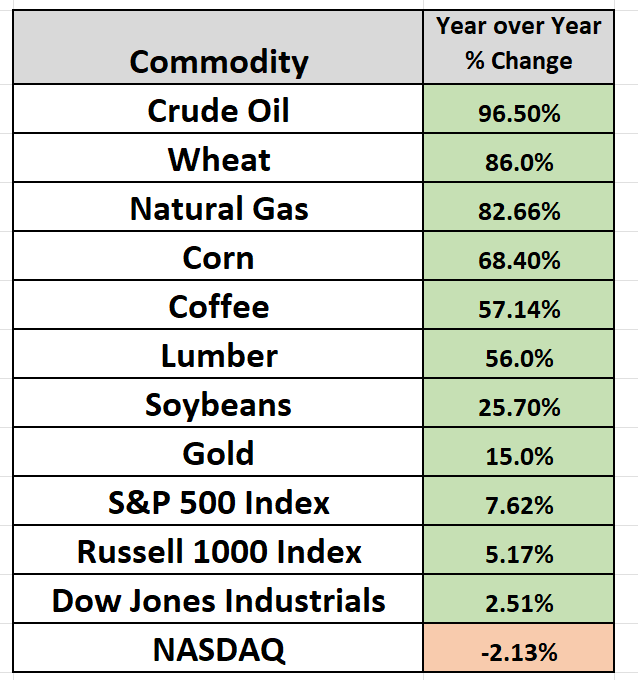
What becomes obvious is stocks are trailing the field and showing gains that are less than the CPI. Meanwhile the commodity sector is red hot.
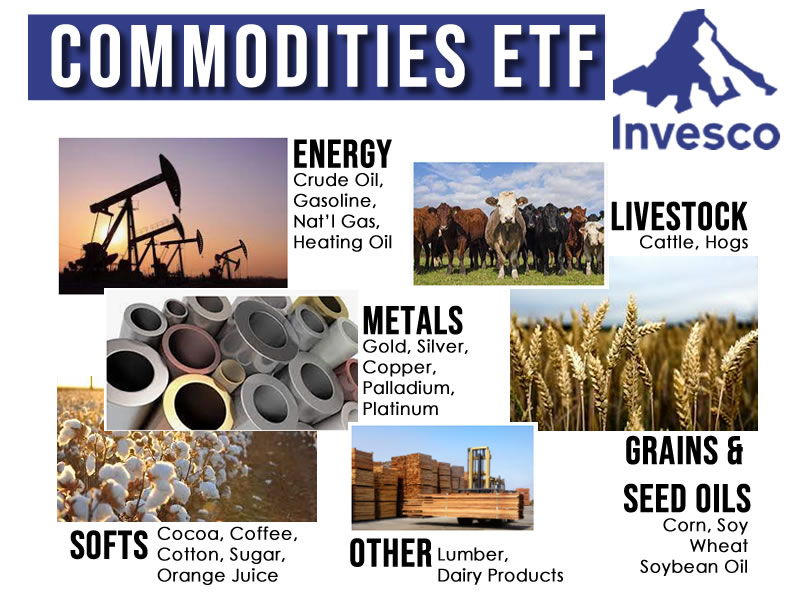
In this climate we think that a great way to protect purchasing power is to look at commodity-based ETF’s. In this brief report, we will focus on the Invesco DB Commodity Index Tracking Fund ($DBC).
We will evaluate the following metrics and indicators to determine what the best course of action is regarding $DBC trading.
- 52-week high and low boundaries
- Vantagepoint A.I. Forecast
- Neural Network Forecast
- Daily Range Forecast
- Intermarket Analysis
- Our Suggestion
52-week High-Low Chart
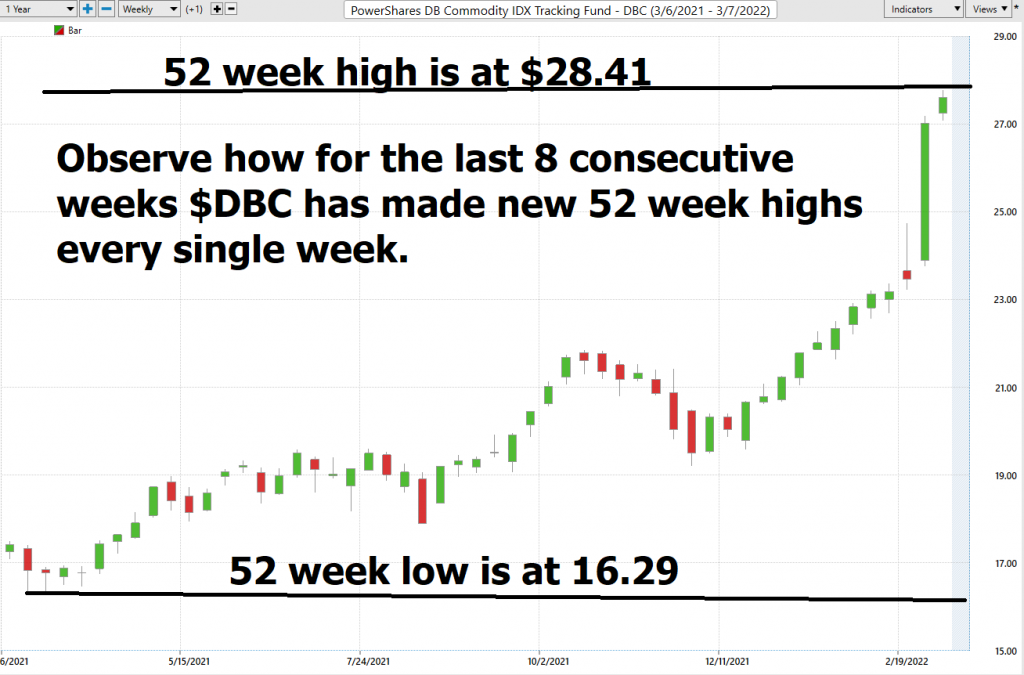
First, we want to see where we are trading in relation to the 52-week range.
Over the last 52 weeks $DBC has traded as high as $28.41 and as low as $16.29 This provides us with an annual trading range of $12.12 When we divide this metric by 52 weeks, we can determine that the average weekly trading range for $DBC is $.23.
What we often like to do as well is to divide the annual trading range ($12.12) by the current price ($28.07) to provide us with a very basic and generic calculation of how the annualized volatility for $DBC, which is currently 43.2%.
What this number tells us is that we can define NORMAL during the next year if $DBC shares trade 43.2% higher or lower. That provides us with the following trading range as predicted by this basic volatility estimate.
Projected Annualized Volatility High Price = $40.19
Projected Annualized Volatility Low Price = $15.95
We always pay attention to where we are in relation to the 52-week trading range. It’s very common to see the 52-week high provide very strong resistance to the market until it is breached. Often when the 52-week high is breached we will see the stock price explode higher very quickly over a very short period.
Secondly, observe how $DBC is approaching its 10 year high.
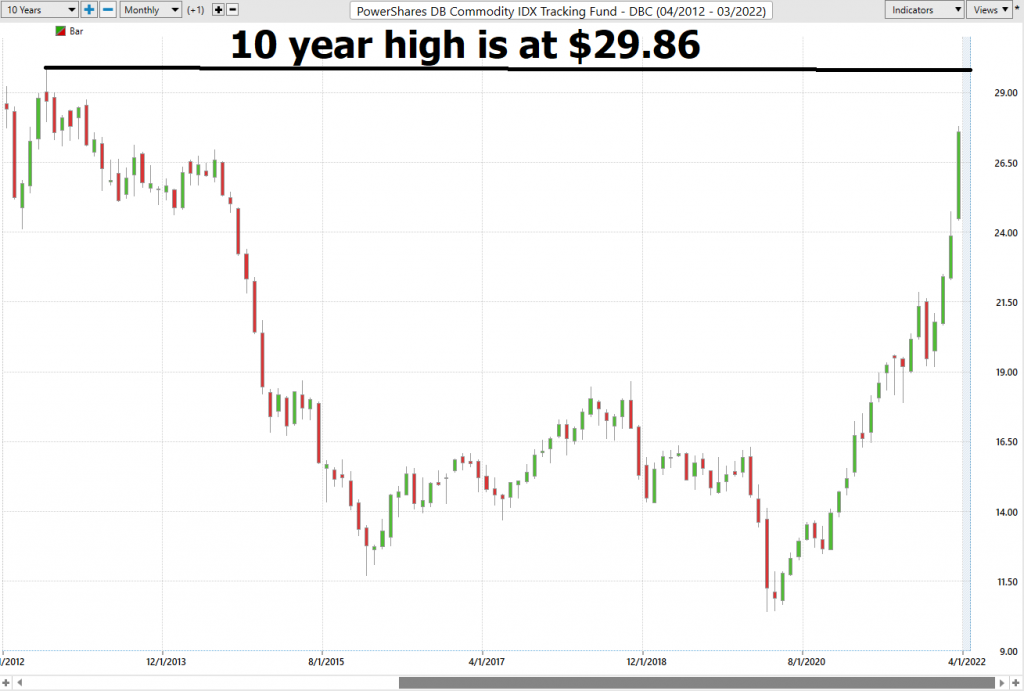
When and IF the boundary of the 10-year high at 29.86 is successfully breached you essentially are looking at confirmation that this is a very strong inflationary trend.
We think that the probability of this occurring is very high based upon all the components of this ETF. Here are some charts for you to peruse:
Best Case – Worst-Case Scenarios
Over the last year $DBC shares are up 56.02%.
When we study the long term 52-week chart we can look at the best case and worst-case scenarios just to get an eyeball perspective of the risk and volatility of this asset. This is worth doing anytime you invest or trade to monetarily understand what the potential risks and rewards have been over the past decade
Here is a snapshot of the drawdowns that $DBC has experienced over the past year measured on a percentage basis.
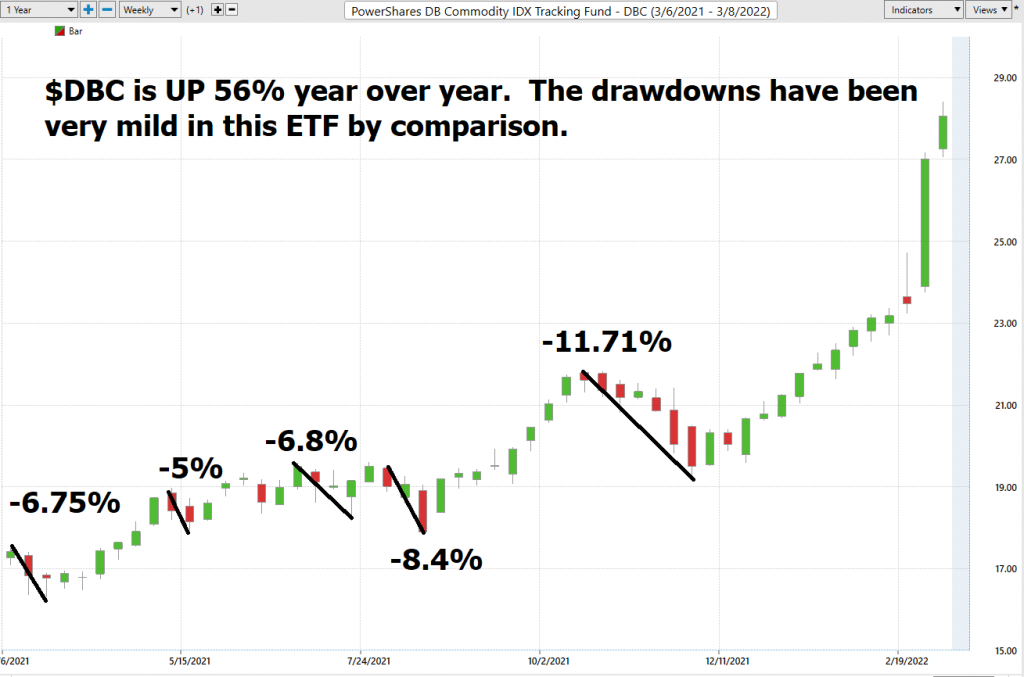
It’s worth doing this type of baseline analysis because it allows you to quickly compare understand the performance of $DBC and to understand its risk and reward possibilities.
Next, we compare $DBC to the major broad market indexes. Over the past year.
$DBC +56%
S&P 500 Index +7.62%
Down Jones Industrials +2.51%
NASDAQ -2.13%
Russell 1000 Index +5.17%
So, in $DBC have an asset which has massively outperformed the broader stock market indexes.
The Vantagepoint A.I. Analysis
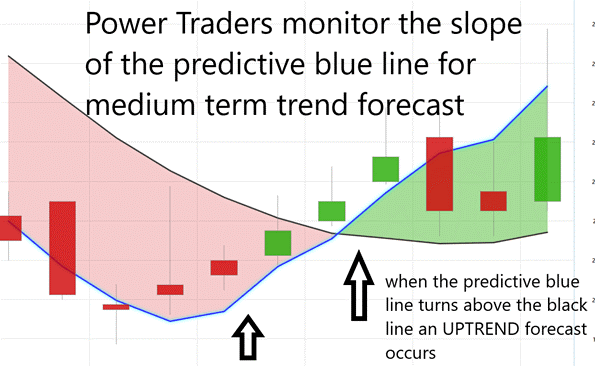
Using VantagePoint Software and the artificial intelligence, traders are alerted to trend forecasts by monitoring the slope of the predictive blue line. The black line is a simple 10 day moving average of price which simply tells you what has occurred in the market. The predictive blue line also acts as value zone where in uptrends traders try to purchase the asset at or below the blue line.
In studying the chart below pay close attention to the slope of the blue line.
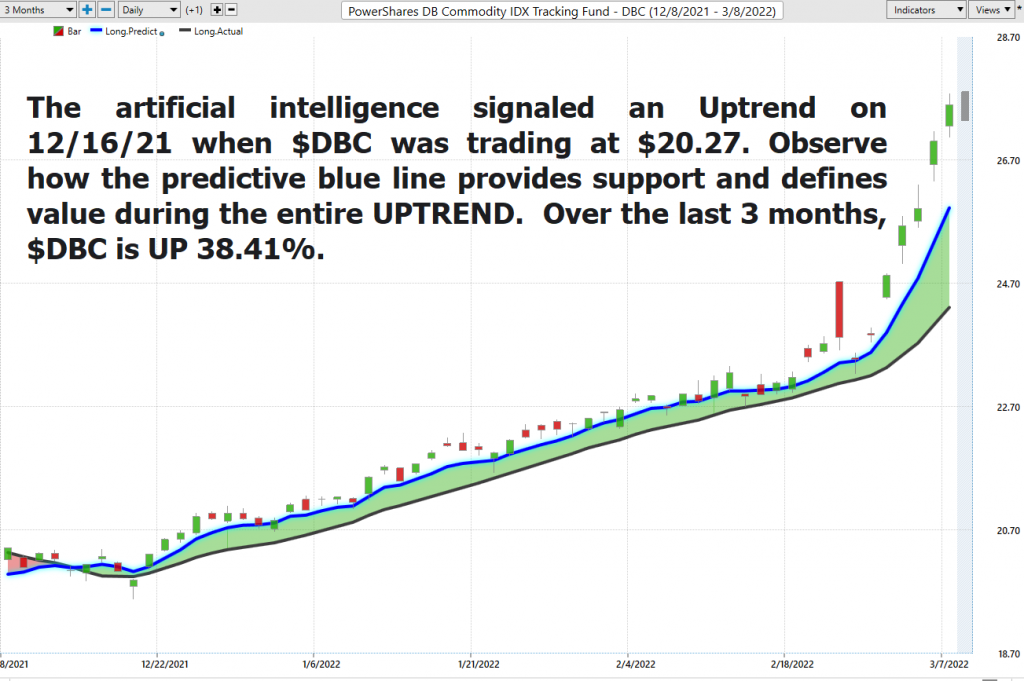
The artificial intelligence signaled an Uptrend on 12/16/21 when $DBC was trading at $20.27.
Power Traders pay close attention to the relationship between where price closes in relation to the slope of the predictive blue line.
Power traders use the predictive blue line in helping to determine both the value zone as well as the trend direction. In other words, in an uptrend traders try to buy the asset at or below the predictive blue line.
Fine Tuning Entries with The Neural Net Indicator
At the bottom of the chart is the Neural Network Indicator which predicts future strength and/or weakness in the market. When the Neural Net Indicator is green it communicates strength. When the Neural Net is Red it is forecasting short term weakness in the market.
A Neural Net is a computational learning system that uses a network of functions to understand and translate massive amounts of data into a desired output, consistently monitoring itself and improving its performance.
Whenever Power Traders are looking for statistically valid trading setups, they look for a DOUBLE confirmation signal. This signal occurs whenever the blue predictive line and the Neural Net at the bottom of the chart suggest the same future expected outcome.
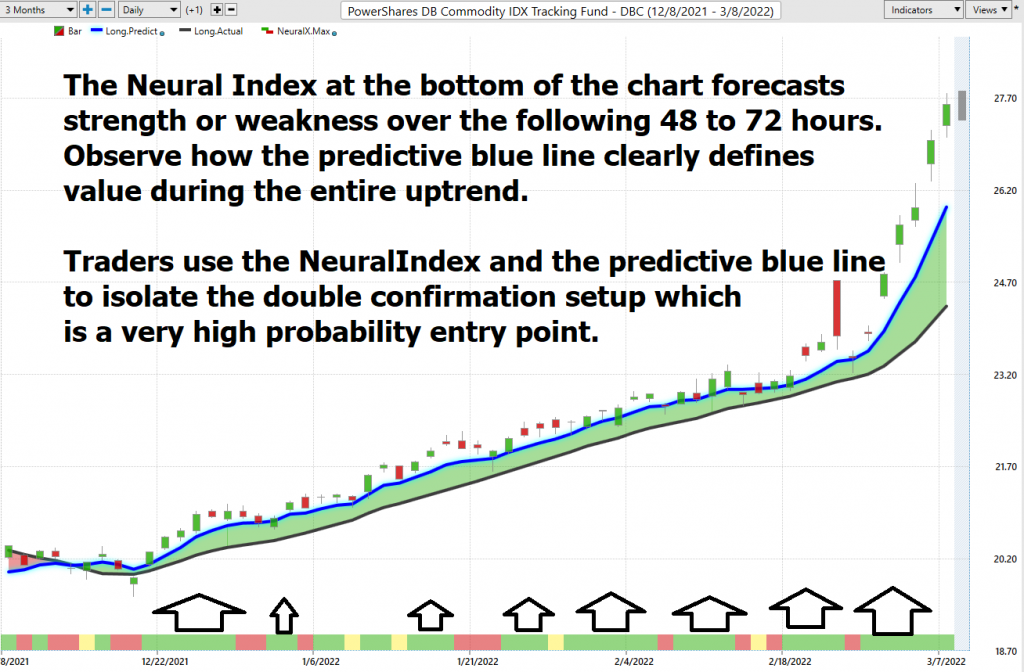
We advocate that Power Traders cross reference the chart with the predictive blue line and neural network indicator to create optimal entry and exit points.
Power Traders are always looking to apply both the neural network and a.i. to the markets to find statistically sound trading opportunities.
We advise Power Traders to cross reference the predictive blue line with the Neural Net for the best entry opportunities.
Whenever Power Traders are looking for statistically valid trading setups, they look for a DOUBLE confirmation signal. This signal occurs whenever the blue predictive line and the Neural Net at the bottom of the chart suggest the same future expected outcome.
VantagePoint Software Daily Price Range Prediction
The purpose of all these indicators so far is to help traders stay on the right side of the right trend at the right time.
One of the powerful features in the Vantagepoint A.I. Software which Power Traders use daily is the Daily Price Range prediction forecast.
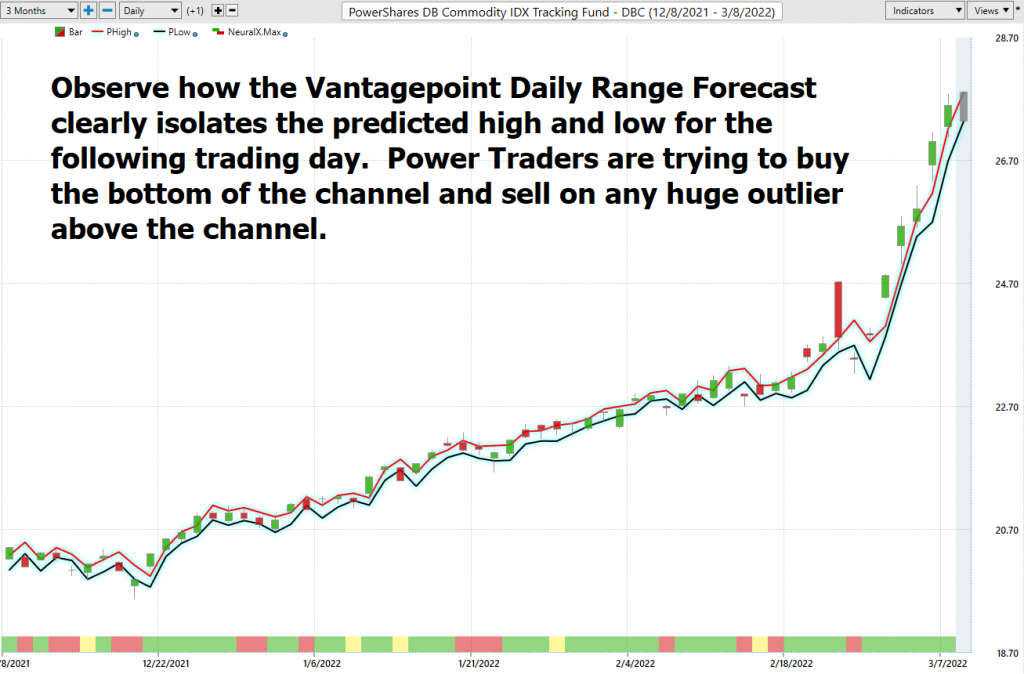
This forecast is what permits Power Traders to truly fine tune their entries and exits into the market often looking for smaller time frames and more granular trading opportunities.
In summary, the trend turned up. Prices have surged since that forecast and the trend remained firmly UP. Traders have had numerous opportunities to purchase $DBC towards the lower end of the daily price forecast to fine-tune their entries.
Intermarket Analysis
What makes the Vantagepoint Software truly unique is its ability to perform Intermarket analysis and to locate those assets which are most interconnected that are responsible for driving the price of $DBC higher or lower.
Studying the charts can always provide objective realities in terms of locating support and resistance levels which become very clear on a chart. But we live in a global marketplace. Everything is interconnected. The billion-dollar question for traders is always what are the key drivers of price for the underlying asset that I am trading?
These intangibles are invisible to the naked eye yet show extremely high statistical correlations.
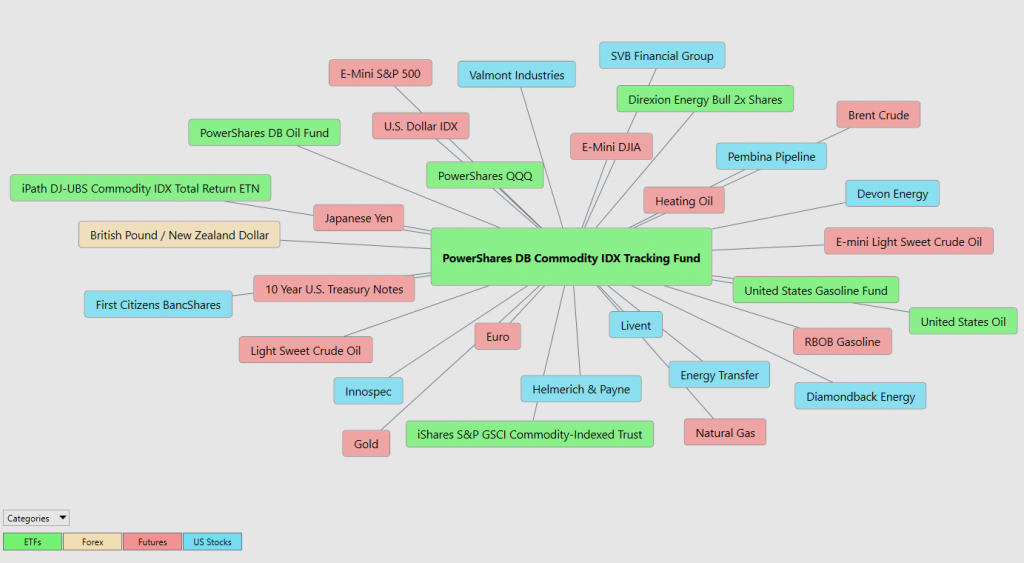
$DBC is heavily correlated to the Oil and Gas prices. It is also positive correlated to the gold price.
The allocated of $DBC as an ETF is a unique way for investors and traders to protect their purchasing power while chasing yield. The ETF has Net Assets of 2.63 billion.
Slight changes in Interest rates, Crude Oil Prices, and the Volatility of the dollar amongst thousands of other variables affect the decisions companies must make to survive in these incredibly challenging times. Trying to determine what these factors are is one of the huge problems facing investors and traders.
There is immense value to be had in studying and understanding the key drivers of $DBC price action.
Our Suggestion
Pay attention to reports about inflation.
On March 10, 2022, the CPI number will be released. Any number above last months 7.5% print will show that inflation is not transitory, and these inflationary pressures will increase in the economy.
Also pay close attention to the FOMC meeting on March 15th and 16. Fed Chairman Powell has promised to raise rates. Should he do so, the yield curve will invert and ensure a recession.
We are paying very close attention the 10-year Maturity versus the 2-year maturity to monitor the yield curve.
I wrote my opinion a few weeks ago that the yield curve is limiting the Feds ability to raise interest rates. The probabilities favor that we are on the verge of a recession. If this opinion is correct, the stagflationary pressures of increasing inflation and decreasing growth in the economy will become evident in the financial reports in the months to come.
We think inflationary pressures will continue. The commodity sector is signaling that supplies are limited, and demand is increasing. That spells higher prices.
Let the a.i. forecast guide your decisions and brace yourself for some wicked volatility.
$DBC should continue to perform exceptionally well in a stagflationary economic environment.
Let’s Be Careful Out There!
Remember, It’s Not Magic.
It’s Machine Learning.

IMPORTANT NOTICE!
THERE IS SUBSTANTIAL RISK OF LOSS ASSOCIATED WITH TRADING. ONLY RISK CAPITAL SHOULD BE USED TO TRADE. TRADING STOCKS, FUTURES, OPTIONS, FOREX, AND ETFs IS NOT SUITABLE FOR EVERYONE.
DISCLAIMER: STOCKS, FUTURES, OPTIONS, ETFs AND CURRENCY TRADING ALL HAVE LARGE POTENTIAL REWARDS, BUT THEY ALSO HAVE LARGE POTENTIAL RISK. YOU MUST BE AWARE OF THE RISKS AND BE WILLING TO ACCEPT THEM IN ORDER TO INVEST IN THESE MARKETS. DON’T TRADE WITH MONEY YOU CAN’T AFFORD TO LOSE. THIS ARTICLE AND WEBSITE IS NEITHER A SOLICITATION NOR AN OFFER TO BUY/SELL FUTURES, OPTIONS, STOCKS, OR CURRENCIES. NO REPRESENTATION IS BEING MADE THAT ANY ACCOUNT WILL OR IS LIKELY TO ACHIEVE PROFITS OR LOSSES SIMILAR TO THOSE DISCUSSED ON THIS ARTICLE OR WEBSITE. THE PAST PERFORMANCE OF ANY TRADING SYSTEM OR METHODOLOGY IS NOT NECESSARILY INDICATIVE OF FUTURE RESULTS. CFTC RULE 4.41 – HYPOTHETICAL OR SIMULATED PERFORMANCE RESULTS HAVE CERTAIN LIMITATIONS. UNLIKE AN ACTUAL PERFORMANCE RECORD, SIMULATED RESULTS DO NOT REPRESENT ACTUAL TRADING. ALSO, SINCE THE TRADES HAVE NOT BEEN EXECUTED, THE RESULTS MAY HAVE UNDER-OR-OVER COMPENSATED FOR THE IMPACT, IF ANY, OF CERTAIN MARKET FACTORS, SUCH AS LACK OF LIQUIDITY. SIMULATED TRADING PROGRAMS IN GENERAL ARE ALSO SUBJECT TO THE FACT THAT THEY ARE DESIGNED WITH THE BENEFIT OF HINDSIGHT. NO REPRESENTATION IS BEING MADE THAT ANY ACCOUNT WILL OR IS LIKELY TO ACHIEVE PROFIT OR LOSSES SIMILAR TO THOSE SHOWN.

