
![]()
One year ago, Vantagepoint A.I. issued a special report urging our customers to put Cybersecurity stocks on their radar. Our analysis focused on the unfortunate reality that cybercrime and online security breaches were becoming more commonplace and resulting in huge risks for companies all around the world.
Fragments of these cybersecurity attacks can sit dormant for months, and years, and only revive when the author wants them to begin their exploit. This type of stealth hack is the most worrisome aspect of these attacks and is forcing security administrators to re-evaluate everything about how they go about securing their protocols, information, data, and networking.
The result is we have seen an exponential increase in spending to protect security infrastructure.
As war breaks out in Ukraine headlines like the ones below have become commonplace in my newsfeed.


Like it or hate it, the reality is if the web infrastructure is damaged or threatened it affects how we do business and communicate and can be extremely costly to repair.
One of the leaders in this quickly growing niche is Checkpoint Software Technologies ($CHKP). They are engaged in providing cybersecurity solutions to governments and corporate enterprises. The company claims to have one of the most comprehensive and intuitive one-point of the control security system.
$CHKP manufactures products which include threat prevention, next generation firewalls, mobile security, and security management. Its solutions cater to the following: point of sale systems, automated teller machines, private and public cloud, and telecommunications providers.
The company is profitable and growing quickly. Currently it is trading at a PE ratio of 23.6 versus the US Software industry which is trading at a PE ratio of 41.6. The company has not had any meaningful debt for the past 5 years. As of the fourth quarter of 2021 at least thirty hedge funds held positions in the company.
Earnings for 2021 consistently beat Wall Street estimates every quarter. The company earned $7.05 per share when the Street was expecting $6.01 per share. Furthermore:
- 1-year sales growth is at +4.9%
- Profit margin (+37.6%)
- Earnings are projected to grow at 2.3% per year.
- Last year earnings beat Wall Street estimates by an average of 17% every quarter.
We think the following graphic of massive volume accompanying the recent uptrend shows huge institutional buying. When institutions buy, they do so with large orders. We are witnessing increased volume with increasing prices which is a very bullish situation. Based upon all that is going on in the world, it is easy to see why large portfolios are moving into $CHKP.

In this stock analysis, we will evaluate the following metrics and indicators to determine what the best course of action is regarding $CHKP stock trading.
- Wall Street Analysts’ Estimates
- 52-week high and low boundaries
- Vantagepoint A.I. Forecast (Triple Cross)
- Neural Network Forecast
- Daily Range Forecast
- Intermarket Analysis
- Our Suggestion
We don’t base decisions on things like earnings or fundamental cash flow valuations. However, we do look at them to better understand the financial landscape that a company is operating under.
Analysts Ratings
The very first thing we like to do in our analysis is to take a quick look at what the Wall Street Analysts are thinking about $CHKP.
Based on 16 Wall Street analysts offering 12-month price targets for Check Point in the last 3 months. The average price target is $133.69 with a high forecast of $157.00 and a low forecast of $105.00. The average price target represents a -7.10% change from the last price of $143.90.
This tells us that the brightest minds on Wall Street which watch the stock full time think that $CHKP has analysts believing it is both undervalued and overvalued simultaneously. This should see higher than normal volatility which is perfect for Power Traders.
52-week High-Low Chart
Next, we want to see where we are trading in relation to the 52-week range.
Over the last 52 weeks $CHKP has traded as high as $147.08 and as low as $107.85 This provides us with an annual trading range of $39.21 When we divide this metric by 52 weeks, we can determine that the average weekly trading range for $CHKP is $.75.
What we often like to do as well is to divide the annual trading range ($39.21) by the current price ($143.90) to provide us with a very basic and generic calculation of how the annualized volatility for $CHKP, which is currently 27.2%.
What this number tells us is that we can define NORMAL during the next year if $CHKP shares trade 27.2% higher or lower. That provides us with the following trading range as predicted by this basic volatility estimate.
Projected Annualized Volatility High Price = $183.11
Projected Annualized Volatility Low Price = $104.69
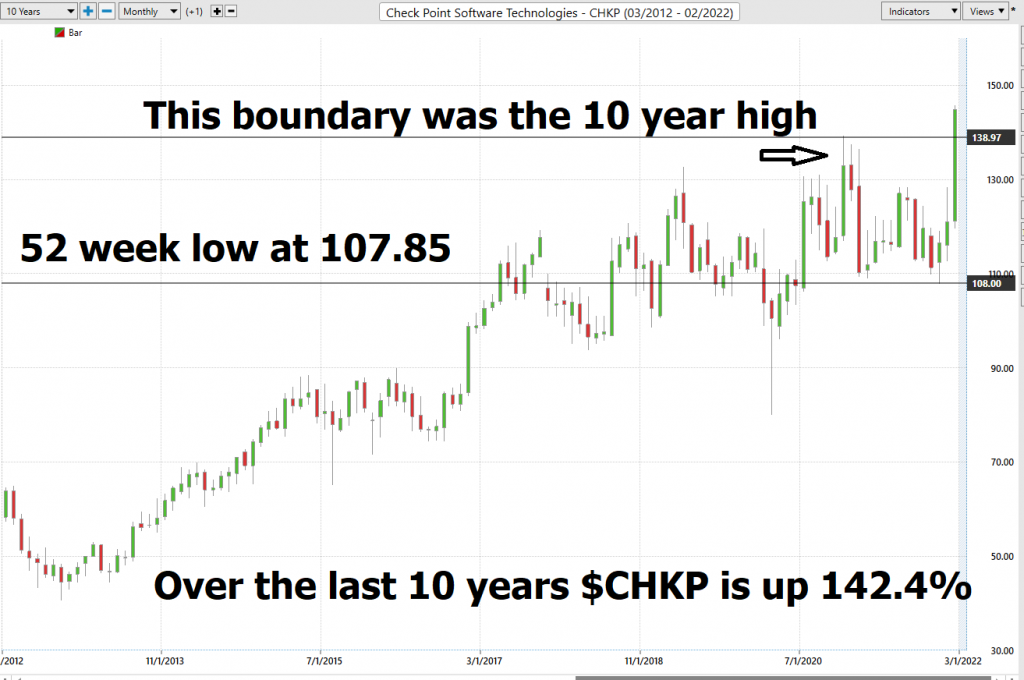
Whenever we trade, we always pay attention to where we are in relation to the 52-week trading range. It is very common to see the 52-week high provide very strong resistance to the market until it is breached. Often when the 52-week high is breached we will see the stock price explode higher very quickly over a very short period. Currently in $CHKP we have an extremely unique and powerful setup which has developed. The company recently went to new 52-week highs which also simultaneously break its 10-year high boundary. Our experience has been that when a company successfully breaches a 10-year high and 1 year high you should pay attention and place this candidate on your radar. These instances are rare and are indicative of a company that is consistently growing.
Best Case – Worst-Case Scenarios
Over the last 10 years $CHKP shares are up 142.4%.
When we study the long term 52-week chart we can look at the best case and worst-case scenarios just to get an eyeball perspective of the risk and volatility of this asset. This is worth doing anytime you invest or trade to monetarily understand what the potential risks and rewards have been over the past decade
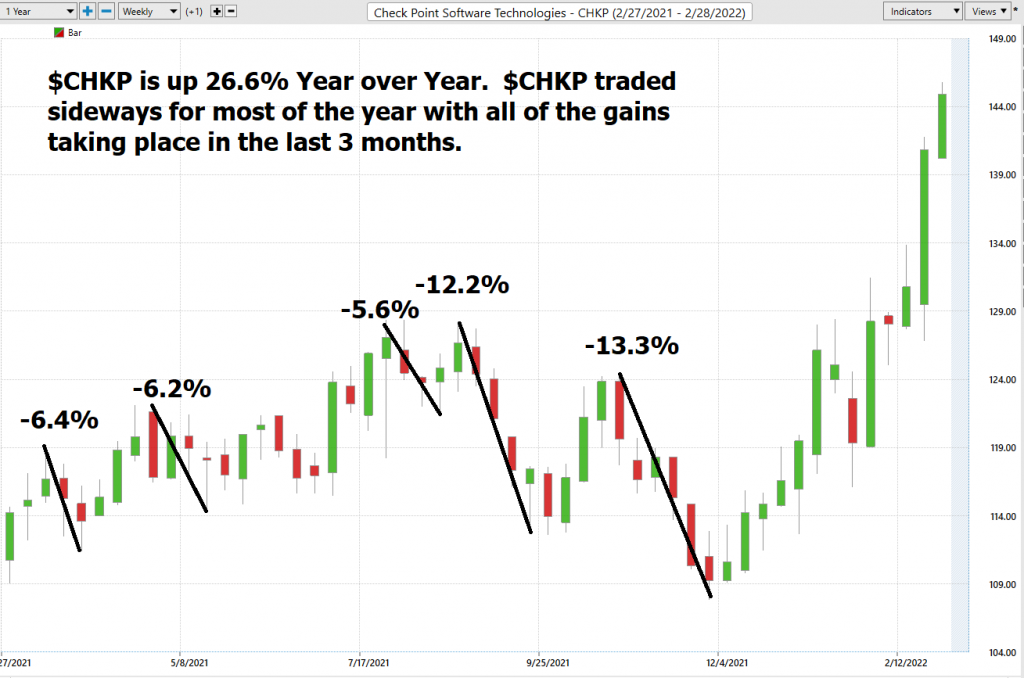
Here is a snapshot of the drawdowns that $CHKP has experienced over the past year measured on a percentage basis.
It’s worth doing this type of baseline analysis because it allows you to quickly compare understand the performance of $CHKP and to understand its risk and reward possibilities.
Next, we compare $CHKP to the major broad market indexes. Over the past year.
$CHKP +26.6%
Technology Select Sector SPDR ETF ($XLK) +14.59%
(This is a leading ETF is the tech space which we can compare returns to.)
S&P 500 Index +11.26%
Down Jones Industrials +6.06%
NASDAQ +20.87%
Russell 1000 Index +8.8%
So, in $CHKP have an asset which has outperformed the broader stock market indexes and outperform ed the top TECH specific ETF in the space. We are beginning to understand why it has had such large institutional participation.
The Vantagepoint A.I. Analysis
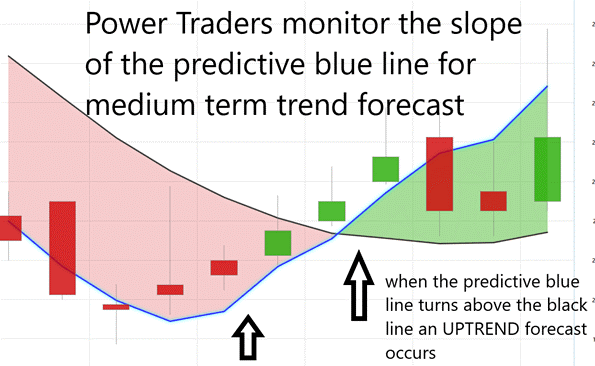
Using VantagePoint Software and the artificial intelligence, traders are alerted to trend forecasts by monitoring the slope of the predictive blue line. The black line is a simple 10 day moving average of price which simply tells you what has occurred in the market. The predictive blue line also acts as value zone where in uptrends traders try to purchase the asset at or below the blue line.
In studying the chart below pay close attention to the slope of the blue line.
Power Traders pay close attention to the relationship between where price closes in relation to the slope of the predictive blue line.
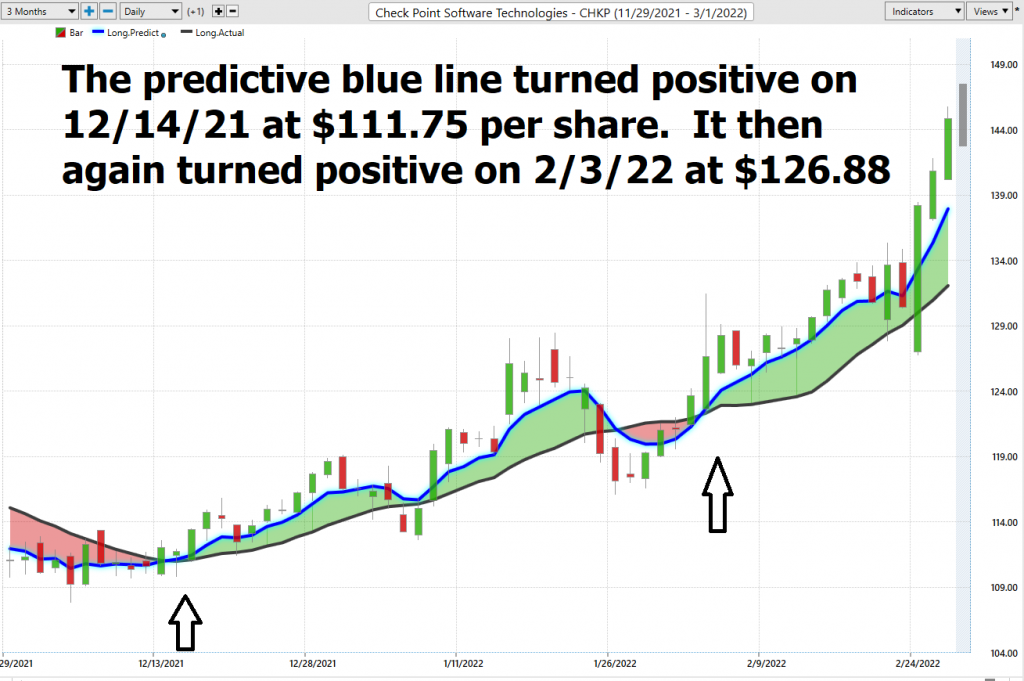
Power traders use the predictive blue line in helping to determine both the value zone as well as the trend direction. In other words, in an uptrend traders try to buy the asset at or below the predictive blue line.
Fine Tuning Entries with The Neural Net Indicator
At the bottom of the chart is the Neural Network Indicator which predicts future strength and/or weakness in the market. When the Neural Net Indicator is green it communicates strength. When the Neural Net is Red it is forecasting short term weakness in the market.
A Neural Net is a computational learning system that uses a network of functions to understand and translate massive amounts of data into a desired output, consistently monitoring itself and improving its performance.
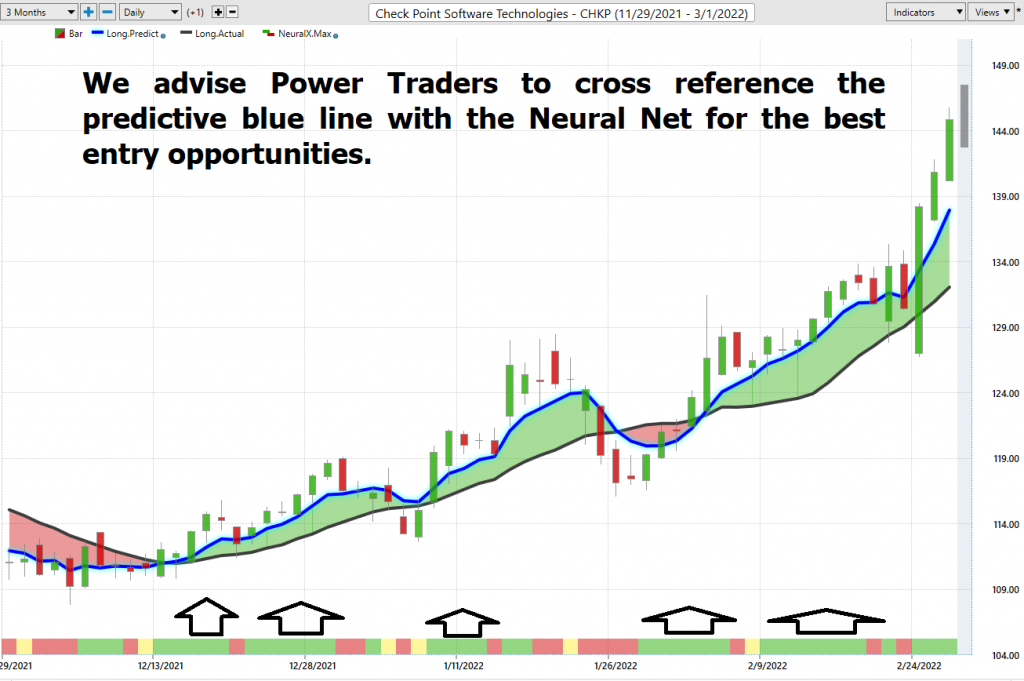
Whenever Power Traders are looking for statistically valid trading setups, they look for a DOUBLE confirmation signal. This signal occurs whenever the blue predictive line and the Neural Net at the bottom of the chart suggest the same future expected outcome.
We advocate that Power Traders cross reference the chart with the predictive blue line and neural network indicator to create optimal entry and exit points.
Power Traders are always looking to apply both the neural network and a.i. to the markets to find statistically sound trading opportunities.
We advise Power Traders to cross reference the predictive blue line with the Neural Net for the best entry opportunities.
Whenever Power Traders are looking for statistically valid trading setups, they look for a DOUBLE confirmation signal. This signal occurs whenever the blue predictive line and the Neural Net at the bottom of the chart suggest the same future expected outcome.
VantagePoint Software Daily Price Range Prediction
The purpose of all these indicators so far is to help traders stay on the right side of the right trend at the right time.
One of the powerful features in the Vantagepoint A.I. Software which Power Traders use daily is the Daily Price Range prediction forecast.
This forecast is what permits Power Traders to truly fine tune their entries and exits into the market often looking for smaller time frames and more granular trading opportunities.
Here is the price chart of $CHKP during the most recent runup featuring the Daily Price Range forecast and the Neural Net Indicator.
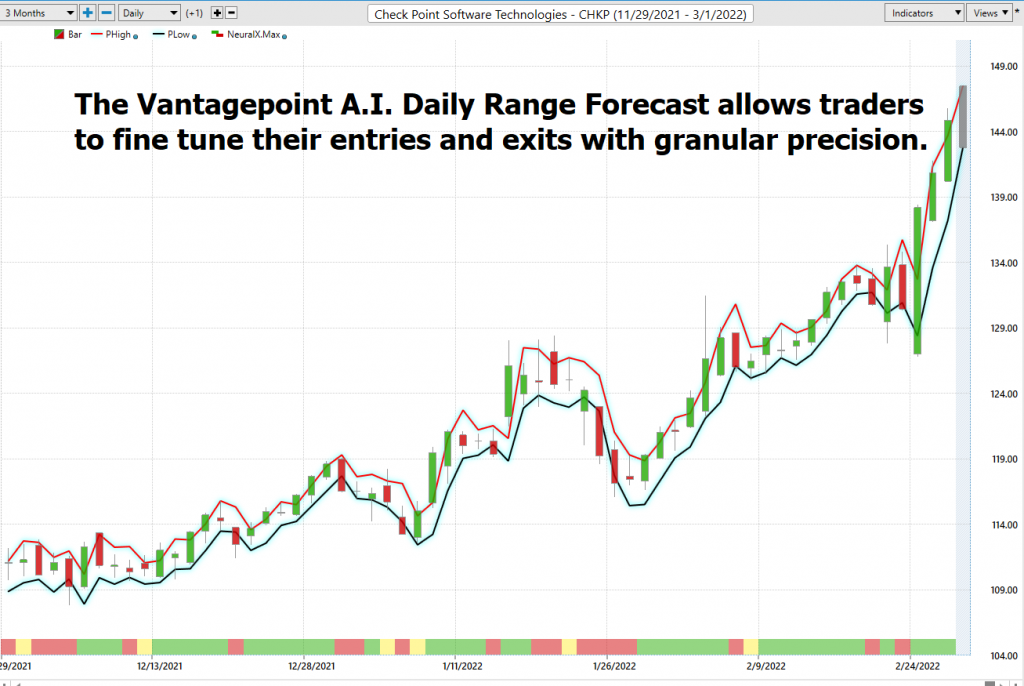
In summary, the trend turned up. Prices have surged since that forecast and the trend remained firmly UP. Traders have had numerous opportunities to purchase $CHKP towards the lower end of the daily price forecast to fine-tune their entries.
Intermarket Analysis
What makes the Vantagepoint Software truly unique is its ability to perform Intermarket analysis and to locate those assets which are most interconnected that are responsible for driving the price of $CHKP higher or lower.
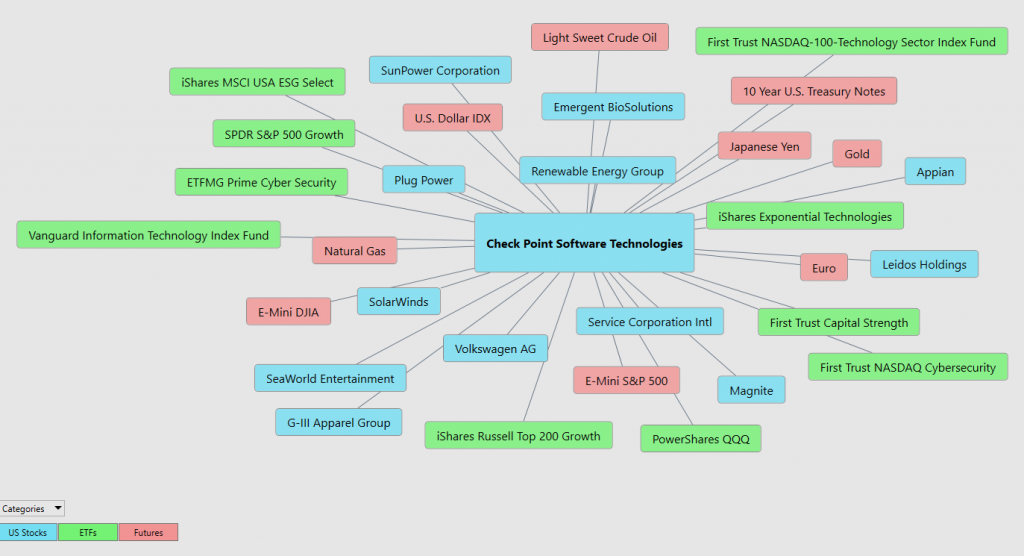
Studying the charts can always provide objective realities in terms of locating support and resistance levels which become very clear on a chart. But we live in a global marketplace. Everything is interconnected. The billion-dollar question for traders is always what are the key drivers of price for the underlying asset that I am trading?
These intangibles are invisible to the naked eye yet show extremely high statistical correlations.
Slight changes in Interest rates, Crude Oil Prices, and the Volatility of the dollar amongst thousands of other variables affect the decisions companies must make to survive in these incredibly challenging times. Trying to determine what these factors are is one of the huge problems facing investors and traders.
There is immense value to be had in studying and understanding the key drivers of $CHKP price action.
By doing so you can often see which ETFs are most likely acquiring $CHKP as well as uncovering other industries, commodities, forex which affect $CHKP price movement.
Our Suggestion
The next Earnings Report date for $CHKP is April 26, 2022, and it will be a key driver of the stock price for the remainder of 2022. Should $CHKP beat earnings estimates again we think we are looking at a very bullish scenario with the stock trading above its recent 10-year highs.
The digitalization of data and its protection is one of the giant growth industries of this decade. With cybercrime and hackers ever-present we think these tailwinds will support the entire cybersecurity sector. Now with war in Ukraine, the stakes are even higher for companies to protect their cyber assets at all costs.
Rising investments by enterprises and governments will follow suit and we think $CHKP will benefit from the madness. The long and short cyberattacks, ransomware and data breaches is that it is going to change how commerce and communication occurs digitally and what authentication methods will be used to prevent horrible things from happening to data.
As we pointed out in the Worst-Case analysis scenario it would be very normal to expect a 13% pullback in this stock. Horrible as current events are, these situations serve as a huge tailwind for the growth of the Cybersecurity industry.
The trend is UP. We urge all traders to practice good money management and allow the artificial intelligence to guide your decision-making process.
As mentioned earlier in this analysis whenever a stock makes 10-year highs you need to place it on your radar as it is communicating to the world that it is growing and overcoming all obstacles related to its business model.
Pay attention to $CHKP.
Let’s Be Careful Out There!
Remember, It’s Not Magic.
It’s Machine Learning.

IMPORTANT NOTICE!
THERE IS SUBSTANTIAL RISK OF LOSS ASSOCIATED WITH TRADING. ONLY RISK CAPITAL SHOULD BE USED TO TRADE. TRADING STOCKS, FUTURES, OPTIONS, FOREX, AND ETFs IS NOT SUITABLE FOR EVERYONE.
DISCLAIMER: STOCKS, FUTURES, OPTIONS, ETFs AND CURRENCY TRADING ALL HAVE LARGE POTENTIAL REWARDS, BUT THEY ALSO HAVE LARGE POTENTIAL RISK. YOU MUST BE AWARE OF THE RISKS AND BE WILLING TO ACCEPT THEM IN ORDER TO INVEST IN THESE MARKETS. DON’T TRADE WITH MONEY YOU CAN’T AFFORD TO LOSE. THIS ARTICLE AND WEBSITE IS NEITHER A SOLICITATION NOR AN OFFER TO BUY/SELL FUTURES, OPTIONS, STOCKS, OR CURRENCIES. NO REPRESENTATION IS BEING MADE THAT ANY ACCOUNT WILL OR IS LIKELY TO ACHIEVE PROFITS OR LOSSES SIMILAR TO THOSE DISCUSSED ON THIS ARTICLE OR WEBSITE. THE PAST PERFORMANCE OF ANY TRADING SYSTEM OR METHODOLOGY IS NOT NECESSARILY INDICATIVE OF FUTURE RESULTS. CFTC RULE 4.41 – HYPOTHETICAL OR SIMULATED PERFORMANCE RESULTS HAVE CERTAIN LIMITATIONS. UNLIKE AN ACTUAL PERFORMANCE RECORD, SIMULATED RESULTS DO NOT REPRESENT ACTUAL TRADING. ALSO, SINCE THE TRADES HAVE NOT BEEN EXECUTED, THE RESULTS MAY HAVE UNDER-OR-OVER COMPENSATED FOR THE IMPACT, IF ANY, OF CERTAIN MARKET FACTORS, SUCH AS LACK OF LIQUIDITY. SIMULATED TRADING PROGRAMS IN GENERAL ARE ALSO SUBJECT TO THE FACT THAT THEY ARE DESIGNED WITH THE BENEFIT OF HINDSIGHT. NO REPRESENTATION IS BEING MADE THAT ANY ACCOUNT WILL OR IS LIKELY TO ACHIEVE PROFIT OR LOSSES SIMILAR TO THOSE SHOWN.

