
Years ago, I heard a great analyst comment that you could ruin a great trader by teaching them how to read and write. Initially, I thought this was very insulting but the more I thought about it, and looked at my own experience trading the markets, I found it to be very revealing. When traders begin trading, they look to absorb everything that they can. What I have found is that as traders succeed, they find themselves purposely ignoring the majority of trading tools and simplifying their decision-making process with a handful of metrics or indicators that they have found to be consistently practical and effective.
Pivot Points are an extremely simple indicator that makes perfect logical sense and that anyone can immediately understand. It’s believed the basic concept of Pivot Points was created by floor traders in the pits to “frame their trade” using the most basic of inputs.
Floor traders focus on three basic inputs.
The High
The Low
The Close
They simply add all this information together divide by three and that provides you with a pivot point for the following period or trading session.
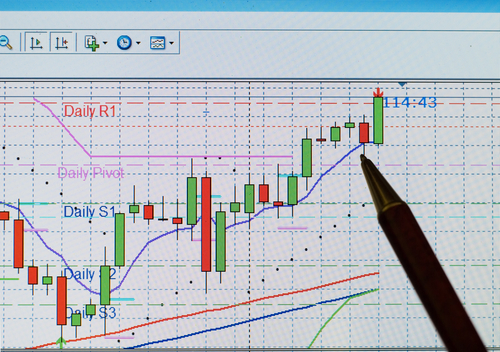
The PIVOT POINT is the boundary that acts like a value line in the sand to determine trend direction and value.
Arithmetically it makes perfect sense that in an UPTREND the price will consistently close above the pivot point. The inverse is also true, that in a DOWNTREND the price will consistently close below the pivot point. But within those simple inputs of HIGH, LOW and CLOSE floor traders derive important trading information from which floor traders would calculate SUPPORT and RESISTANCE levels. I’m referring to the trading range which is very simply defined and calculated as the difference between the high price and the low price. The trading range gives traders a very solid idea of how much volatility can be expected during a particular timeframe.
Pivot Points today are used on an infinite number of time frames. Traders use them on everything from 1-minute intraday charts to try and capture nano moves in the market to the longer period charts. My experience has been that using PIVOT POINTS on the WEEKLY, MONTHLY and QUARTERLY charts provides a very SOLID means of trend definition.
What makes PIVOT POINTS popular is they’re very easy to understand and calculate. Initially, try applying the WEEKLY PIVOT to whatever it is that you are trading. When you do, you will quickly discover that there is a tremendous amount of trading activity that takes place right around the pivot point. But this exact same logic can easily be applied to the monthly quarterly and annual pivot points. Each of these levels is an important boundary in helping define the trend.
Usually, a PIVOT POINT grid provides values for all of the following levels.
Resistance Level 3 = R3
Resistance Level 2 = R2
Resistance Level 1 = R1
PIVOT POINT = PP
Support Level 1 = S1
Support Level 2 = S2
Support Level 3 = S3
All these levels are calculated from the basic inputs of knowing the HIGH, LOW and Close of the asset you are tracking.
Let’s assume for purposes of discussion that we are looking at XYX stock over the previous week. Here is the formula for the standard PIVOT POINT.
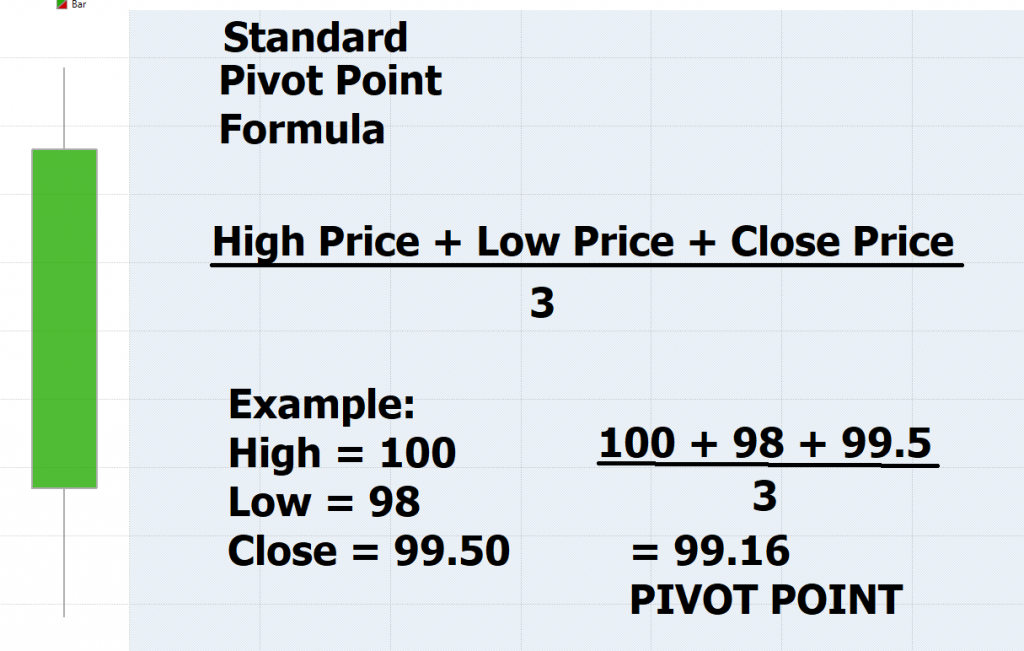
What the PIVOT POINT is really communicating at its essence is that if the next time frame is similar to the time frame that was just measured that these are the future expectations. This is why we prefer to use longer term time frames in our pivot point analysis.
The PIVOT POINT of 99.16 tells the traders in an UPTREND we would expect a close above that level. In a downtrend we would expect a close below that level. In a sideways trend we expect a lot of volume in and around that price level. Now, lets look at how SUPPORT and RESISTANCE are calculated from these same inputs.
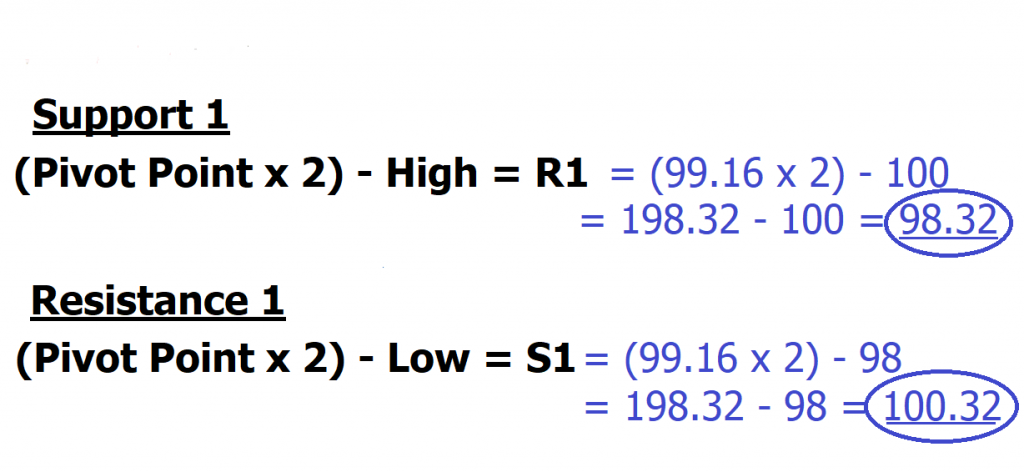
By simply using a little math and the High, Low and Close we have calculated a predicted range that attempts to define value.
In our Hypothetical Example, we are looking at the following.
Resistance 1 = R1 = 100.32
Pivot Point = 99.16
Support 1 = S1 = 98.32
Our experience has been that better than 70% of the time price will stay confined within these parameters. But one of the reasons that PIVOT points are so popular is because they are simple, and each boundary elicits an expected behavioral response. If you are BULLISH, you want to ideally buy at or as close as possible to the Pivot or S1 value. If you are bearish you want to sell at or as close as possible to the R1 or pivot value.
More importantly, we can quickly and easily define strength or weakness based upon how the current close is in relation to the boundaries presented on the PIVOT grid.
While the grid we have created so far is functional, floor traders in the pits decided they wanted to add another level of support and resistance to depict more extreme strength or weakness.
The formulas for the second level of support and resistance are as follows:
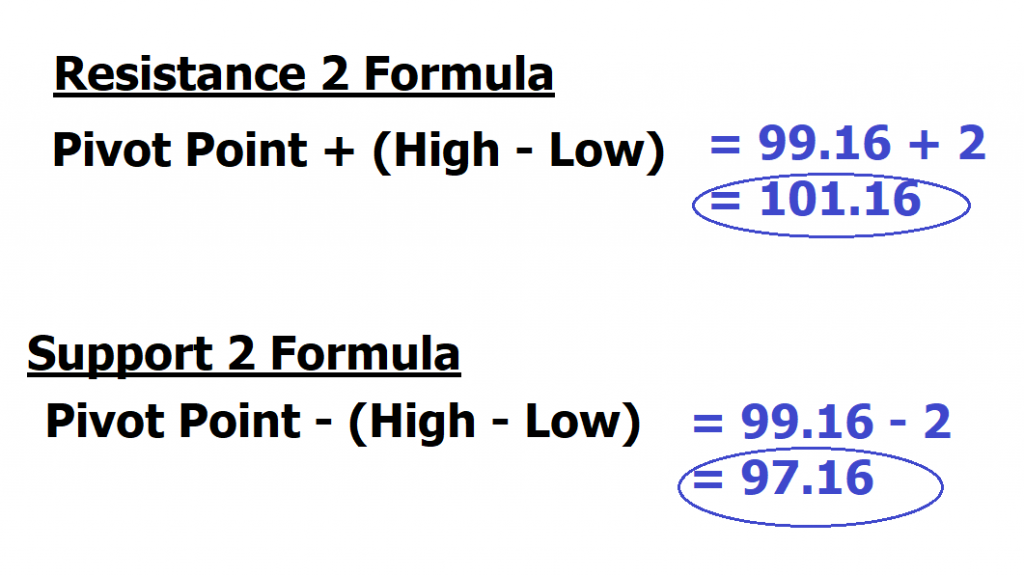
So, the entire PIVOT POINT grid has developed all from knowing the HIGH, Low, Close and the trading range for the previous time frame.
Here is what the grid would look like in our example:
R2 = 101.16
R1 = 100.32
PP = 99.16
S1 = 98.32
S2 = 97.16
How effective are Pivot Points?
That is a hard question to answer because every trader will use them differently. Many traders use Pivots and cross reference them with another one or two popular indicators to define their trading process.
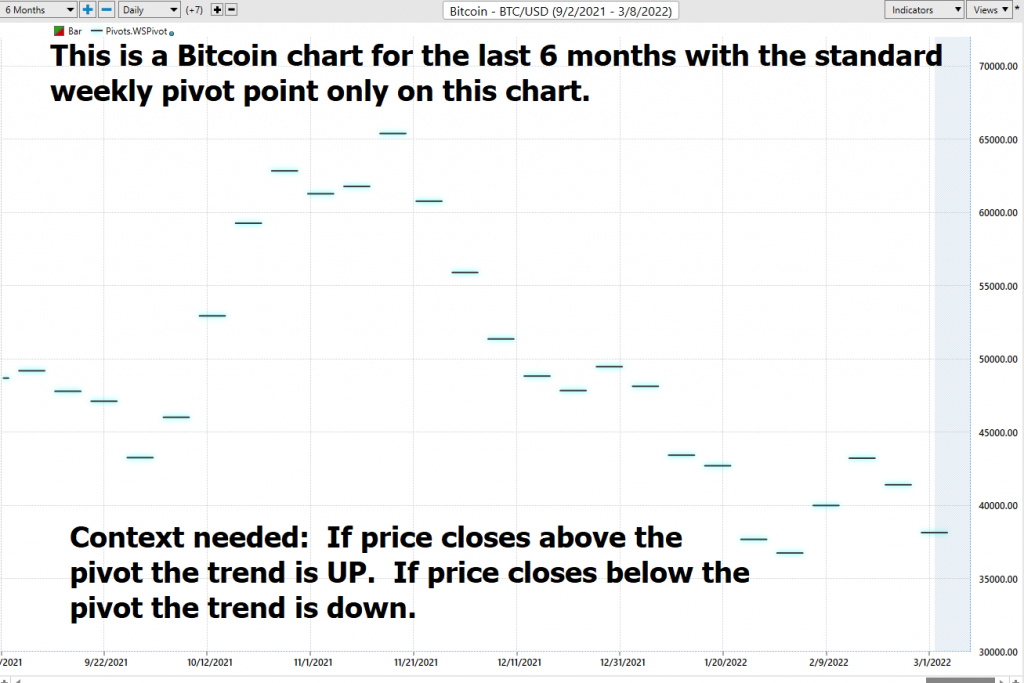
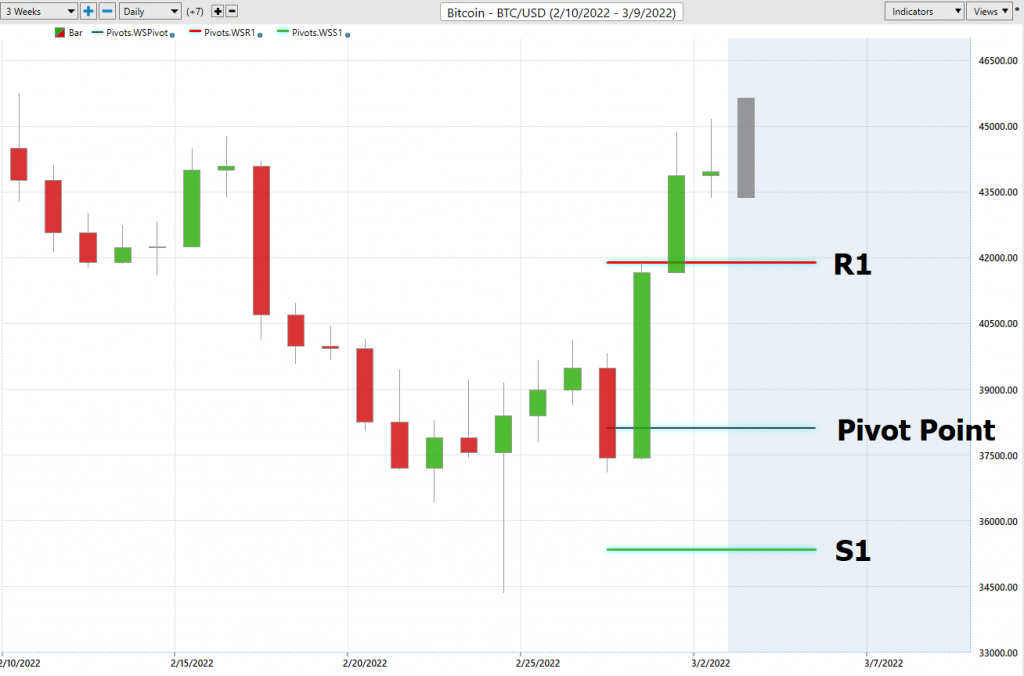
For example, let me apply what we have discussed so far to the Bitcoin chart. We will be using the weekly standard Bitcoin Pivot point which encompasses the highest high over the last 7 trading days, the lowest low of the last 7 trading days and the most current closing price.
The horizontal line is the weekly pivot point.
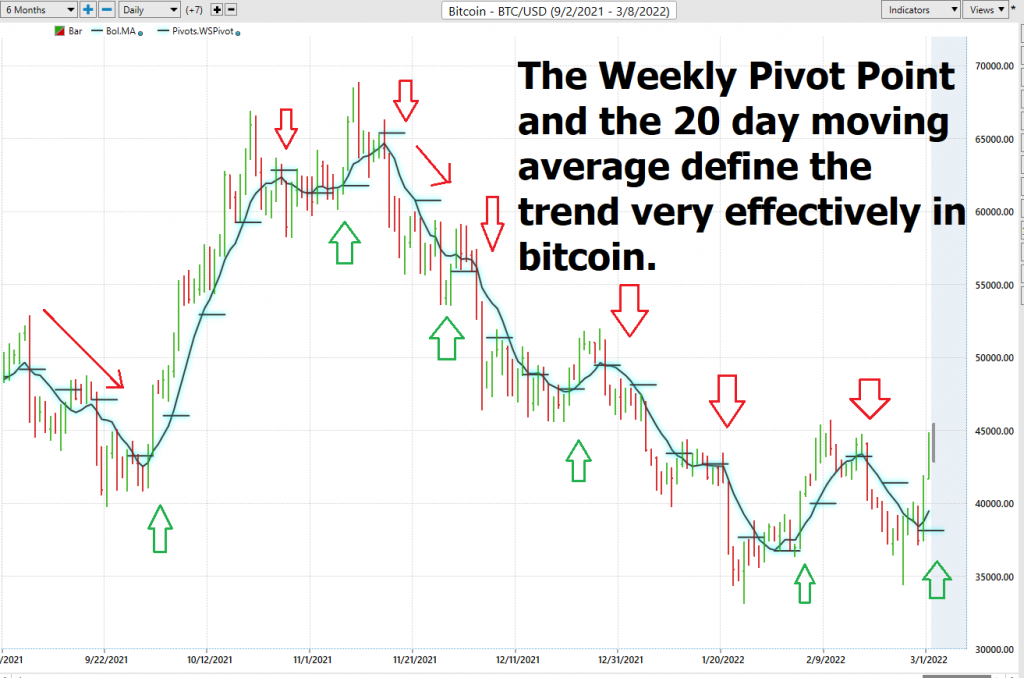
To provide more context let’s add a 20-period moving average which is what is traditionally used in the Bollinger Bands. Our new decision-making process is as follows:
Trend is UP if we close above the Pivot Point and the slope of the moving average is also up.
Trend is Down we close below the Pivot Point, and the slope of the Moving average is Down.
Pivot Points offer traders a simple and practical method to determine price direction, define the trend and determine the price levels where something is strong as well as weak. While originally designed for floor traders, the concepts behind Pivot Points can be applied across various timeframes.
As with all indicators, it is important to confirm Pivot Point signals with other aspects of technical analysis.
Once you understand the simplicity of Pivot Points you will quickly comprehend how traders like to tweak indicators to evaluate their ideas for effectiveness and feasibility. There are a multitude of Pivot formulas which all are derived from the basic standard formula.
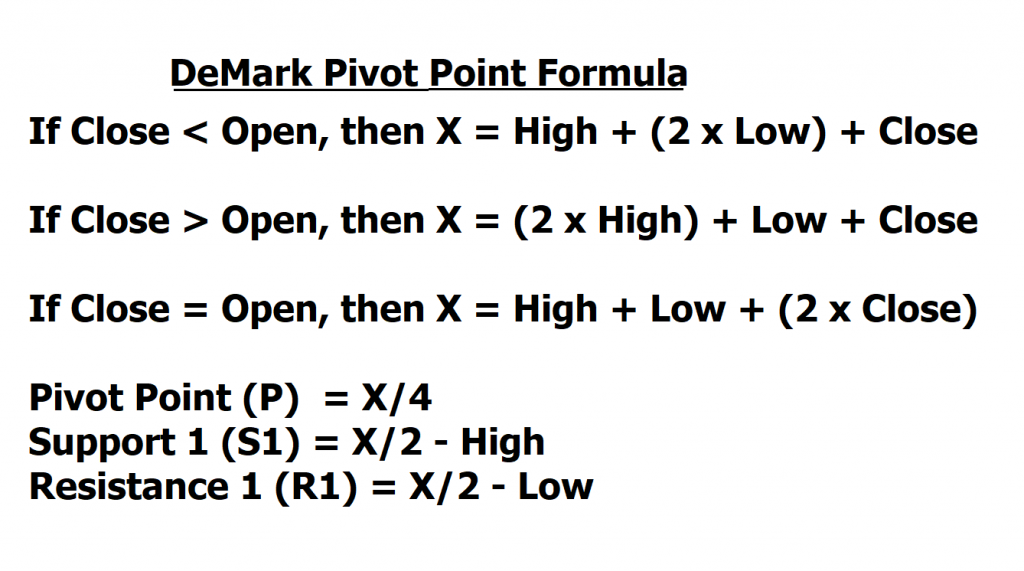
For example, chartist Tom Demark has tweaked the formula based entirely on where the price closes relative to the opening price. In other words, the DeMark Pivot Points are conditional on the relationship between the close and the open.
His formulas are as follows:
There are also those Pivot Point Traders who are enamored with the Golden Ratio. These traders will apply Fibonacci mathematics to the pivot points.
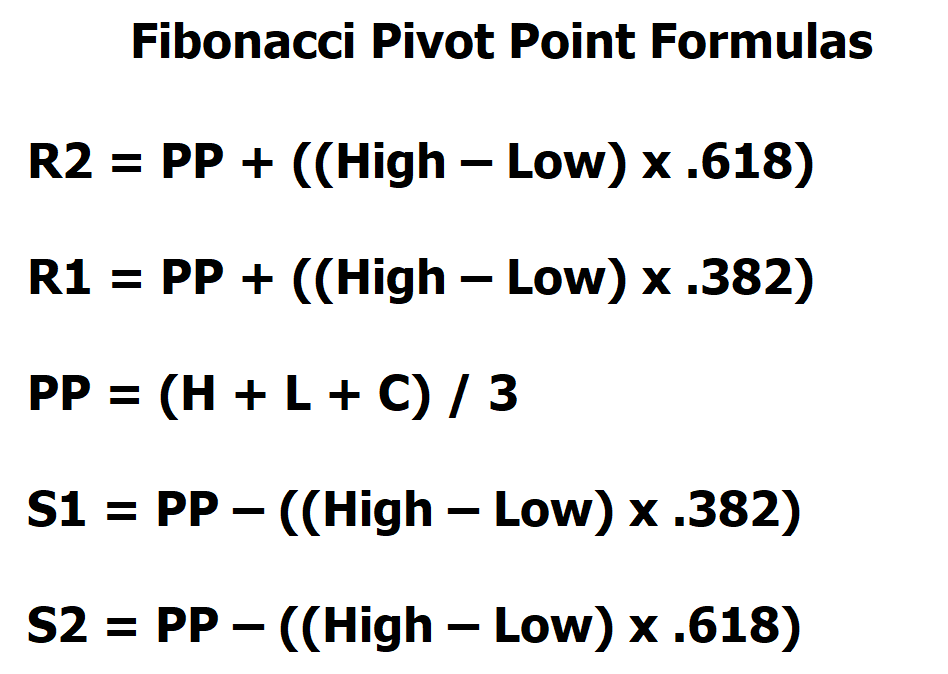
Fibonacci pivot point levels are determined by first calculating the pivot point like you would the standard method.
Next, multiply the previous sessions range with its corresponding Fibonacci level. Most traders use the 38.2%, 61.8% levels.
Finally, add or subtract the figures you get to the pivot point and voila, you’ve got your Fibonacci pivot point levels!
All these methods are available in the Vantagepoint A.I. software and can easily be placed on your charts for weekly, monthly quarterly and annual levels. The simplicity is immensely powerful.
My personal preference is the Standard Pivot Point Formula on the weekly Level placed on my daily charts. This is a very basic way to define the trend that I have found to be very effective. It uses the previous 7 days price data. Here is what it looks like:
My suggestion is that you test PIVOT POINTS against your decision-making process. As simple as they are when you apply them to a longer-term time frame, they become a very effective way to define the trend and understand risk.
Which pivot point method is best?
I don’t believe that there is a single best method. Often traders try to get very granular, and they don’t recognize that the most important aspect of trading is not trend direction but money management.
Success in trading boils down to understanding that you need to protect your bankroll at all costs.
Indicators are fascinating but they are always secondary to the way you manage your capital.
Then it really all depends on how you combine your knowledge of pivot points with all the other tools in your trading toolbox to create a method that works for you. It’s always about managing the risk versus the reward.
But now that you know how to calculate these pivot levels on your own, you can give them all a try and see which one works best for you.
Pivot away!
In our webinars we discuss how Power Traders find the strongest probability trades in either direction so that they can focus on being on the right side, of the right trend at the right time.
Do you have the tools and ability to find the strongest trends at right time in this economic environment? What is your plan for maintaining your purchasing power as the race to debase your purchasing power accelerates?
I’d like to invite you to visit with us at one of our Live Masterclass Webinars where we show how artificial intelligence is the only means to stay consistently up to date on the risk and reward opportunities in this environment.
What all traders and investors want is an accurate, proven solution that alerts you when a high probability trend is unfolding. The Vantagepoint A.I. forecasts have proven to be up to 87.4% accurate in determining the trend three days in advance.
Visit With US and check out the A.I. at our Next Live Training.
Discover why artificial intelligence is the solution professional traders go-to for less risk, more rewards, and guaranteed peace of mind.
It’s not magic. It’s machine learning.
Make it count.

IMPORTANT NOTICE!
THERE IS SUBSTANTIAL RISK OF LOSS ASSOCIATED WITH TRADING. ONLY RISK CAPITAL SHOULD BE USED TO TRADE. TRADING STOCKS, FUTURES, OPTIONS, FOREX, AND ETFs IS NOT SUITABLE FOR EVERYONE.
DISCLAIMER: STOCKS, FUTURES, OPTIONS, ETFs AND CURRENCY TRADING ALL HAVE LARGE POTENTIAL REWARDS, BUT THEY ALSO HAVE LARGE POTENTIAL RISK. YOU MUST BE AWARE OF THE RISKS AND BE WILLING TO ACCEPT THEM IN ORDER TO INVEST IN THESE MARKETS. DON’T TRADE WITH MONEY YOU CAN’T AFFORD TO LOSE. THIS ARTICLE AND WEBSITE IS NEITHER A SOLICITATION NOR AN OFFER TO BUY/SELL FUTURES, OPTIONS, STOCKS, OR CURRENCIES. NO REPRESENTATION IS BEING MADE THAT ANY ACCOUNT WILL OR IS LIKELY TO ACHIEVE PROFITS OR LOSSES SIMILAR TO THOSE DISCUSSED ON THIS ARTICLE OR WEBSITE. THE PAST PERFORMANCE OF ANY TRADING SYSTEM OR METHODOLOGY IS NOT NECESSARILY INDICATIVE OF FUTURE RESULTS. CFTC RULE 4.41 – HYPOTHETICAL OR SIMULATED PERFORMANCE RESULTS HAVE CERTAIN LIMITATIONS. UNLIKE AN ACTUAL PERFORMANCE RECORD, SIMULATED RESULTS DO NOT REPRESENT ACTUAL TRADING. ALSO, SINCE THE TRADES HAVE NOT BEEN EXECUTED, THE RESULTS MAY HAVE UNDER-OR-OVER COMPENSATED FOR THE IMPACT, IF ANY, OF CERTAIN MARKET FACTORS, SUCH AS LACK OF LIQUIDITY. SIMULATED TRADING PROGRAMS IN GENERAL ARE ALSO SUBJECT TO THE FACT THAT THEY ARE DESIGNED WITH THE BENEFIT OF HINDSIGHT. NO REPRESENTATION IS BEING MADE THAT ANY ACCOUNT WILL OR IS LIKELY TO ACHIEVE PROFIT OR LOSSES SIMILAR TO THOSE SHOWN.

