
![]()
This week’s stock analysis is Lululemon Athletica (LULU).
Lululemon was founded in 1998 by Chip Wilson in Vancouver, British Columbia, with its first standalone store opening in November 2000. The company’s initial public offering was in July 2007, raising $327.6 million by selling 18.2 million shares. In 2013, the company made its third consecutive appearance on Fortune’s Fastest-Growing Companies list. Lululemon sells athletic wear including tops, yoga pants, shorts, sweaters, jackets, and undergarments, as well as hair accessories, bags, yoga mats and water bottles. Lululemon trademarked its original fabric, Luon, which included a higher-than-average amount of nylon microfiber, in 2005. Since then, the company has produced several different types of fabrics, including compression and moisture-wicking designs. The company is primarily known for its yoga wear.
On its most recent earnings call the company reported adjusted profit of $1.16 a share, up 404% from the year-ago quarter. Sales jumped 88% to nearly $1.23 billion. The company is forecasting earnings of $1.10 to $1.15 per share for the second quarter of 2021 on revenue of $1.2 billion.
Lululemon’s core women’s business continues to do very well, but the company recently has expanded into the men’s category, as well as new markets like Europe and Asia. The company is forecasting a bright 2021 outlook. They are anticipating sales of $5.6 billion for the current fiscal year.
The company has a three-year annualized earnings growth rate of 19% and sales growth rate of 18%. Annual return on equity in Lululemon’s latest fiscal year was 27.3%. Annual pretax margin was 19.3%.
The company has 305 brick and mortar stores and has presence in 140 malls. One huge risk to the company is that many of the malls where it has entered into long-term leases are seeing less traffic and sales as more and more business is transacted online.
Analysts Ratings
26 Wall Street analysts have issued ratings and price targets for Lululemon Athletica in the last 12 months. Their average twelve-month price target is $394.33, predicting that the stock has a possible upside of 8.28%. The high price target for LULU is $500.00 and the low-price target for LULU is $275.00. There are currently 8 hold ratings, 17 buy ratings and 1 strong buy rating for the stock. Power Traders love to see this type of divergent opinion on a stock that is widely traded.
LULU has had huge momentum. It’s become a favorite stock of swing traders.
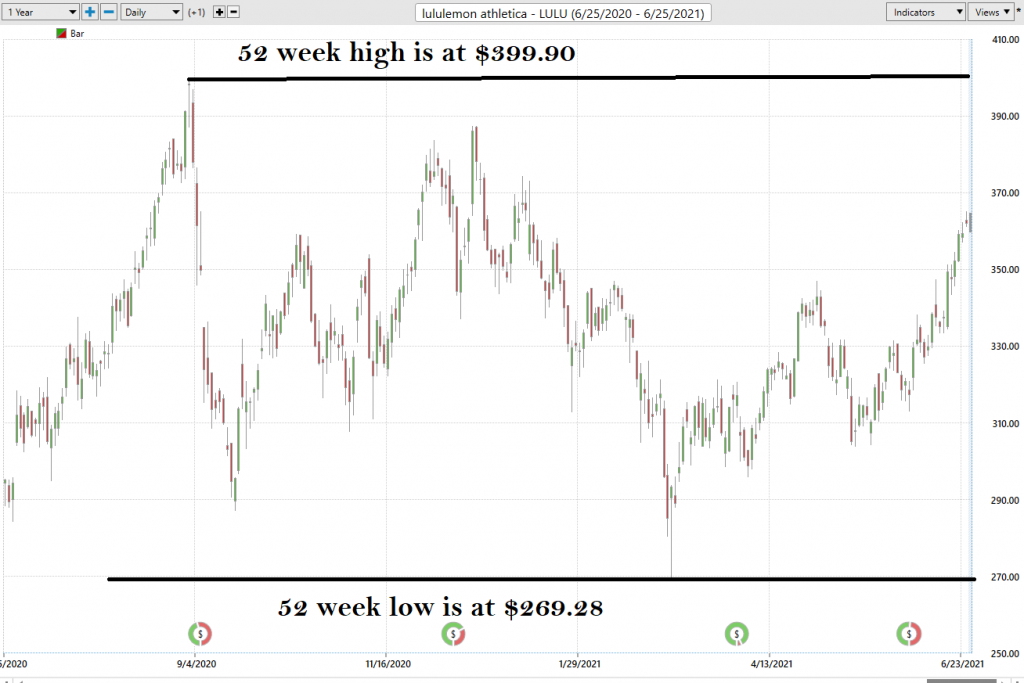
52-week High-Low Chart
Over the last 52 weeks LULU has traded as high as $399.90 and as low as 269.28. This means provides us with an annual trading range of $130.62. When we divide this metric by 52 weeks, we can determine that the average weekly trading range for LULU is $2.51. We refer to these as the commonsense metrics which we use as baseline measurements of understanding normal value. When using artificial intelligence, we look to amplify our returns based upon these baseline measurements.
Whenever we trade, we always pay attention to where we are in relation to the 52-week trading range. It is very common to see the 52 week high provide very strong resistance to the market until it is breached. Often when the 52-week high is breached we will see the stock price explode higher very quickly over a very short period of time.
What is obvious about studying the LULU chart is that EARNINGS are the major catalyst driving the LULU stock price. If you look at the EARNINGS ICON at the bottom of the chart you can see how the stock moves violently before and after the earnings are announced.
Power Traders focus only upon the A.I. forecast in these particular time frames to exploit a strong short-term trend.
It is worth being aware of what happened on the quarterly earnings announcements over the last year.
9/8/20 earnings announcement saw the stock fall $77 per share in 11 days.
12/10/20 earnings announcement stock fall $30 before rallying $30 in 5 days.
3/30/21 earnings announcement saw the stock fall $10 before rallying $50 in 19 days.
6/3/21 earnings announcement saw the stock rally almost $35 in 16 after earnings of .91 cents per share were disclosed.
Awareness of this volatility is very valuable to a trader as the trends are sharp and sudden.
The A.I. can be invaluable in these instances. Power Traders focus on the earnings announcement and will trade in the general direction of the A.I. trend forecast when the earnings announcements occur.
Lululemon Athletica has not formally confirmed its next earnings publication date, but the company’s estimated earnings date is Tuesday, September 14th, 2021, based off prior year’s report dates. Based upon what has occurred in the past year this time frame will be the next major catalysts for driving the price higher or lower.
We strongly advise that traders pay primary attention to where we are in the 52-week trading range whenever we look to trade a stock.
LULU appears to have new long-term support at the most recent 52 week LOW. Based upon the stocks recent price action and momentum we anticipate that the stock will eventually test its 52-week high over the next few months but also feel that the stock will move to the lower end of its trading channel multiple times before doing so.
The Vantagepoint A.I. Analysis
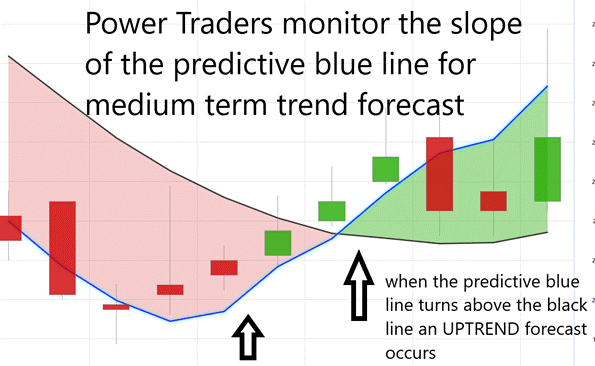
Using VantagePoint Software and the artificial intelligence, traders are alerted to trend forecasts by monitoring the slope of the predictive blue line. The black line is a simple 10 day moving average of price which simply tells you what has occurred in the market. The predictive blue line also acts as value zone where in uptrends traders try to purchase the asset at or below the blue line.
In studying the chart above pay close attention to the relationship between the black line and predictive blue line. The black line is just a simple 10 day moving average. It’s calculated by taking the closing prices of the last 10 days and dividing that sum by 10. All that the black line tells you is what has occurred. It tells you where prices have been and what the average price over the last ten days is.
The predictive blue line, on the other hand utilizes that Vantagepoint patented Neural Network and Intermarket Analysis to arrive at its value. It looks at the strongest price drivers of an asset through artificial intelligence and statistical correlations to determine its value.
We will analyze the time frame from May 20, 2021 to June 25, 2021 for LULU stock so that you can appreciate the power of the artificial intelligence in a real-time trading situation.
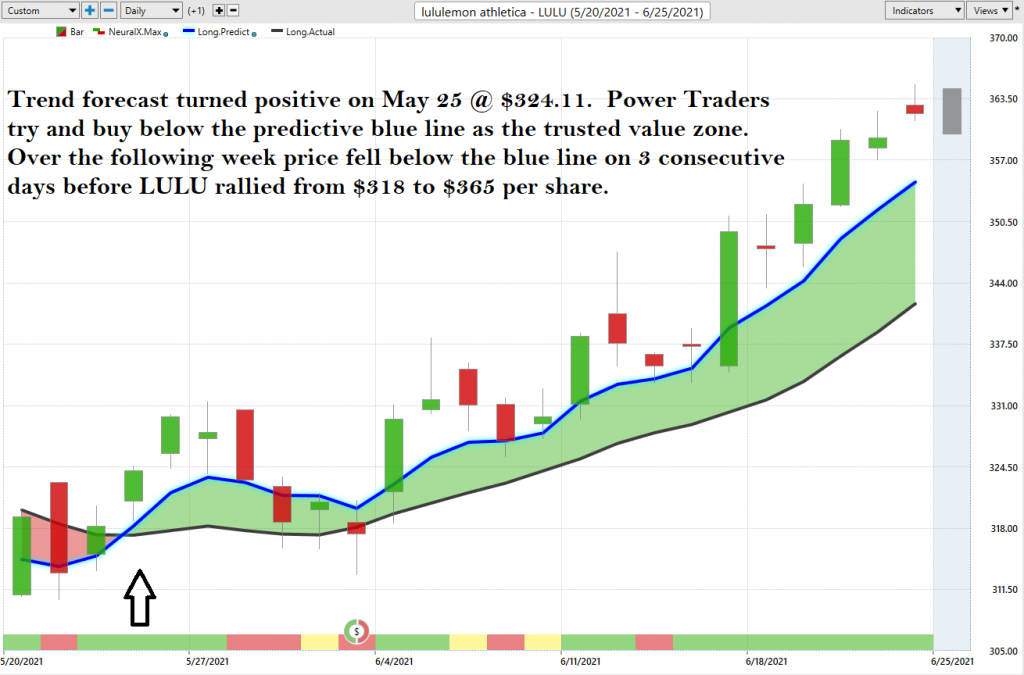
Whenever we see the predictive blue line move above the black line, we are presented with an UP-forecast entry opportunity. This is what occurred on May 25, 2021 @ $324.11 per share.
Power traders use the predictive blue line in helping to determine both the value zone as well as the trend direction.
Observe how the SLOPE of the predictive blue line started moving higher a few days previous to its moving above the black line. Prices declined into the earnings announcement and exploded violently after the earnings were disclosed. Prices rallied from $318 to as high as $365 per share.
Fine Tuning Entries with The Neural Net Indicator
At the bottom of the chart is the Neural Network Indicator which predicts future strength and/or weakness in the market. When the Neural Net Indicator is green it communicates strength. When the Neural Net is red it is forecasting short term weakness in the market.
We advocate that Power Traders cross reference the chart with the predictive blue line and neural network indicator to create optimal entry and exit points.
Power Traders are always looking to apply both the neural network and A.I. to the markets to find statistically sound trading opportunities.
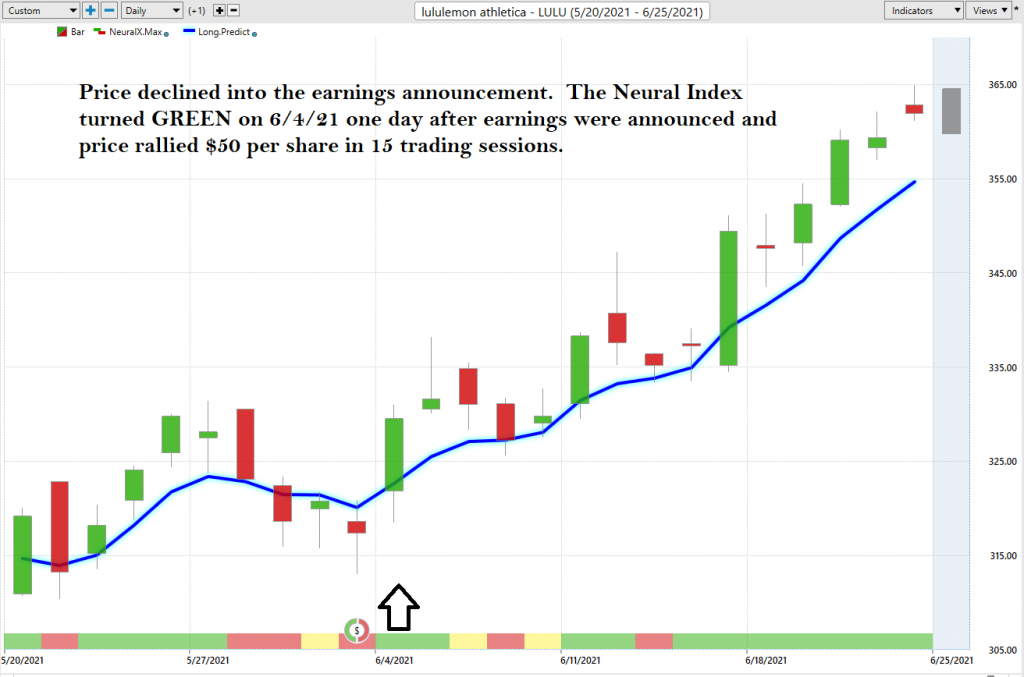
We advise Power Traders to cross reference the predictive blue line with the Neural Net for the best entry opportunities. Observe how the slope of the predictive blue line has remained positive from the time earnings were announced.
VantagePoint Software Daily Price Range Prediction
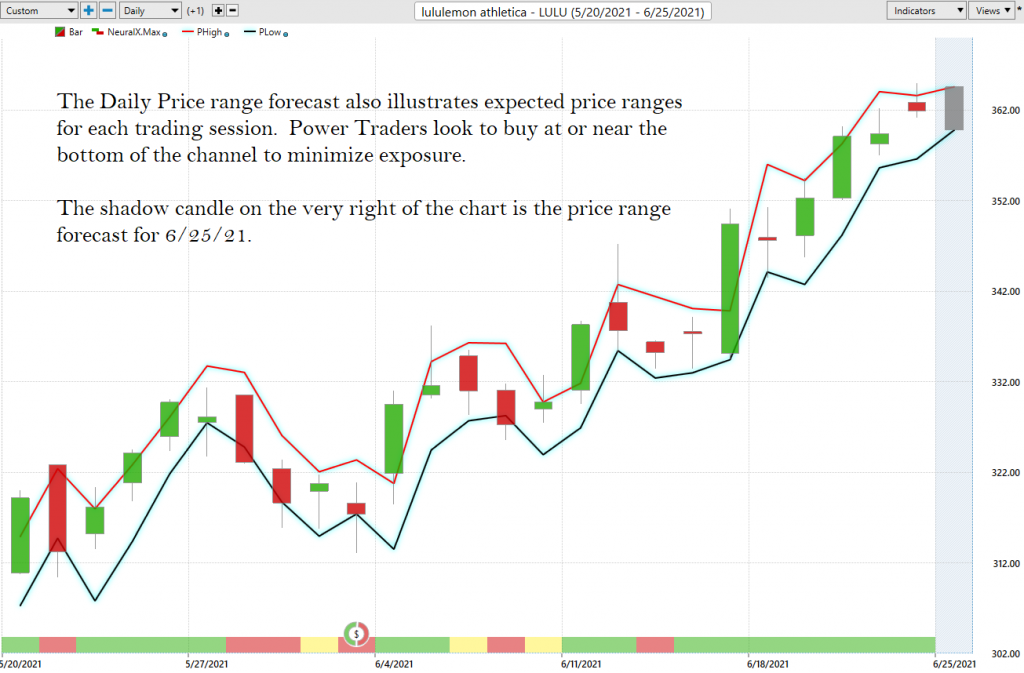
One of the powerful features in the Vantagepoint A.I. Software which Power Traders use on a daily basis is the Daily Price Range prediction forecast.
This forecast is what permits Power Traders to truly fine tune their entries and exits into the market.
Here is the price chart of LULU during the most recent runup featuring the Daily Price Range forecast and the Neural Net Indicator.
In summary, the trend turned up. Prices have surged since that forecast and the trend remain firmly UP. Traders have had numerous opportunities to purchase LULU towards the lower end of the daily price forecast to fine tune their entries.
One other very powerful feature of the Vantagepoint Software is the Verified Support and Resistance levels. These levels feature where the market is expected to encounter buying and selling at certain price levels.
You can clearly see how valuable this information is.
Traders in uptrends look to buy at verified support levels. They look to either exit or reduce exposure at verified resistance levels.
When a price enters verified resistance for several consecutive days it is a confirmation that you are dealing with a very strong trend. In these instances, traders look to buy weakness anticipating that new highs will soon occur.
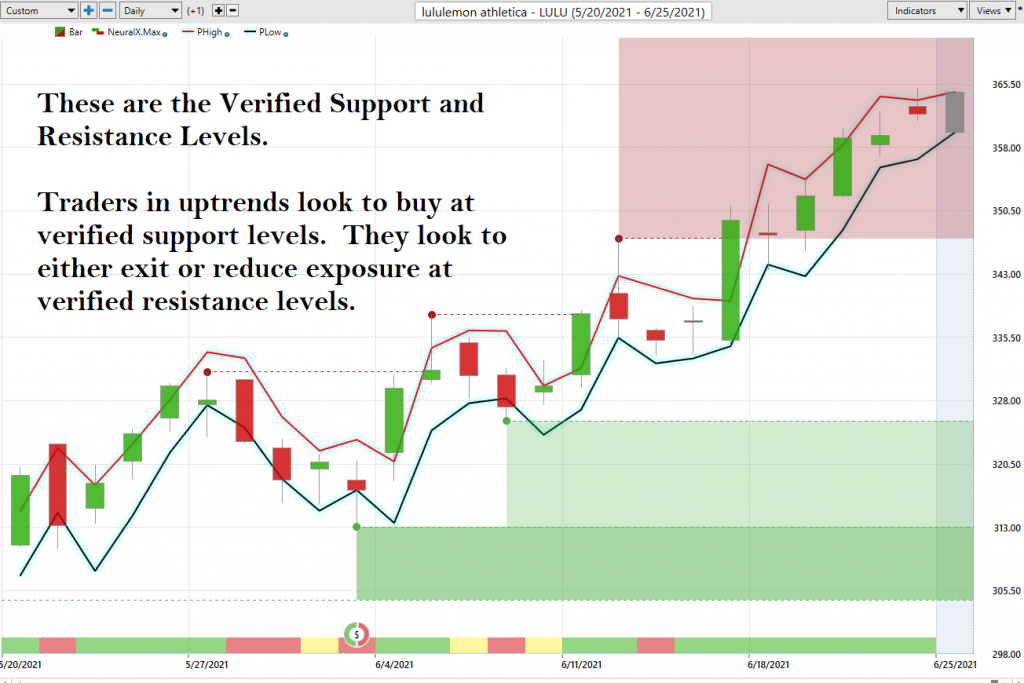
Observe how the predictive price low also provided numerous short term entry opportunities for traders to buy LULU as it was trending higher.
Intermarket Analysis
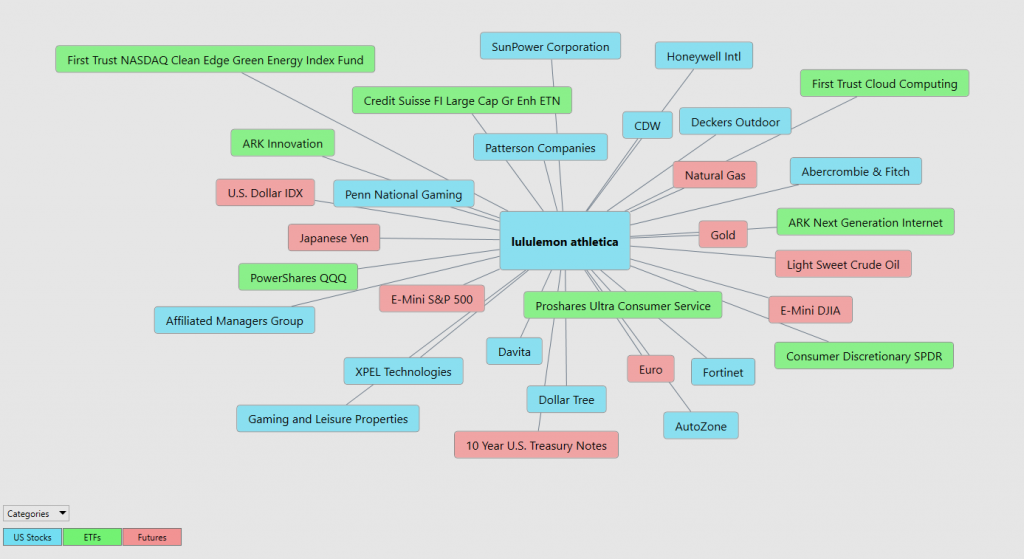
What makes the Vantagepoint Software truly unique is its ability to perform Intermarket analysis and to locate those assets which are most interconnected that are responsible for driving the price of LULU higher or lower.
Studying the charts can always provide objective realities in terms of locating support and resistance levels which become very clear on a chart. But we live in a global marketplace. Everything is interconnected. The billion-dollar question for traders is always what are the key drivers of price for the underlying asset that I am trading?
These intangibles are invisible to the naked eye yet show very high statistical correlations.
Small changes in Interest rates, Crude Oil Prices, and the Volatility of the dollar amongst thousands of other variables affect the decisions companies must make to survive in these very challenging times. Trying to determine what these factors are is one of the huge problems facing investors and traders.
There is great value to be had in studying and understanding the key drivers of LULU price action.
By doing so you can often see which ETFs are most likely acquiring LULU as well as uncovering other industries which affect LULU price movement.
Our Suggestion
The consensus of analysts’ opinions shows that LULU is fairly valued around $395. With the stock currently trading around $360 we think it is a good swing trading candidate. When it moves to the bottom of its channel or A.I. valuation it is worthy of your attention as a short-term trade.
Momentum is very strong on this asset. Since the company continues to outperform on its earnings estimates we think this tailwind will propel prices higher, but it will not be a straight shot.
This stock is pricey at almost 82x next year’s earnings and 12x sales.
The company is working diligently to increase its online footprint. But 72% of its sales happen in its brick-and-mortar facilities. The company will benefit from and end to the Covid-19 pandemic and lockdown.
If the company can increase its online sales to its desired 50/50 split by 2026, the stock could have many years of explosive growth.
LULU is a great swing trading stock. We have it firmly on the radar and look for opportunities to buy weakness with stops below the lows of the current A.I. daily forecast.
Our advice: Follow the A.I. trend analysis and practice good money management on all of your trades.
LULU breaking to new highs recently looks like a confirmation that it will test its 52-week highs as the company plans to announce its next earnings number in September.
Let’s Be Careful Out There!
Remember, It’s Not Magic.
It’s Machine Learning.

IMPORTANT NOTICE!
THERE IS SUBSTANTIAL RISK OF LOSS ASSOCIATED WITH TRADING. ONLY RISK CAPITAL SHOULD BE USED TO TRADE. TRADING STOCKS, FUTURES, OPTIONS, FOREX, AND ETFs IS NOT SUITABLE FOR EVERYONE.
DISCLAIMER: STOCKS, FUTURES, OPTIONS, ETFs AND CURRENCY TRADING ALL HAVE LARGE POTENTIAL REWARDS, BUT THEY ALSO HAVE LARGE POTENTIAL RISK. YOU MUST BE AWARE OF THE RISKS AND BE WILLING TO ACCEPT THEM IN ORDER TO INVEST IN THESE MARKETS. DON’T TRADE WITH MONEY YOU CAN’T AFFORD TO LOSE. THIS ARTICLE AND WEBSITE IS NEITHER A SOLICITATION NOR AN OFFER TO BUY/SELL FUTURES, OPTIONS, STOCKS, OR CURRENCIES. NO REPRESENTATION IS BEING MADE THAT ANY ACCOUNT WILL OR IS LIKELY TO ACHIEVE PROFITS OR LOSSES SIMILAR TO THOSE DISCUSSED ON THIS ARTICLE OR WEBSITE. THE PAST PERFORMANCE OF ANY TRADING SYSTEM OR METHODOLOGY IS NOT NECESSARILY INDICATIVE OF FUTURE RESULTS. CFTC RULE 4.41 – HYPOTHETICAL OR SIMULATED PERFORMANCE RESULTS HAVE CERTAIN LIMITATIONS. UNLIKE AN ACTUAL PERFORMANCE RECORD, SIMULATED RESULTS DO NOT REPRESENT ACTUAL TRADING. ALSO, SINCE THE TRADES HAVE NOT BEEN EXECUTED, THE RESULTS MAY HAVE UNDER-OR-OVER COMPENSATED FOR THE IMPACT, IF ANY, OF CERTAIN MARKET FACTORS, SUCH AS LACK OF LIQUIDITY. SIMULATED TRADING PROGRAMS IN GENERAL ARE ALSO SUBJECT TO THE FACT THAT THEY ARE DESIGNED WITH THE BENEFIT OF HINDSIGHT. NO REPRESENTATION IS BEING MADE THAT ANY ACCOUNT WILL OR IS LIKELY TO ACHIEVE PROFIT OR LOSSES SIMILAR TO THOSE SHOWN.

